Build with Dhan: Request Indicators you want us to add on TradingView (tv.dhan.co)

Please add

  1. FVG (Fair Value Gap) identifier ,

2)Different types of divergence combined to one indicator like (RSi + Macd + Volume+ Stochastic )

  1. Breakout indicator like say after three touches (editable) if 4 touch candle close above or below all three touch of same range it helps identify breakout

  2. you already have Previous day OHLC indicator in your chart but please add chart label to it like PDC , PDH , PDL

1 Like

Can events be made available on tv.dhan ?

  1. Can we have a multi moving average indicator which can change automatically when we change from say daily to weekly to monthly - for example say it has three ma options which can selected between simple and exponential and then three can be chosen independently like 21,50 200 for daily, 10 and 40 for weekly and 10 for monthly.

  2. Volume indicator on which the MA can change automatically when the charts are changed from daily(50) to weekly(10) to monthly (10)

  3. Any option to adjust of the thickness of the OHLC bars. The ones in TV are very thin and can’t seen properly.

in india nitinbhai is very good at pine script and his indicator mix mars indicator is very good than relative strength.
so please consider to add MIX MARS indicator and its code is open source.
it is as under

// This source code is subject to the terms of the Mozilla Public License 2.0 at Mozilla Public License, version 2.0
// © finallynitin

//original concept from dman103
//modified from “Percentage Relative Strength” script by dman103 Percentage Relative Strength — Indicator by dman103 — TradingView

//@version=5

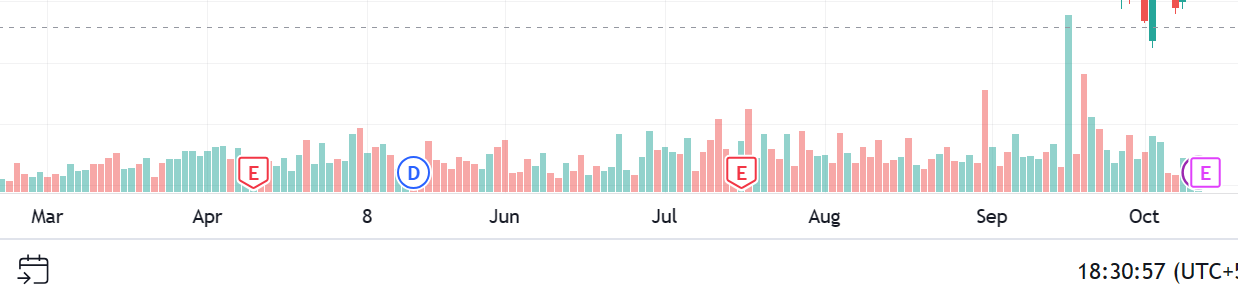
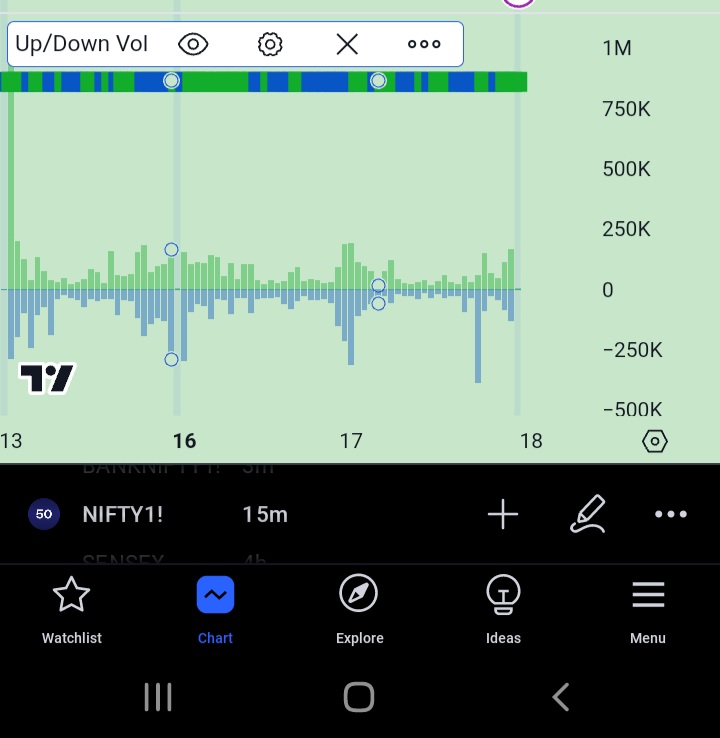
indicator(‘Moving Average Relative Strength’, shorttitle=“MARS”, timeframe=‘’)

//Inputs

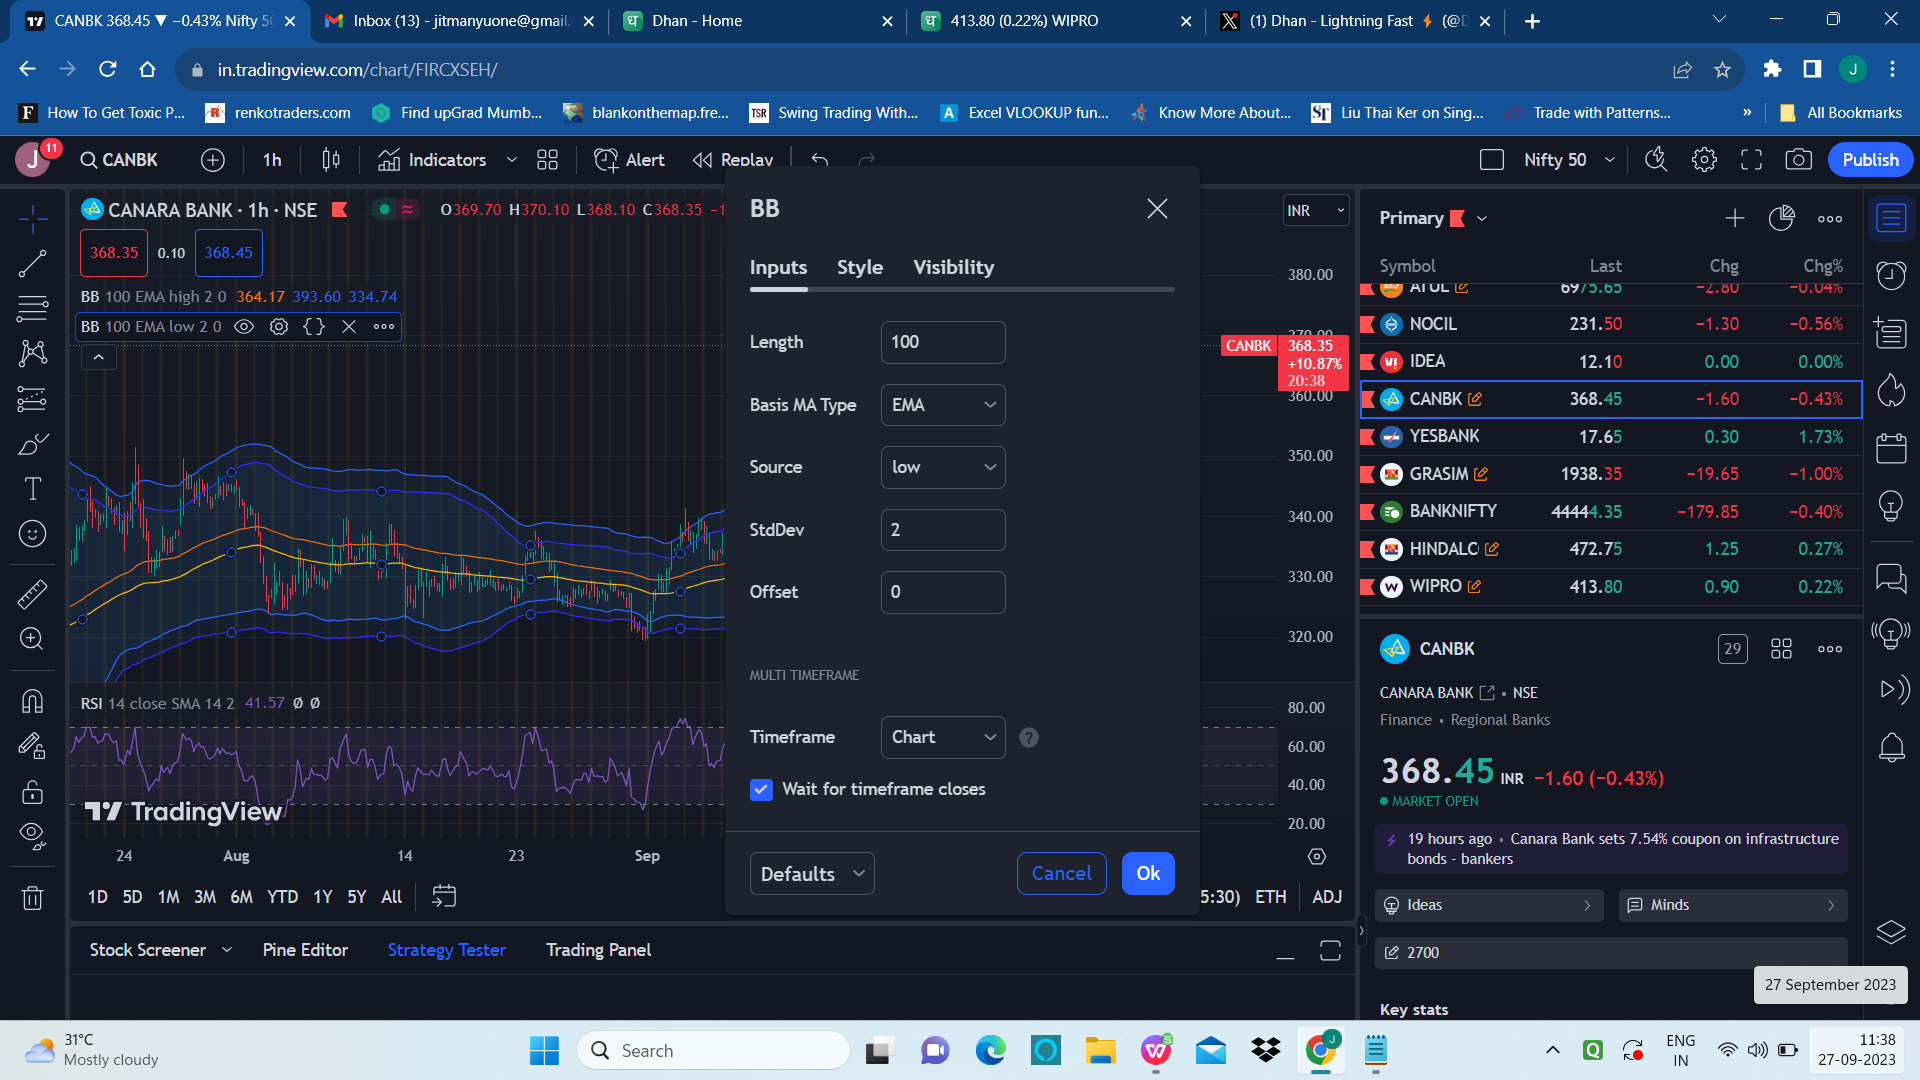
matype = input.string(title=‘Moving Average Type’, defval=‘SMA’, options=[‘SMA’, ‘EMA’, ‘WMA’], group=‘Moving Average’)
malength = input(title=‘Moving Average Length’, defval=50, group=‘Moving Average’)

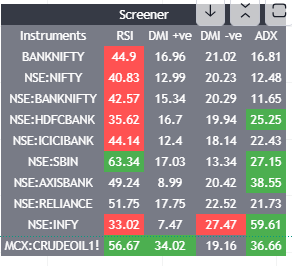
index = input.string(title=‘Index to compare To’, defval=‘NSE:NIFTY’, options=[‘NSE:NIFTY’, ‘NSE:CNX500’, ‘NSE:NIFTYSMLCAP250’, ‘NSE:CNXSMALLCAP’],group=‘Relative Strength’)
compareToOtherIndex = input.bool (title=“Compare to different index?”, defval=false,group=‘Relative Strength’,inline=‘Different compare’)
otherIndex = input.symbol(title=‘’, defval=‘’,group=‘Relative Strength’,inline=‘Different compare’)

Paintbar=input(false,‘Paint Bar?’, group=“Customisation”)
Backgroundcolor=input(true,‘Background Color?’, group=“Customisation”)
Easycolors=input(false,‘Easy Colors?’, group=“Customisation”)
showZeroLine = input.bool(defval=false, title=“Show Zero Line”, inline=‘line 1’, group=“Customisation”)
zerocolor = input(color.black, title=‘’, inline=‘line 1’, group=“Customisation”)

//Color palette

ropcolor = input(#32CD32, “Relative Outperformance”, group=“Histogram Colors”)
gopcolor = input(#228B22, “Gross Outperformance”, group=“Histogram Colors”)
aopcolor = input(#5ea3f0, “Absolute Outperformance”, group=“Histogram Colors”)

rupcolor = input(#df6b90, “Relative Underperformance”, group=“Histogram Colors”)
gupcolor = input(color.maroon, “Gross Underperformance”, group=“Histogram Colors”)
aupcolor = input(color.black, “Absolute Underperformance”, group=“Histogram Colors”)

ColorUp = #5ea3f0
ColorDown = #df6b90

//Configuring the Moving Average
ma_function(source, length) =>
if matype == ‘SMA’
ta.sma(source, length)
else
if matype == ‘EMA’
ta.ema(source, length)
else
if matype == ‘WMA’
ta.wma(source, length)

// Basic conditions

indexToUse = compareToOtherIndex==false ? index : otherIndex
closeIndex = request.security(indexToUse, timeframe.period, close)

ma = ma_function(close, malength)
maIndex = ma_function(closeIndex, malength)

symbolPercent = (close - ma) / ma * 100
indexPercent = (closeIndex - maIndex) / maIndex * 100
val = symbolPercent - indexPercent

priceIsAboveMa = close > ma
priceIsAboveIndexMa = closeIndex > maIndex
indexgreen = request.security(indexToUse, timeframe.period, priceIsAboveIndexMa)

priceIsBelowMa = close <= ma
priceIsBelowIndexMa = closeIndex <= maIndex
indexred = request.security(indexToUse, timeframe.period, priceIsBelowIndexMa)

iff_1 = indexred ? #FBAED2 : color.black
IndexColor = indexgreen ? #9BDDFF : iff_1

//Color coding

rop = indexred and priceIsBelowMa and val>0
gop = indexgreen and priceIsAboveMa and val>0
aop = indexred and priceIsAboveMa

rup = indexgreen and priceIsAboveMa and val<0
gup = indexred and priceIsBelowMa and val<0
aup = indexgreen and priceIsBelowMa

BarColor = rop ? ropcolor : gop ? gopcolor : aop ? aopcolor : rup ? rupcolor : gup ? gupcolor : aup ? aupcolor : color.gray

EasyColor = val >= 0 ? ColorUp : ColorDown

//Plots

BackColor = color.new(IndexColor, 20)

bgcolor(Backgroundcolor? BackColor : na)

barcolor(Paintbar? BarColor : na)

plot(val, color=Easycolors ? EasyColor : BarColor, style=plot.style_columns, linewidth=5)

plot(showZeroLine ? 0 : na, linewidth=1, color=zerocolor, title=“Zero Line”)

@RahulDeshpande @Naman @Poornima @PravinJ

and indicator discription is
https://www.tradingview.com/script/Lv26g1XV-MARS-Moving-Average-Relative-Strength/

second is siple range indicator
indicator link is
https://www.tradingview.com/script/ilaDGmwW-Simple-Range/

@RahulDeshpande @Naman @PravinJ @Poornima

third is

https://www.tradingview.com/script/oBswL9v2-Quarterly-Earnings/

fourth is

https://www.tradingview.com/script/oHBA2gfQ-SwingConfidence-Score/

@Naman @RahulDeshpande @PravinJ

If possible please add this indicator which can help many intrday traders community.
as we see RSI, ADX on bottom of chart,
want to same see in main price chart.
i know it is not practically possible for you to add all complex indicators of tradingview.
i have made simple pinecode for the same.
TV-Main v1 — Indicator by NavinAgicha2 — TradingView
it can really help many traders.
if possible please consider this, these on options chart will be really helpful in intraday trading.
i can sit with your team to make this.
@Naman @RahulDeshpande @PravinJ @Poornima

Hey Dhan team… If you can make built-in watchlist like you made for stocks for all fno stocks ATM CE and PE it will help a lot to trader…

1 Like

Index wise breath analysis indicator example
How money stocks above moving average and advance decline line , every indicator used as breath analysis for index very useful for market current phase @RahulDeshpande

2 Likes

VWAP with deviation bands on trading view.

current Vwap doesn’t has deviation bands.

1 Like

@PravinJ
Yes price alerts and indicator value alerts are a must.

Up down volume

Personally i don’t use multiple indicators. But it will be great if you give orderflow or footprint charts in TV dhan (or you can set something up with it ) it can be really benifited for options traders (specifically for index option trader ) i don’t know if there is any other broker providing such chart in india. So you also got really good product addition as it.

1 Like

Please add following indicators available in Free account of Trading view as follows:

  1. Relative strength (modhelius)

  2. RSI Trend indicator PSAR based (trader harikrishna)

  3. Bollinger band (with full settings) as on TV free account:

Please sir add anchored volume profile tool.
@RahulDeshpande @PravinJ

2 Likes

Could you please add 52 week High and Low indicator on the chart

image
Please bring an indicators screener and scanner, which is much needed by every trader.
@Naman @PravinJ @RahulDeshpande @Poornima @Dhan

3 Likes

Can you pls provide Smoothed Heikin Ashi indicator Smoothed Heiken Ashi Candles v1 — Indicator by jackvmk — TradingView

Please add invite only script , my script strategy is followed by more then 4500 plus tradingview users

1 Like

Hi Dhan Team,

Thank you for such good efforts. Actually below are the community indicator in Trading view paid version. The beauty of these two indicators is most of the stocks follow the support and resistance levels plotted by either of these two indicators. It would be helpful if you add this indicator in Dhans trading view terminal.

1.Natural number 180 and 360 Gann
2.Natural whole number