but for that i have to take premium version of tradingview platform and that will have extra burden on me and i am just started to learning trading options. so its not viable for right now may be in future once i develop a profitable strategy then i will do it
Kind request to take a look on below mentioned indicator:
Indicator Name: Volume Delta [hapharmonic]
Source: Tradingview
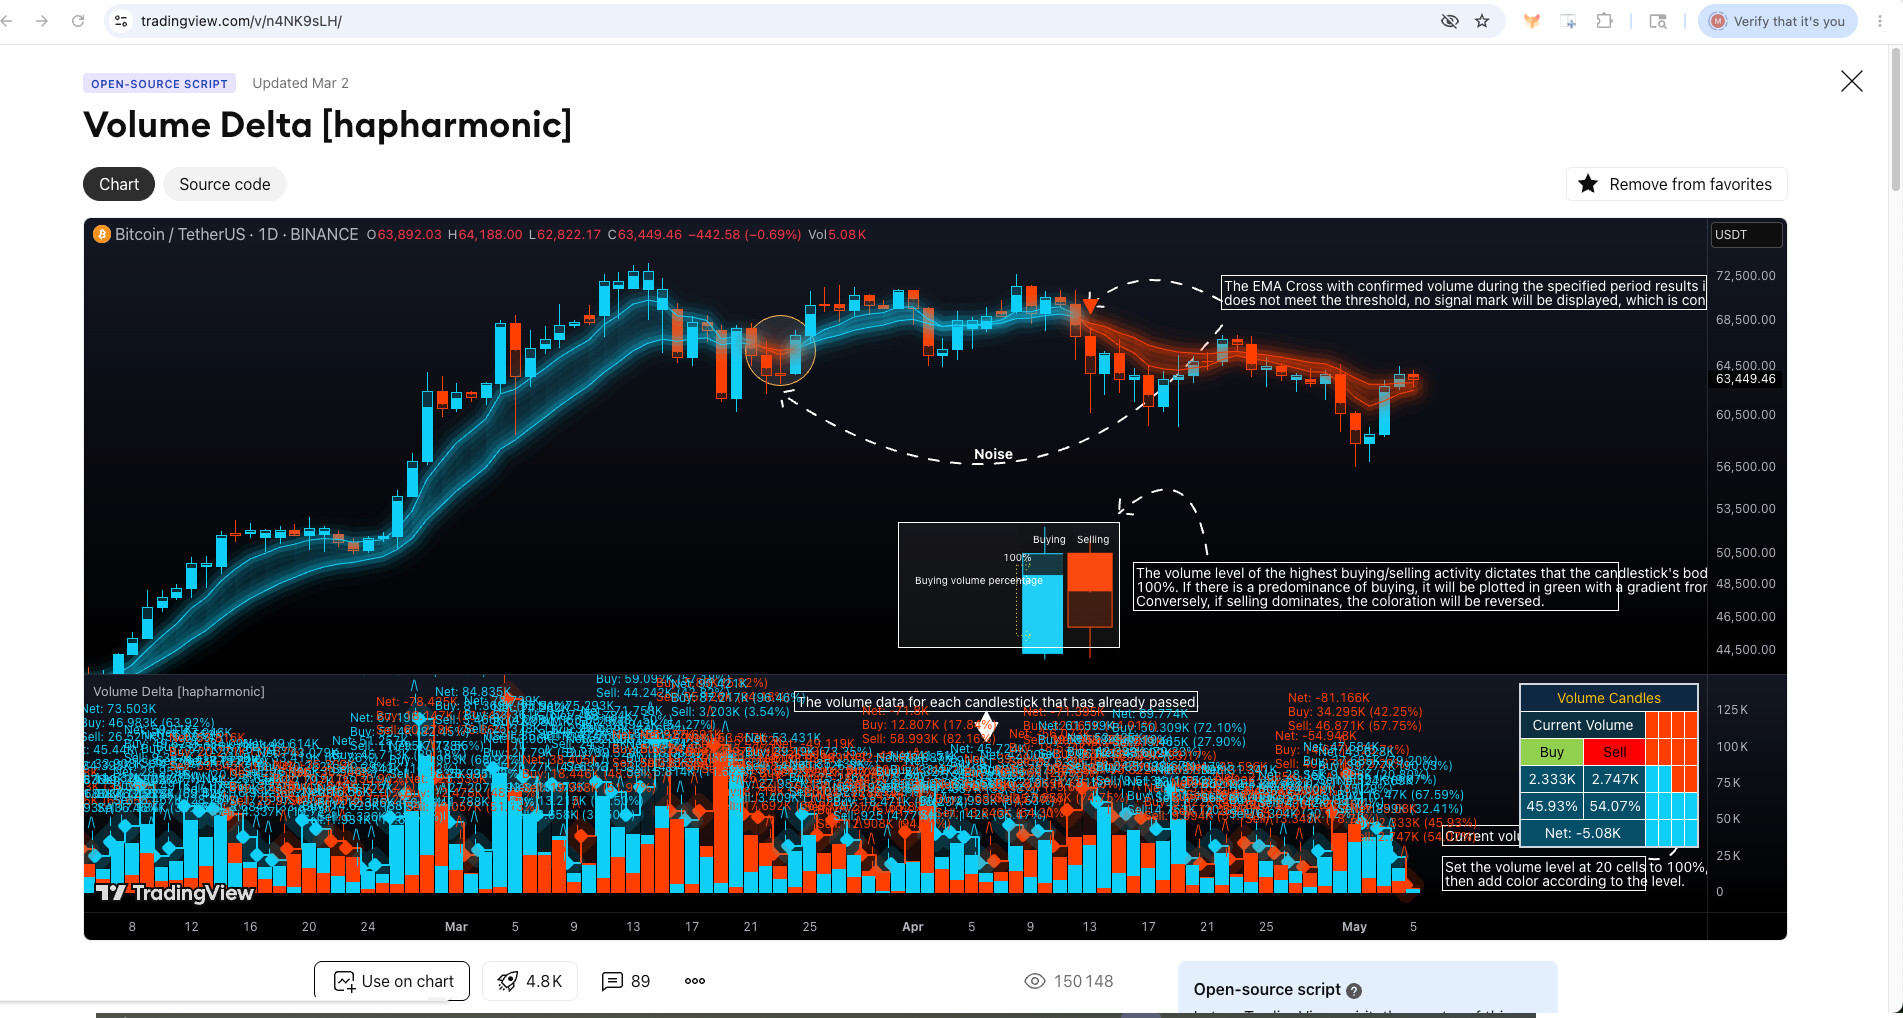
Kind request to take a look on below mentioned indicator:
Indicator Name: Smart Money Concepts (SMC) [LuxAlgo]
Source: Tradingview
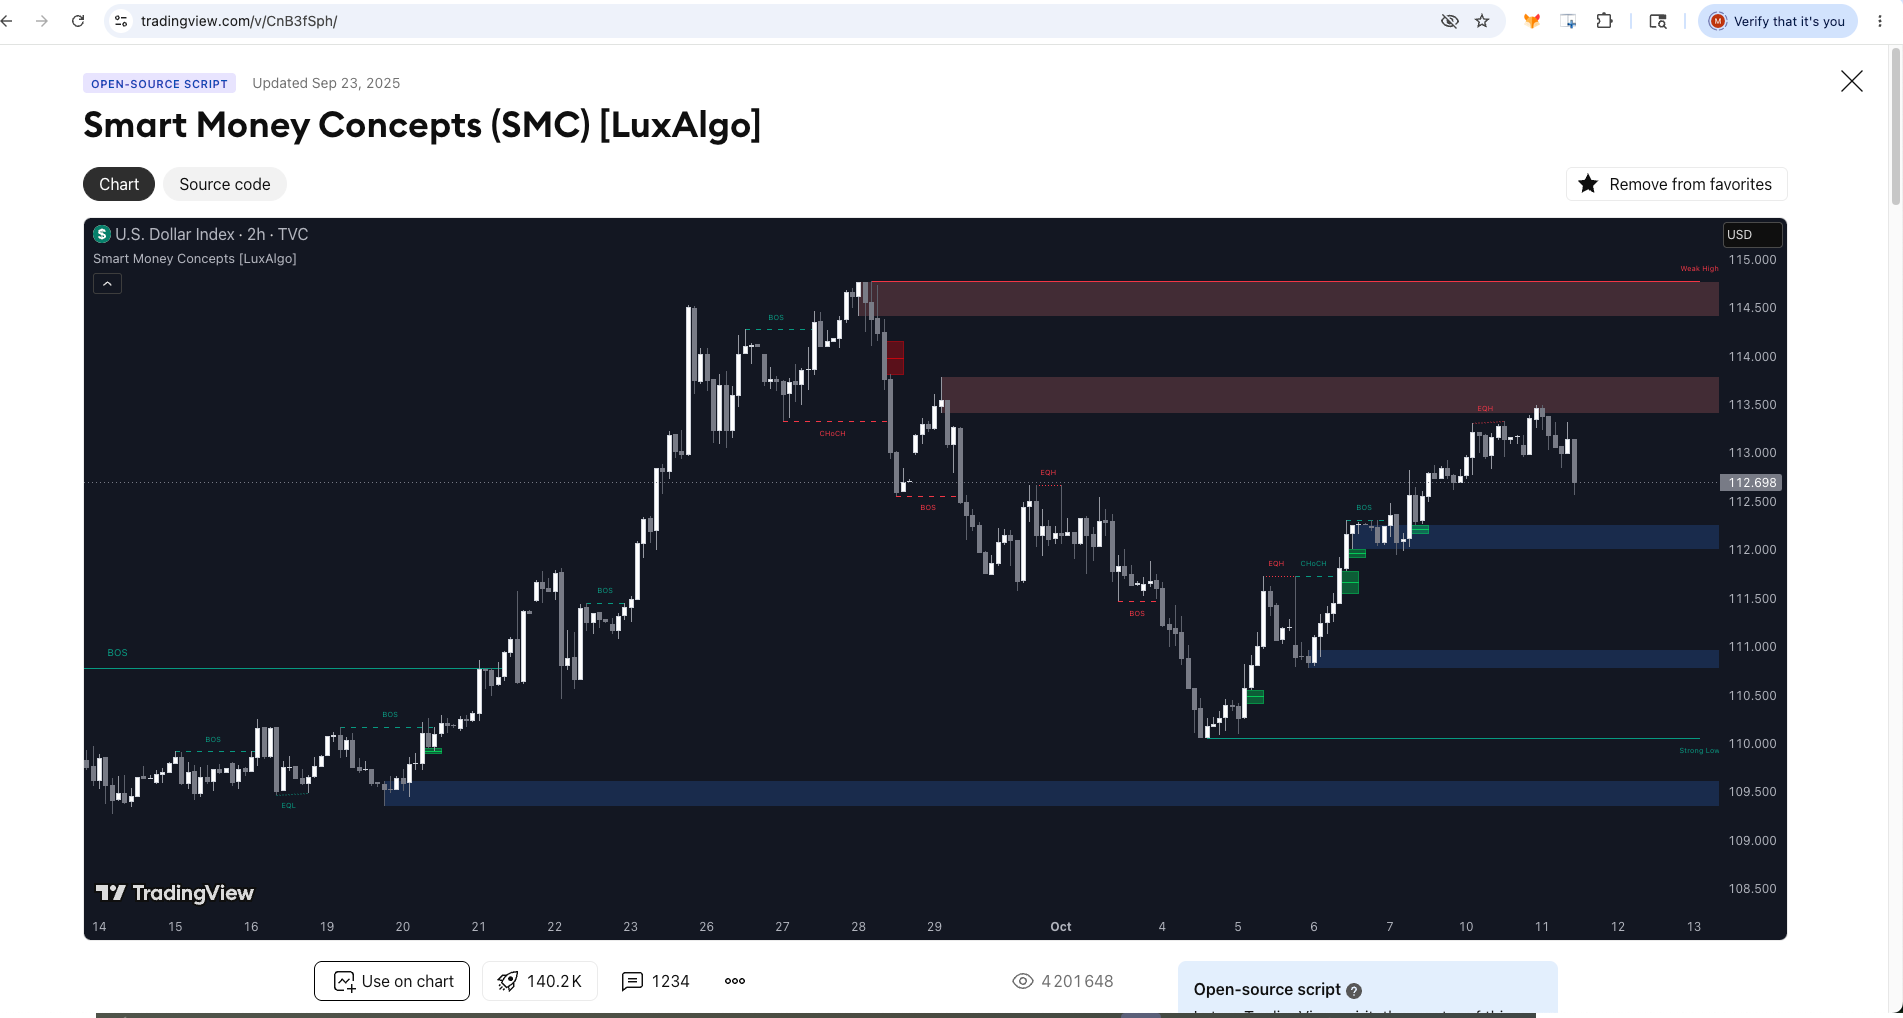
@dhingrab — thanks for the consistent contributions across MFT over the years. Your posts have been some of the cleanest format we’ve received — request plus source link in the same post. Full status across the asks you’ve made:
- Multi-timeframe VWAP with standard deviation bands (this October 2023 post) — live as Anchored VWAP With Bands
- RSI plotted as candles (same post) — live as RSI Chart Bars
- Darvas Box (your February 2024 follow-up) — live as of today
- Smoothed Heikin Ashi candles (November 2023) — still open, on the radar
- High Low Bands (November 2023) — still open
- Advanced OI change per strike on chart (July 2024) — partially addressed via Multi Open Interest; the per-candle-click format is a separate UI ask
- Delivery Percentage on chart (October 2025) — still open
Three full indicator asks shipped, one bug resolved, four still open with honest reasons. The contribution quality has consistently been high — that kind of well-framed feedback genuinely shapes what gets prioritised.
@Sandhyarani — thanks for the contribution in Cycle 1. The Option Scalper V2 you’d asked for is now live as Super Scalper on Dhan Charts. Launch post here. Worth pulling it up to see how the implementation feels for your options setups.
@Amitsharma — thanks for the Cycle 1 ask back in October 2023. Super Scalper went live on Dhan Charts today with the 5-min and 15-min timeframe support you’d specified. The wait was longer than it should have been, but it’s there now.
@Shivasekaran — thanks for the Cycle 1 contribution back in October 2023. Of the four asks in your post (CPR for today, CPR for tomorrow, Darvas Box, Supply and Demand zones), three are now live. CPR Daily, Weekly, Monthly, and Tomorrow have all been live for a while. Darvas Box went live today. Supply and Demand Zones is still on the active list — has been asked for by enough members that it’s being evaluated for an upcoming build window.
You’d ended your post with “is enough for me  ” — five of those asks now built, only one left. Good list.
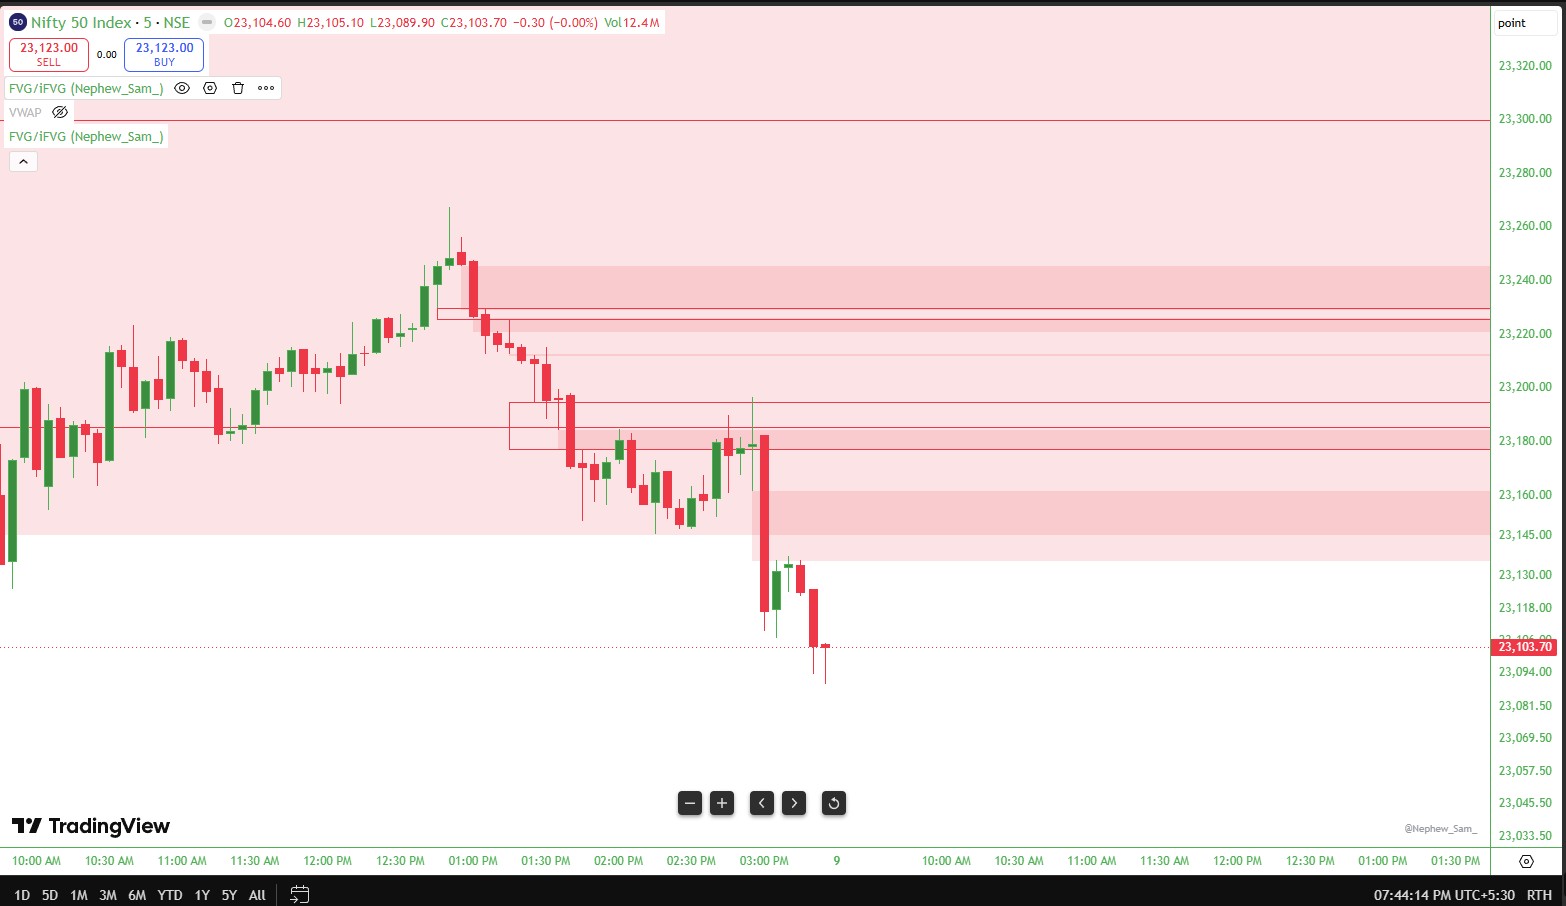
Hilega Milega
//@version=5
indicator(title=“Hilega Milega”, shorttitle=“HM”, overlay=false, format=format.price, precision=2)
// ==========================================
// — INPUTS —
// ==========================================
len = input.int(9, minval=1, title=“RSI Length”)
src = input.source(close, “Source”)
wma_len = input.int(21, minval=1, title=“WMA Length”)
ema_len = input.int(3, minval=1, title=“EMA Length”)
show_80 = input.bool(true, “Show Levels?”, group=“Levels”)
level_80 = input.int(80, “Upper Level”, group=“Levels”)
level_20 = input.int(20, “Lower Level”, group=“Levels”)
level_50 = 50
// ==========================================
// — CALCULATIONS —
// ==========================================
_rsi = ta.rsi(src, len)
wma_val = ta.wma(_rsi, wma_len)
ema_val = ta.ema(_rsi, ema_len)
// ==========================================
// — PLOTTING (OSCILLATOR) —
// ==========================================
h_50 = plot(level_50, color=color.new(color.gray, 50), title=“Mid Line 50”)
hline(show_80 ? level_80 : na, color=color.new(color.red, 30), linestyle=hline.style_dashed)
hline(show_80 ? level_20 : na, color=color.new(color.green, 30), linestyle=hline.style_dashed)
p_rsi = plot(_rsi, color=color.black, linewidth=2, title=“RSI”)
p_wma = plot(wma_val, color=color.red, linewidth=2, title=“Strength-WMA”)
p_ema = plot(ema_val, color=color.green, linewidth=2, title=“Price-EMA”)
// Fill color changes to green if the EMA is above 50, and blue if below 50
fill(p_ema, p_wma, color = ema_val >= 50 ? color.new(color.green, 85) : color.new(color.blue, 85), title=“Trend Fill”)
Dear @RahulDeshpande ,
long standing request for OI profile indicator on TV.DHAN.CO charts.
OI Profile needed! - #4 by Rsrs
Hope DHAN team will address it this time.
My request is for a simple Line Indicator that changes into RED and GREEN based on price action. Now the color is constant.
A Google search showed that such an indicator is available, it’s just that I don’t know how to add it to the indicators list.