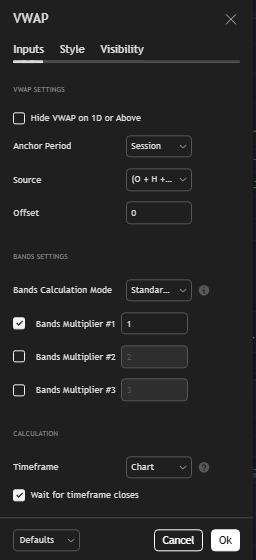
@Dhan Team,
What is the update on this thread?
Please enable pine scripts editor for our own custom indicator. I ll leave tradingview and use only dhan tv. Please think about it.
1 Like
Hello I am requesting for Fractal Box indicator , Which will help to Identify the Fractal brake easily , can you please do it attached chart of Granules with Fractal box Indicator
Thanks

Hi @Hardik
Please kindly add the Stochastic Momentum Index (SMI) indicator - it is one of the default indicator provided by Trading view. The tradingview indicator can be checked from official link here. Thank you.
2 Likes
Can you please consider adding indicator which shows OI profiling on index chart I have attached the example

Hello @Shailesh_Parmar @pmithun
Thank you for sharing your requests, we will definitely looking into building this, if feasible.
2 Likes
Oi profile
Only prev “one” day, week and month’s high low
Delivery volume or qty ( not delivery volume percentage)
Atleast 5 more watchlist.
We are live with OI Profile. Please check it out here 
https://private-poc.madefortrade.in/t/now-live-oi-profile-on-tradingview-charts-by-dhan/39392
2 Likes

Hi Hardik & Team @Dhan
Would like to have Dhan to update its indicator arsenal with Momentum (TTM) Squeeze Pro Indicator,
Dhan Already has Momentum Squeeze Indicator, which is a earlier version of the above requested indicator, but its quite buggy and has been requested for scrutiny (https://private-poc.madefortrade.in/t/dhan-web-sqeeze-momentum-indicator-incorrect/39067) .
So, since its the official thread to place new indicator request, registering here.
Appreciation to your efforts.
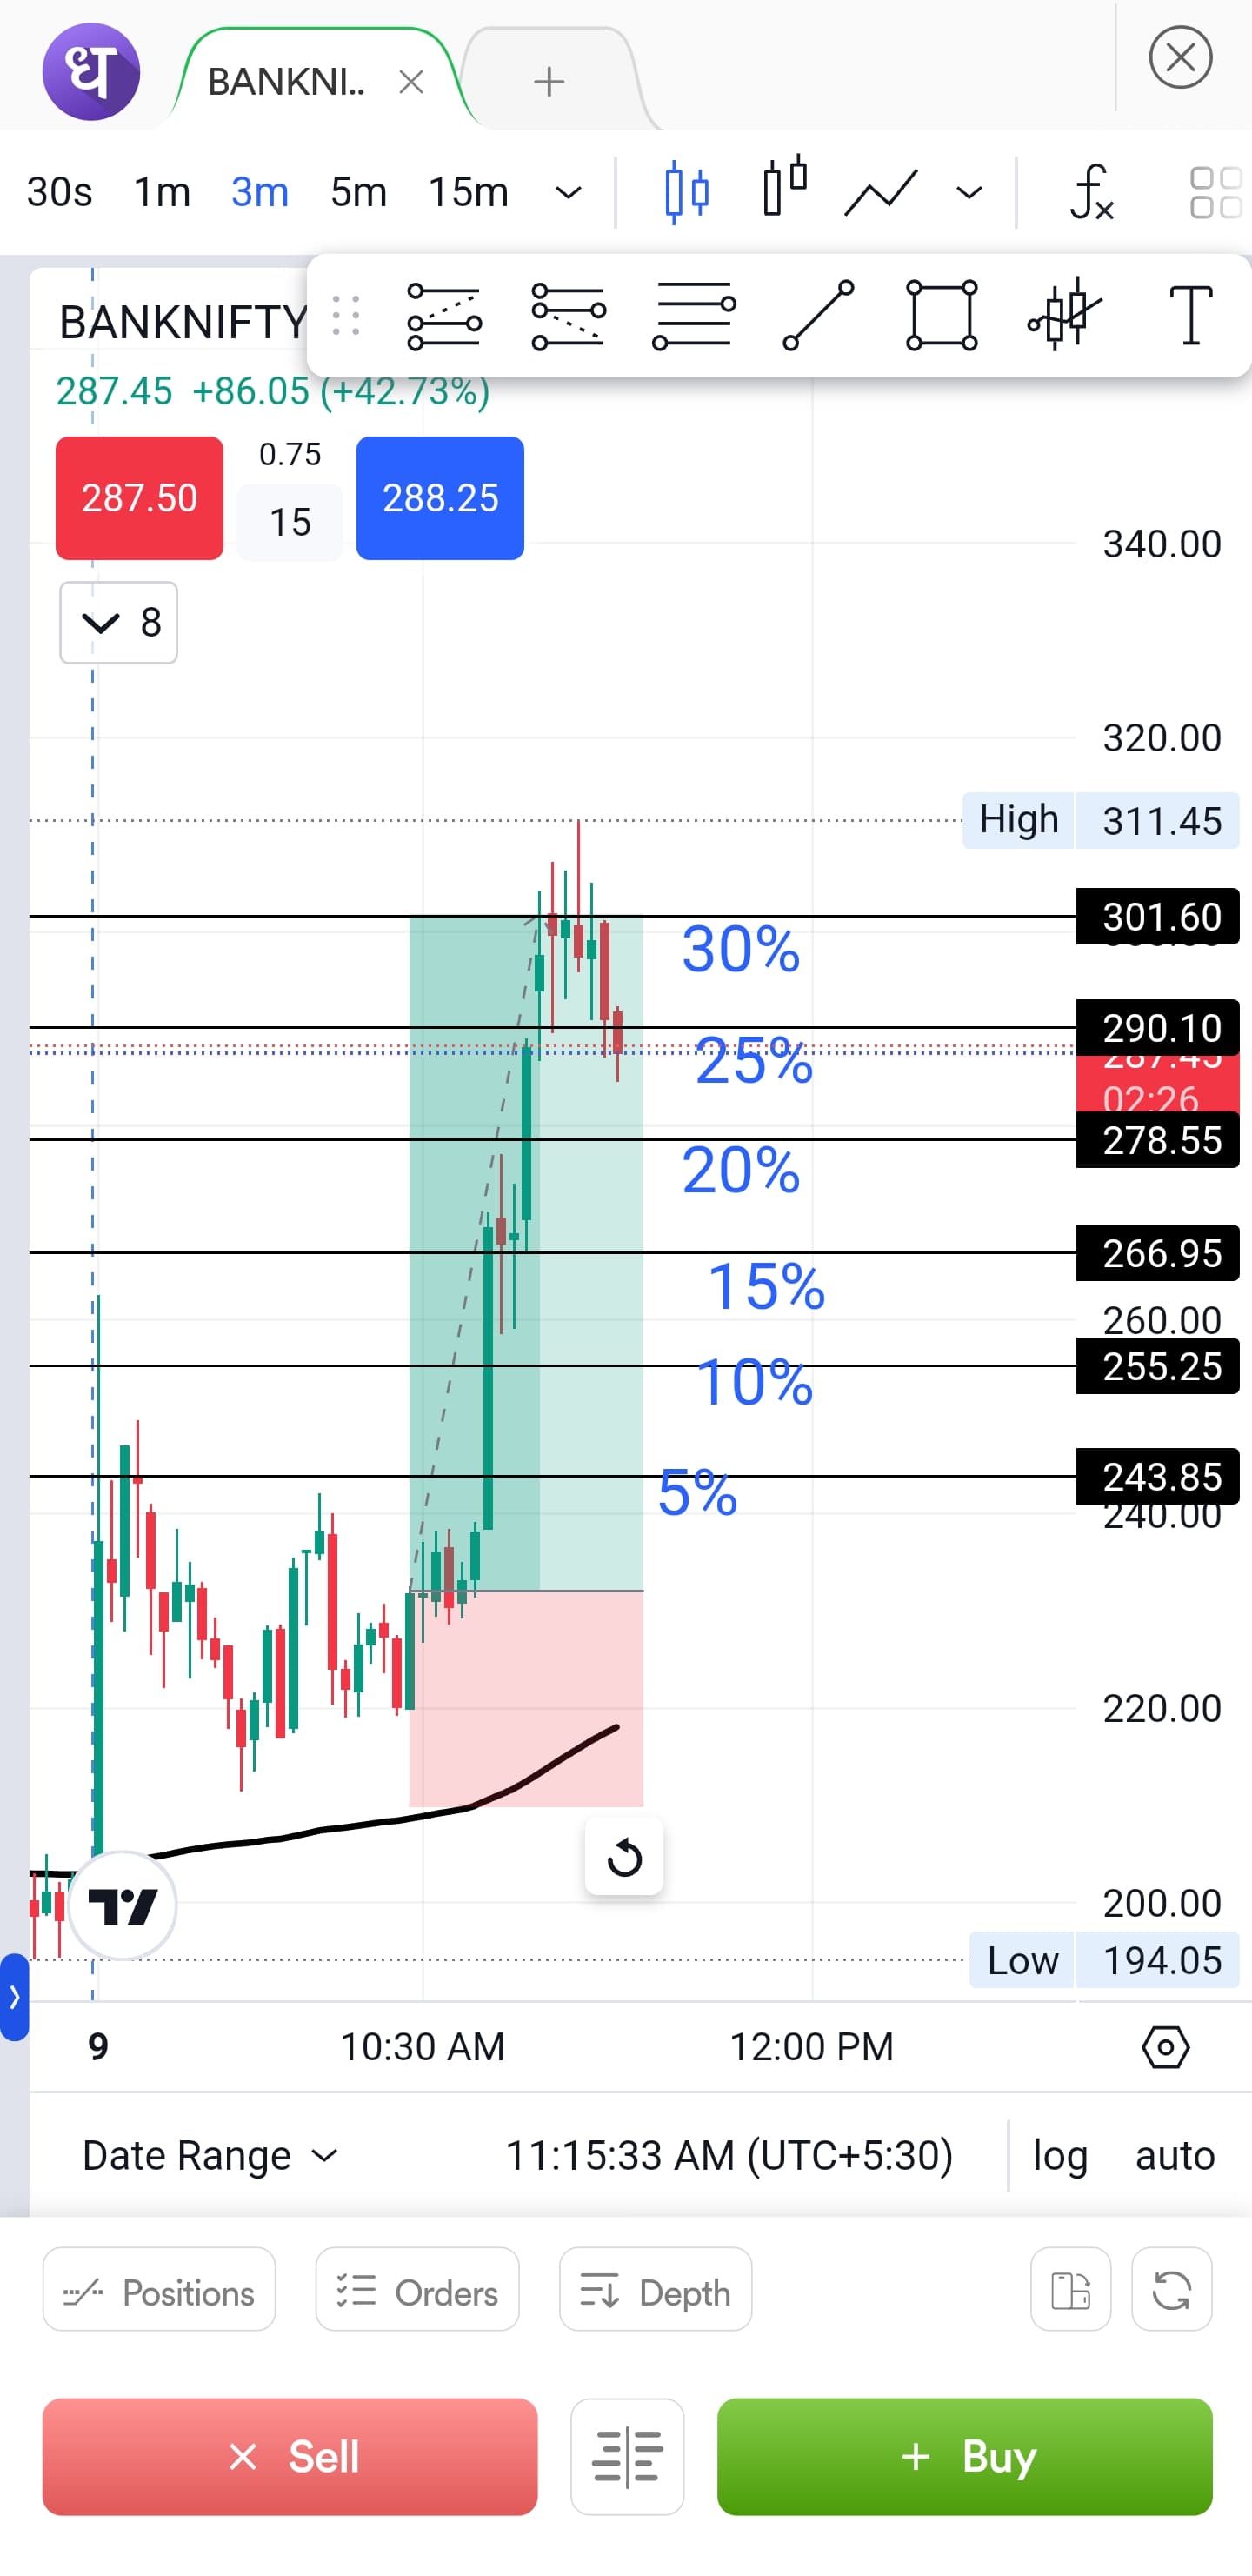
Is it possible to make a tool which will display custom percentage milestones over the buy price? It will help us in trailing sl on the chart based on %. Please look into this, it will be really helpful.
2 Likes
Please add FAIR VALUE GAP Indicator.
1 Like
CMO (Chande Momentum Oscillator) indicator currently does not have the option to add custom horizontal line ranges like we can in the RSI indicator.
For better visual analysis, I’d like to request the ability to add two horizontal lines — for example, at +25 and -25 — within the CMO indicator settings. This would help identify overbought and oversold zones more effectively, just like we do with RSI levels at 70/30 or 80/20.
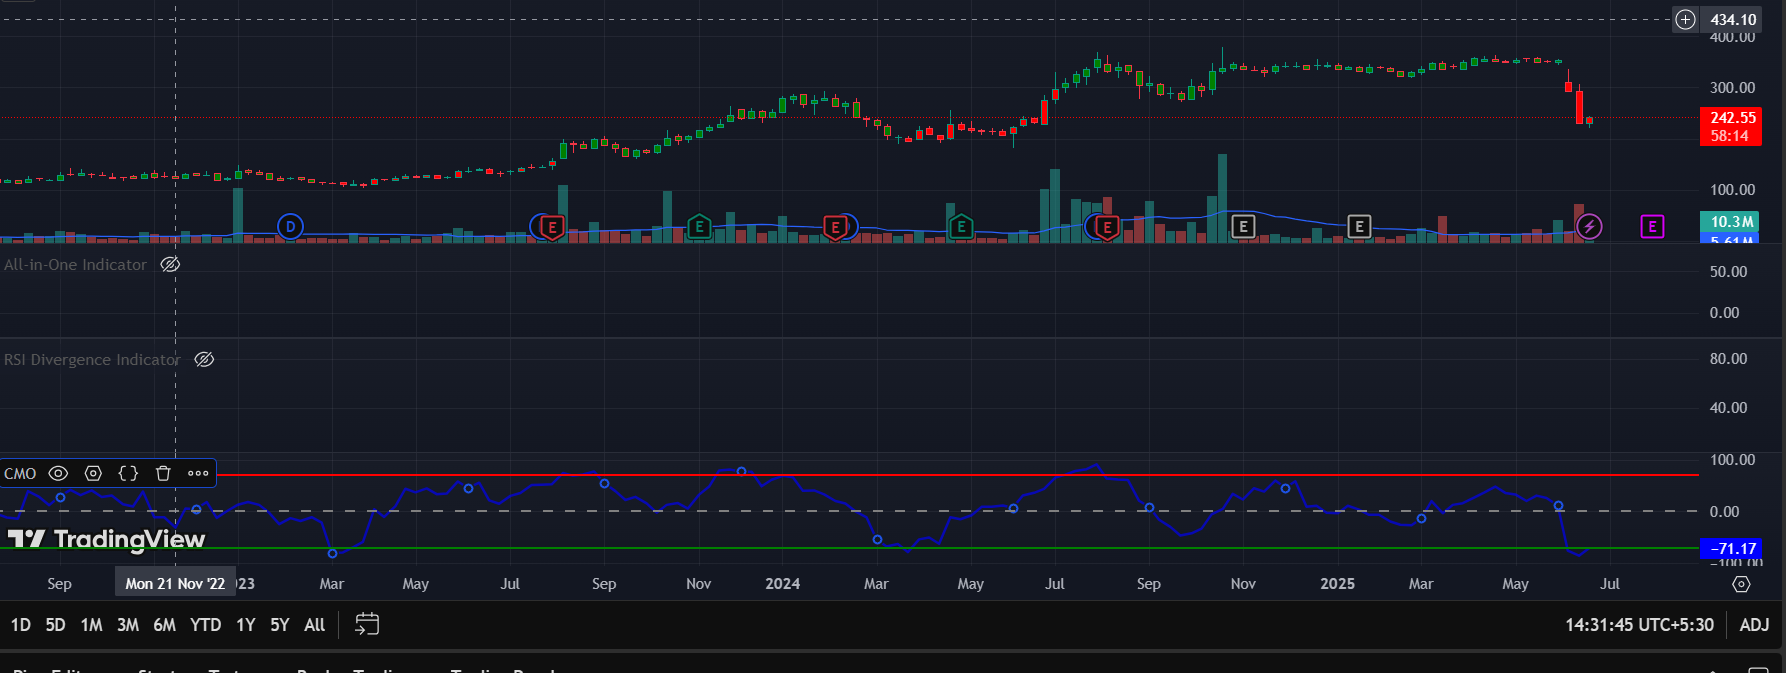
Dhan has no option for adding range in cmo indicator
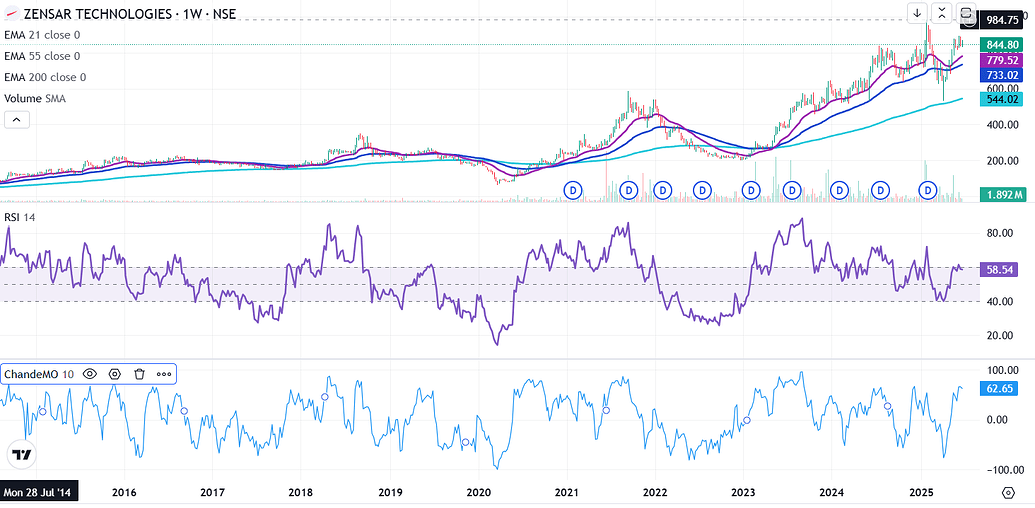
code for fix this isuue –
////////////////////////////////////////////////////////////
study(title="CMO (Chande Momentum Oscillator)", shorttitle="CMO")
Length = input(9, minval=1)
TopBand = input(70, minval=1)
LowBand = input(-70, maxval=-1)
hline(0, color=gray, linestyle=dashed)
hline(TopBand, color=red, linestyle=line)
hline(LowBand, color=green, linestyle=line)
xMom = abs(close - close[1])
xSMA_mom = sma(xMom, Length)
xMomLength = close - close[Length]
nRes = 100 * (xMomLength / (xSMA_mom * Length))
pos = iff(nRes > TopBand, 1,
   iff(nRes <= LowBand, -1, nz(pos[1], 0)))
barcolor(pos == -1 ? red: pos == 1 ? green : blue )
plot(nRes, color=blue, title="CMO")
Indicator link CMO (Chande Momentum Oscillator) Strategy — Indicator by HPotter — TradingView
@Naman @Hardik @Mohseen_Usmani I have requested this feature 1 year ago 2024 feb … still not added …
Can you please add Volume and VWAP in index charts. Recently Angelone has added VWAP and volume into index charts.
1 Like
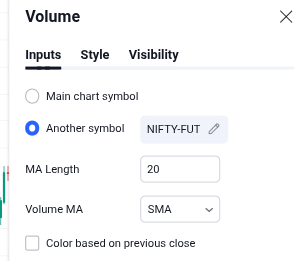
Hi @Sreejith_s123, we have noted this feedback for VWAP, however, you can see index futures volume on spot charts via volume indicator settings.
1 Like
hi team,
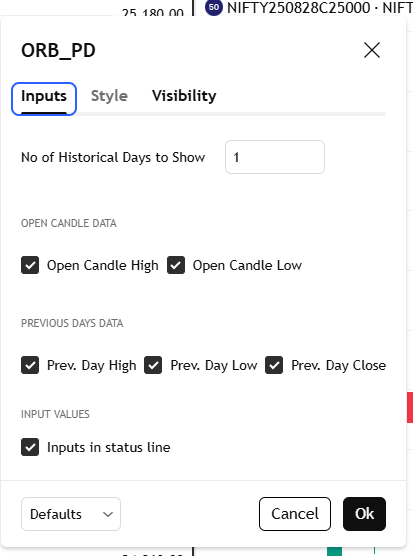
plz add days 1st open candle high & low indicator, this is the most important one for intraday traders,
i given pine script for the same below, on this - i have also added previous day high & low & close data on the same code
//@version=5
indicator(title=‘ORB & Previous Day’, shorttitle=‘ORB_PD’, overlay=true)
//----------------------------Inputs----------------------------
noofdays= input.int(title=‘No of Historical Days to Show’, defval=1, minval=0)
show1st5mHigh = input(true, title = ‘Open Candle High’, group = ‘Open Candle Data’, inline = ‘ORB’)
show1st5mLow = input(true, title = ‘Open Candle Low’, group = ‘Open Candle Data’, inline = ‘ORB’)
showPrevDayHigh = input(true, title =‘Prev. Day High’, group = ‘Previous Days Data’, inline = ‘Previous Day’)
showPrevDayLow = input(true, title =‘Prev. Day Low’, group = ‘Previous Days Data’, inline = ‘Previous Day’)
showPrevDayClose = input(true, title=‘Prev. Day Close’, group = ‘Previous Days Data’, inline = ‘Previous Day’)
//----------------------------LoopBack Condition----------------------------
one_day = 1000 * 60 * 60 * 24
new_bar(res) =>
ta.change(time(res)) != 0
new_period(condition, src) =>
result = 0.0
result := condition ? src : result[1]
result
new_day = noofdays > 0 and timenow - time < one_day * noofdays and new_bar(‘D’)
//----------------------------Previous Day High----------------------------
one = high
done = request.security(syminfo.tickerid, ‘D’, one[1], lookahead=barmerge.lookahead_on)
done_ = new_period(new_day, done)
oneline = plot(showPrevDayHigh ? done_ : na, title = ‘PDH’, style=plot.style_linebr, color=done_ != done_[1] ? na : color.new(color.green, 0), linewidth=1)
if showPrevDayHigh
label_PDH = label.new(x=bar_index, y=done_, text="PDH - " + str.tostring(done_, format.mintick), style=label.style_label_left, color=color.new(color.white, 80), textcolor=color.green)
label.delete(label_PDH[1])
//----------------------------Previous Day Low----------------------------
zero = low
dzero = request.security(syminfo.tickerid, ‘D’, zero[1], lookahead=barmerge.lookahead_on)
dzero_ = new_period(new_day, dzero)
zeroline = plot(showPrevDayLow ? dzero_ : na, title = ‘PDL’, style=plot.style_linebr, color=dzero_ != dzero_[1] ? na : color.new(color.red, 0), linewidth=1)
if showPrevDayLow
label_PDL = label.new(x=bar_index, y=dzero_, text="PDL - " + str.tostring(dzero_, format.mintick), style=label.style_label_left, color=color.new(color.white, 80), textcolor=color.red)
label.delete(label_PDL[1])
fill(oneline , zeroline , color = color.new(color.green, 95), title=“Prev. Day Range Fill”)
// ----------------------------Previous Day Close----------------------------
PC = close
dPC = request.security(syminfo.tickerid, ‘D’, PC[1], lookahead=barmerge.lookahead_on)
dPC_ = new_period(new_day, dPC)
pdcline = plot(showPrevDayClose ? dPC_ : na, title=‘PDC’, style=plot.style_linebr, color=dPC_ != dPC_[1] ? na : color.new(color.orange, 0), linewidth=1)
if showPrevDayClose
label_PDC = label.new(x=bar_index, y=dPC_, text="PDC - " + str.tostring(dPC_, format.mintick), style=label.style_label_left, color=color.new(color.white, 80), textcolor=color.orange)
label.delete(label_PDC[1])
//Open Candle Datas - this will show 1st candle’s high & low of the selected time frame
//----------------------------Open Candle High----------------------------
high1 = new_period(new_day, high)
plot(show1st5mHigh ? high1 : na, style = plot.style_linebr, color = high1 != high1[1] ? na : color.black, title = ‘Open Candle High’)
if show1st5mHigh
High5m = label.new(x=bar_index, y=high1, text="ORB_H - " + str.tostring(high1, format.mintick), style=label.style_label_left, color=color.new(color.white, 80), textcolor=color.black)
label.delete(High5m[1])
//----------------------------Open Candle Low----------------------------
low1 = new_period(new_day, low)
plot(show1st5mLow ? low1 : na, style = plot.style_linebr, color = low1 != low1[1] ? na : color.black, title = ‘Open Candle Low’)
if show1st5mLow
Low5m = label.new(x=bar_index, y=low1, text="ORB_L - " + str.tostring(low1, format.mintick), style=label.style_label_left, color=color.new(color.white, 80), textcolor=color.black)
label.delete(Low5m[1])
use Ctrl+I
I’m not sure if changes can be made based solely on my feedback, but I struggle with two things daily:
-
I need access to the Rob Booker Knoxville Indicator. Now I am dependent on other source for it.
-
When trading across multiple strategies, it’s difficult to track trades. It would be really helpful to have a tagging feature in the Position and Portfolio sections to identify which strategy each trade belongs to. Right now, I have to trade in multiple platforms due to this limitation.
Hi @Tejpal_Singh, welcome to MadeForTrade!
Thanks for your suggestion about adding the Rob Booker Knoxville Indicator on Dhan platform. For position management. We’ll definitely evaluate how we can make it simpler and more organized, especially when trading multiple strategies.