Hi @Tradehull_Imran ,
I’ve been trying to get the historical last one year data points at 5 min and 15 min time frame and despite multiple attempts only getting for last few days. is this the limitation at API side or I’m missing something in code. due to lack of historical data all other calculations are going for toss . please advise.
import pdb
import time
import datetime
import traceback
from Dhan_Tradehull_V2 import Tradehull
import pandas as pd
from pprint import pprint
import talib
import plotly.graph_objects as go
from datetime import datetime, timedelta
import numpy as np
from plotly.subplots import make_subplots
import pytz
def plot_candlestick_chart(df, title, timeframe="5min"):
"""
Create an interactive candlestick chart with volume and remove gaps
"""
fig = go.Figure()
# Add candlestick
fig.add_trace(go.Candlestick(
x=df.index,
open=df['open'],
high=df['high'],
low=df['low'],
close=df['close'],
name='Price'
))
# Add volume bars
fig.add_trace(go.Bar(
x=df.index,
y=df['volume'],
name='Volume',
yaxis='y2',
opacity=0.3
))
# Update layout with rangebreaks to remove non-trading hours and weekends
fig.update_layout(
title=title,
yaxis_title='Price',
yaxis2=dict(
title='Volume',
overlaying='y',
side='right'
),
xaxis_title='Date',
template='plotly_dark'
)
# Add range breaks to remove non-trading periods
fig.update_xaxes(
rangebreaks=[
dict(bounds=["sat", "mon"]), # Remove weekends
dict(bounds=[16, 9], pattern="hour"), # Remove non-trading hours
],
rangeslider_visible=True,
)
fig.show()
def fetch_historical_data(tsl, symbol, exchange='INDEX', timeframe="15", lookback_days=365):
"""
Fetch historical data with proper timezone handling and chunked requests
"""
try:
print(f"Fetching {timeframe}-minute data for {symbol}...")
# Calculate date ranges for chunked requests
end_date = datetime.now()
start_date = end_date - timedelta(days=lookback_days)
# Initialize empty DataFrame for storing all data
all_data = pd.DataFrame()
# Fetch data in 30-day chunks to handle API limitations
current_start = start_date
while current_start < end_date:
current_end = min(current_start + timedelta(days=30), end_date)
print(f"Fetching chunk from {current_start.date()} to {current_end.date()}")
# Get historical data for current chunk
chunk_data = tsl.get_historical_data(
tradingsymbol=symbol,
exchange=exchange,
timeframe=timeframe
)
if chunk_data is not None and not chunk_data.empty:
# Convert to dataframe
df_chunk = chunk_data.copy()
# Handle timestamp conversion
df_chunk['timestamp'] = pd.to_datetime(df_chunk['timestamp'])
# Filter for the current chunk's date range
df_chunk = df_chunk[
(df_chunk['timestamp'].dt.date >= current_start.date()) &
(df_chunk['timestamp'].dt.date <= current_end.date())
]
# Append to main DataFrame
all_data = pd.concat([all_data, df_chunk], axis=0)
# Move to next chunk
current_start = current_end
time.sleep(1) # Add delay between requests to avoid rate limiting
if not all_data.empty:
# Process the combined data
all_data = all_data.drop_duplicates()
all_data = all_data.sort_values('timestamp')
# Set timestamp as index
all_data = all_data.set_index('timestamp')
# Convert timezone if needed
if all_data.index.tz is None:
ist = pytz.timezone('Asia/Kolkata')
all_data.index = all_data.index.tz_localize('UTC').tz_convert(ist)
elif all_data.index.tz.zone != 'Asia/Kolkata':
all_data.index = all_data.index.tz_convert('Asia/Kolkata')
# Filter for trading hours (9:15 AM to 3:30 PM IST)
all_data = all_data.between_time('09:15', '15:30')
# Remove weekends
all_data = all_data[all_data.index.dayofweek < 5]
print(f"\nData Statistics:")
print(f"Total Days: {len(all_data.index.date.unique())}")
print(f"Total Candles: {len(all_data)}")
print(f"Date Range: {all_data.index.min().date()} to {all_data.index.max().date()}")
return all_data
else:
print("No data received")
return None
except Exception as e:
print(f"Error fetching data: {str(e)}")
traceback.print_exc() # Print full traceback for debugging
return None
def calculate_cvd(df):
"""
Calculate Cumulative Volume Delta
"""
# Calculate buy/sell volume based on close position relative to high/low
df['buy_volume'] = df['volume'] * (df['close'] - df['low']) / (df['high'] - df['low'])
df['sell_volume'] = df['volume'] - df['buy_volume']
# Calculate CVD
df['cvd'] = (df['buy_volume'] - df['sell_volume']).cumsum()
return df
def plot_data(df, symbol):
"""
Create a plot similar to TradingView with candlesticks, EMAs, and CVD
"""
# Calculate EMAs using pandas
df['ema9'] = df['close'].ewm(span=9, adjust=False).mean()
df['ema12'] = df['close'].ewm(span=12, adjust=False).mean()
# Create the figure with secondary y-axis
fig = make_subplots(rows=2, cols=1,
shared_xaxes=True,
vertical_spacing=0.03,
row_heights=[0.7, 0.3])
# Add candlestick
fig.add_trace(go.Candlestick(
x=df.index,
open=df['open'],
high=df['high'],
low=df['low'],
close=df['close'],
name='Price'
), row=1, col=1)
# Add EMAs
fig.add_trace(go.Scatter(
x=df.index,
y=df['ema9'],
name='EMA 9',
line=dict(color='blue', width=1)
), row=1, col=1)
fig.add_trace(go.Scatter(
x=df.index,
y=df['ema12'],
name='EMA 12',
line=dict(color='red', width=1)
), row=1, col=1)
# Add CVD
fig.add_trace(go.Scatter(
x=df.index,
y=df['cvd'],
name='CVD',
line=dict(color='purple', width=1.5)
), row=2, col=1)
# Add volume bars to CVD subplot
colors = ['red' if close < open else 'green'
for open, close in zip(df['open'], df['close'])]
fig.add_trace(go.Bar(
x=df.index,
y=df['volume'],
name='Volume',
marker_color=colors,
opacity=0.3
), row=2, col=1)
# Update layout
fig.update_layout(
title=f'{symbol} Price with CVD',
yaxis_title='Price',
yaxis2_title='CVD',
xaxis_title='Date',
template='plotly_dark',
xaxis_rangeslider_visible=False,
height=800 # Make the chart taller
)
# Remove non-trading periods
fig.update_xaxes(
rangebreaks=[
dict(bounds=["sat", "mon"]), # Remove weekends
dict(bounds=[15.5, 9.25], pattern="hour"), # Remove non-trading hours
]
)
fig.show()
def main():
# Initialize client
client_code = ""
token_id = ""
tsl = Tradehull(client_code, token_id)
# Fetch data for NIFTY
symbol = 'NIFTY'
df = fetch_historical_data(tsl, symbol)
if df is not None:
# Calculate CVD
df = calculate_cvd(df)
# Plot the data
plot_data(df, symbol)
# Print some statistics
print("\nData Statistics:")
print(f"Total Days: {len(df.index.date.unique())}")
print(f"Total Candles: {len(df)}")
print(f"Date Range: {df.index.min().date()} to {df.index.max().date()}")
if __name__ == "__main__":
main()
# Initialize Dhan client
client_code = "1"
token_id = "ey"
tsl = Tradehull(client_code, token_id)
# List of instruments to track
instruments = [
'NIFTY',
'BANKNIFTY',
'FINNIFTY',
'RELIANCE',
'TCS',
'HDFC',
'INFY',
'ICICIBANK'
]
# Get LTP for all instruments
print("\nFetching Last Traded Prices...")
print("-" * 50)
all_ltp_data = tsl.get_ltp_data(names=instruments)
for instrument in instruments:
if instrument in all_ltp_data:
print(f"{instrument:<15}: ₹{all_ltp_data[instrument]:,.2f}")
# Get and plot intraday data for indices
indices = ['NIFTY', 'BANKNIFTY', 'FINNIFTY']
print("\nFetching and plotting 5-minute intraday data...")
for index in indices:
print(f"\nGetting data for {index}...")
# Get 5-minute intraday data
hist_data = tsl.get_historical_data(
tradingsymbol=index,
exchange='INDEX',
timeframe="5" # Changed to 5-minute timeframe
)
if hist_data is not None and not hist_data.empty:
# Process the data
hist_data = hist_data.set_index(pd.to_datetime(hist_data['timestamp']))
hist_data = hist_data.sort_index()
# Calculate some basic statistics
current_price = hist_data['close'].iloc[-1]
high_price = hist_data['high'].max()
low_price = hist_data['low'].min()
total_return = ((hist_data['close'].iloc[-1] - hist_data['close'].iloc[0]) / hist_data['close'].iloc[0]) * 100
print(f"\n{index} Statistics:")
print(f"Current Price: ₹{current_price:,.2f}")
print(f"Period High: ₹{high_price:,.2f}")
print(f"Period Low: ₹{low_price:,.2f}")
print(f"Period Return: {total_return:.2f}%")
# Plot the candlestick chart
plot_candlestick_chart(hist_data, f"{index} 5-Minute Intraday Chart")
else:
print(f"No data available for {index}")
# Get NIFTY Options Data
print("\nFetching NIFTY Options Data...")
print("-" * 50)
# Get ATM Strikes
print("\nATM Strike Selection:")
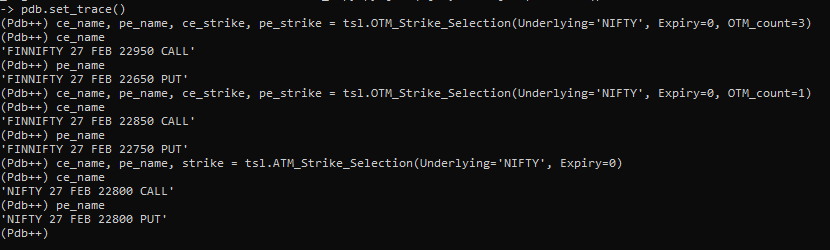
ce_name, pe_name, strike = tsl.ATM_Strike_Selection(Underlying='NIFTY', Expiry=0)
print(f"Call Option: {ce_name}")
print(f"Put Option: {pe_name}")
print(f"Strike Price: {strike}")
# Get OTM Strikes
print("\nOTM Strike Selection (3 strikes):")
ce_name, pe_name, ce_strike, pe_strike = tsl.OTM_Strike_Selection(Underlying='NIFTY', Expiry=0, OTM_count=3)
print(f"Call Options: {ce_name}")
print(f"Put Options: {pe_name}")
print(f"Call Strikes: {ce_strike}")
print(f"Put Strikes: {pe_strike}")
# Get ITM Strikes
print("\nITM Strike Selection (5 strikes):")
ce_name, pe_name, ce_strike, pe_strike = tsl.ITM_Strike_Selection(Underlying='NIFTY', Expiry=0, ITM_count=5)
print(f"Call Options: {ce_name}")
print(f"Put Options: {pe_name}")
print(f"Call Strikes: {ce_strike}")
print(f"Put Strikes: {pe_strike}")
# Get current positions and holdings
print("\nCurrent Positions:")
positions = tsl.get_positions()
pprint(positions)
print("\nCurrent Holdings:")
holdings = tsl.get_holdings()
pprint(holdings)
Error code-
venvINR-HQ-2609:PythonProjects radharaman.jha$ /Users/radharaman.jha/Documents/PythonProjects/venv/bin/python "/Users/radharaman.jha/Documents/PythonProjects/How to use updated codebase.py"
Codebase Version 2.8 : Solved - Strike Selection Issue
-----Logged into Dhan-----
This BOT Is Picking New File From Dhan
Got the instrument file
Fetching 15-minute data for NIFTY...
Fetching chunk from 2024-02-24 to 2024-03-25
Fetching chunk from 2024-03-25 to 2024-04-24
Fetching chunk from 2024-04-24 to 2024-05-24
Fetching chunk from 2024-05-24 to 2024-06-23
Fetching chunk from 2024-06-23 to 2024-07-23
Fetching chunk from 2024-07-23 to 2024-08-22
Fetching chunk from 2024-08-22 to 2024-09-21
Fetching chunk from 2024-09-21 to 2024-10-21
Fetching chunk from 2024-10-21 to 2024-11-20
Fetching chunk from 2024-11-20 to 2024-12-20
Fetching chunk from 2024-12-20 to 2025-01-19
Fetching chunk from 2025-01-19 to 2025-02-18
Fetching chunk from 2025-02-18 to 2025-02-23
Error fetching data: 'datetime.timezone' object has no attribute 'zone'
Traceback (most recent call last):
  File "/Users/radharaman.jha/Documents/PythonProjects/How to use updated codebase.py", line 124, in fetch_historical_data
    elif all_data.index.tz.zone != 'Asia/Kolkata':
         ^^^^^^^^^^^^^^^^^^^^^^
AttributeError: 'datetime.timezone' object has no attribute 'zone'
-----Logged into Dhan-----
This BOT Is Picking New File From Dhan
Got the instrument file

Fetching Last Traded Prices...
--------------------------------------------------
Exception for instrument name HDFC as Check the Tradingsymbol
NIFTY          : ₹22,795.90
BANKNIFTY      : ₹48,981.20
FINNIFTY       : ₹23,174.35
RELIANCE       : ₹1,228.15
TCS            : ₹3,786.00
INFY           : ₹1,815.00
ICICIBANK      : ₹1,232.95

Fetching and plotting 5-minute intraday data...

Getting data for NIFTY...

NIFTY Statistics:
Current Price: ₹22,764.35
Period High: ₹22,923.85
Period Low: ₹22,720.30
Period Return: -0.41%

Getting data for BANKNIFTY...

BANKNIFTY Statistics:
Current Price: ₹48,908.50
Period High: ₹49,455.80
Period Low: ₹48,764.00
Period Return: -0.93%

Getting data for FINNIFTY...

FINNIFTY Statistics:
Current Price: ₹23,135.20
Period High: ₹23,396.05
Period Low: ₹23,030.90
Period Return: -0.95%

Fetching NIFTY Options Data...
--------------------------------------------------

ATM Strike Selection:
Call Option: NIFTY 27 FEB 22800 CALL
Put Option: NIFTY 27 FEB 22800 PUT
Strike Price: 22800

OTM Strike Selection (3 strikes):
Call Options: FINNIFTY 27 FEB 22950 CALL
Put Options: FINNIFTY 27 FEB 22650 PUT
Call Strikes: 22950
Put Strikes: 22650

ITM Strike Selection (5 strikes):
Call Options: FINNIFTY 27 FEB 22550 CALL
Put Options: FINNIFTY 27 FEB 23050 PUT
Call Strikes: 22550
Put Strikes: 23050

Current Positions:
Empty DataFrame
Columns: []
Index: []

Current Holdings:
  exchange tradingSymbol securityId          isin  totalQty  dpQty  t1Qty  availableQty  collateralQty  avgCostPrice  lastTradedPrice
0      ALL     TATASTEEL       3499  INE081A01020         3      3      0             3              3        112.10           140.76
1      NSE     AXISNIFTY      21252  INF846K01W98         3      3      0             3              3        199.89           247.98type or paste code here