Hi @Everyone ,
Almost every trader knows this frustration. You enter a trade with a clear plan, and then nothing happens. The stock drifts a little higher, slips a little lower, and simply sits in the middle. It is heading neither towards your stop-loss nor towards your target, and your time and capital are stuck while it goes nowhere.
Direction is easy to judge: one look at the chart shows whether the market is moving up or down. The harder part is timing, which means entering when the stock is genuinely ready to move. This guide shows you how to find that moment using Relative Volume (RVOL), an indicator that reveals where institutions are active right now, and how to run a free RVOL Scanner that ranks Nifty 50 stocks by RVOL using the Dhan API.
Why Institutional Activity Matters
Timing is the single most important factor in getting a trade to work. The best time to enter is when institutions become active in a stock. When large money comes in, it is the buying or selling of those participants that moves the price decisively in one direction. Retail-sized volume, on the other hand, tends to leave a stock drifting in a narrow range.
“The right time to trade a stock is when big money arrives, because those participants are the ones who move the market in either direction.”
So the practical question becomes: how do we detect that institutions have arrived? The obvious answer is volume, but comparing raw volume figures does not work, as the next section shows.
Why Raw Volume Cannot Find Institutions
Suppose you decide that institutions are present whenever a stock trades at least 50 lakh shares. That rule breaks down immediately, because every stock has a different normal level of activity.
- A heavily traded stock such as Reliance may routinely trade 50 to 60 lakh shares in a day. A volume of 50 lakh is simply an average day and says nothing unusual.
- A lightly traded stock such as Dixon may normally trade only 5 to 6 lakh shares. A volume of 50 lakh is roughly ten times its usual level, which is a clear sign of institutional activity.
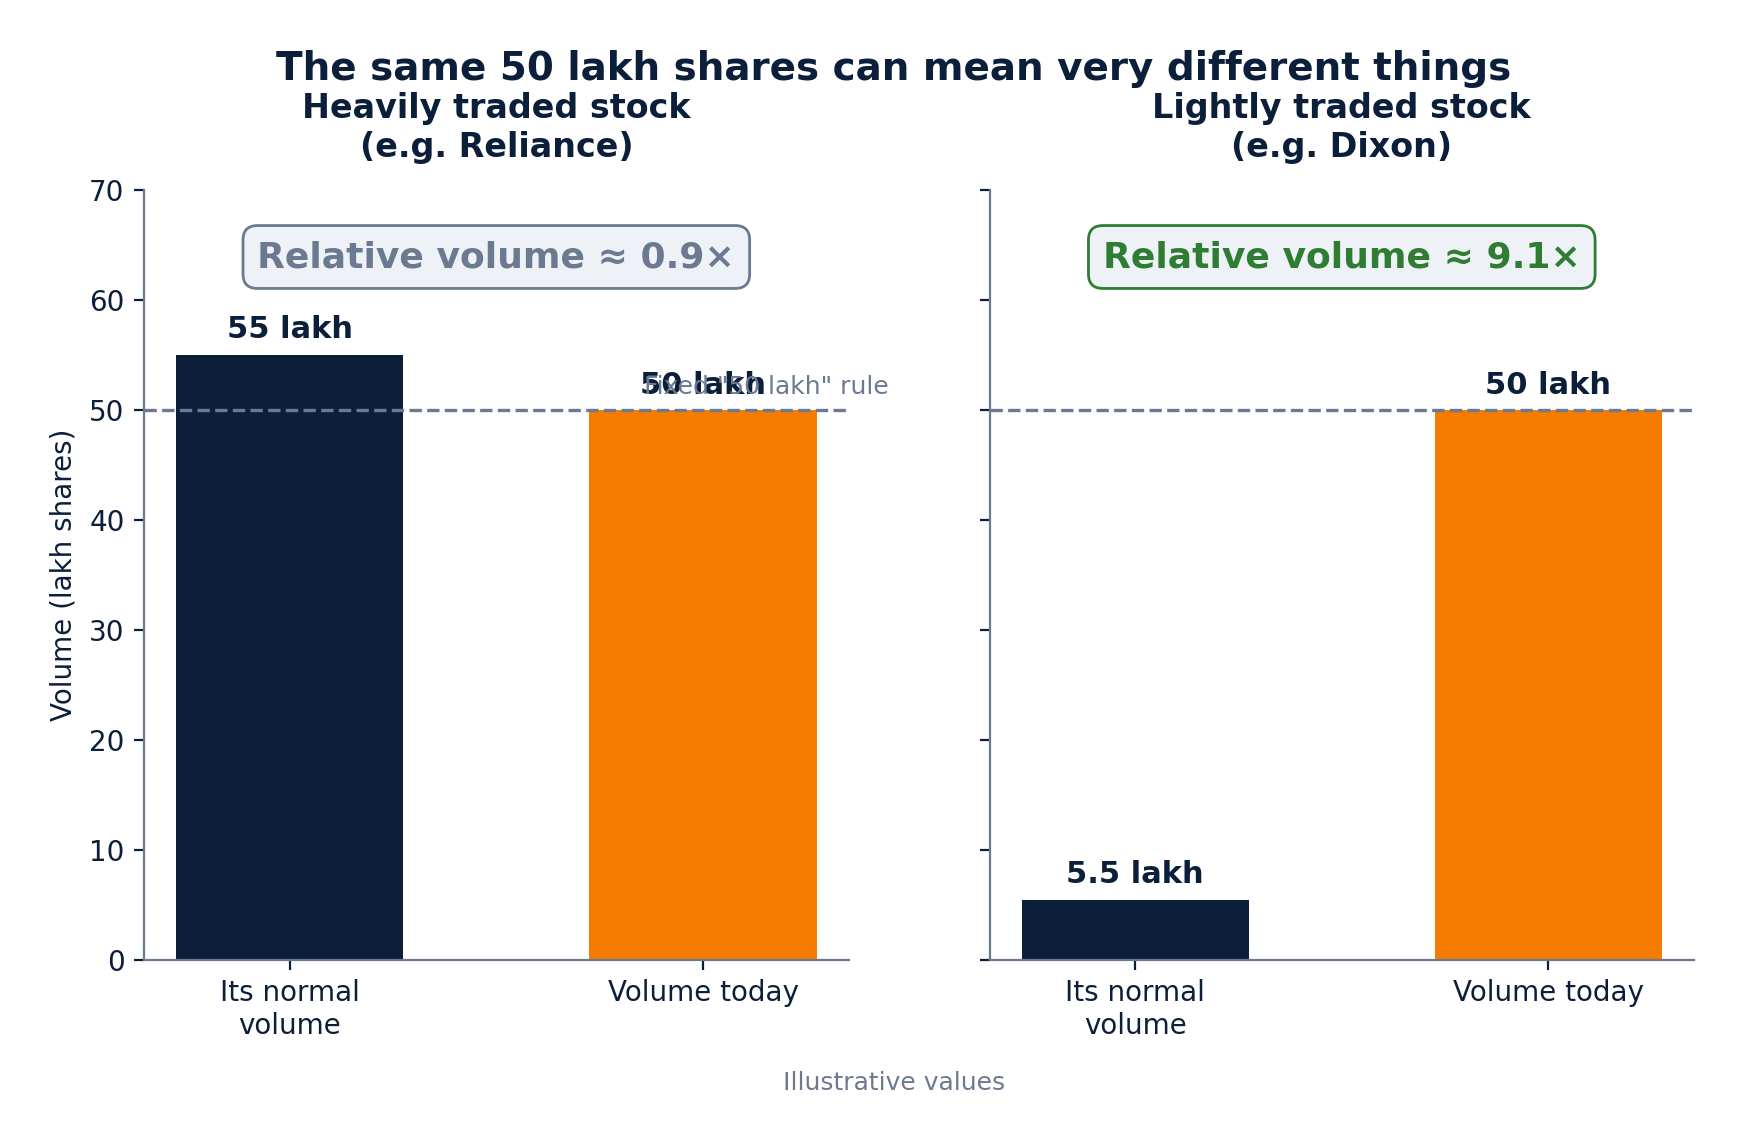
Figure 1: The same 50 lakh shares means different things for different stocks. Only the comparison with each stock’s own normal volume reveals the truth.
Key principle
RVOL never compares one stock with another. Each stock is compared only with itself. That is what makes the indicator fair across large and small names.
Volume Has a Shape: The Time-of-Day Effect
There is a second problem. Volume is not spread evenly through the trading day. It follows a predictable pattern:
- 9:15 AM: volume is at its highest at the open and stays high until roughly 10 to 11 AM.
- Midday (around 12 to 12:30 PM and beyond): activity fades and the market tends to move sideways.
- From about 2:00 PM: volume builds again as the session heads towards the close, up to 3:00 PM and beyond.
Plotted across the day, volume forms a “U” shape. This matters because a volume figure only means something in the context of the clock.
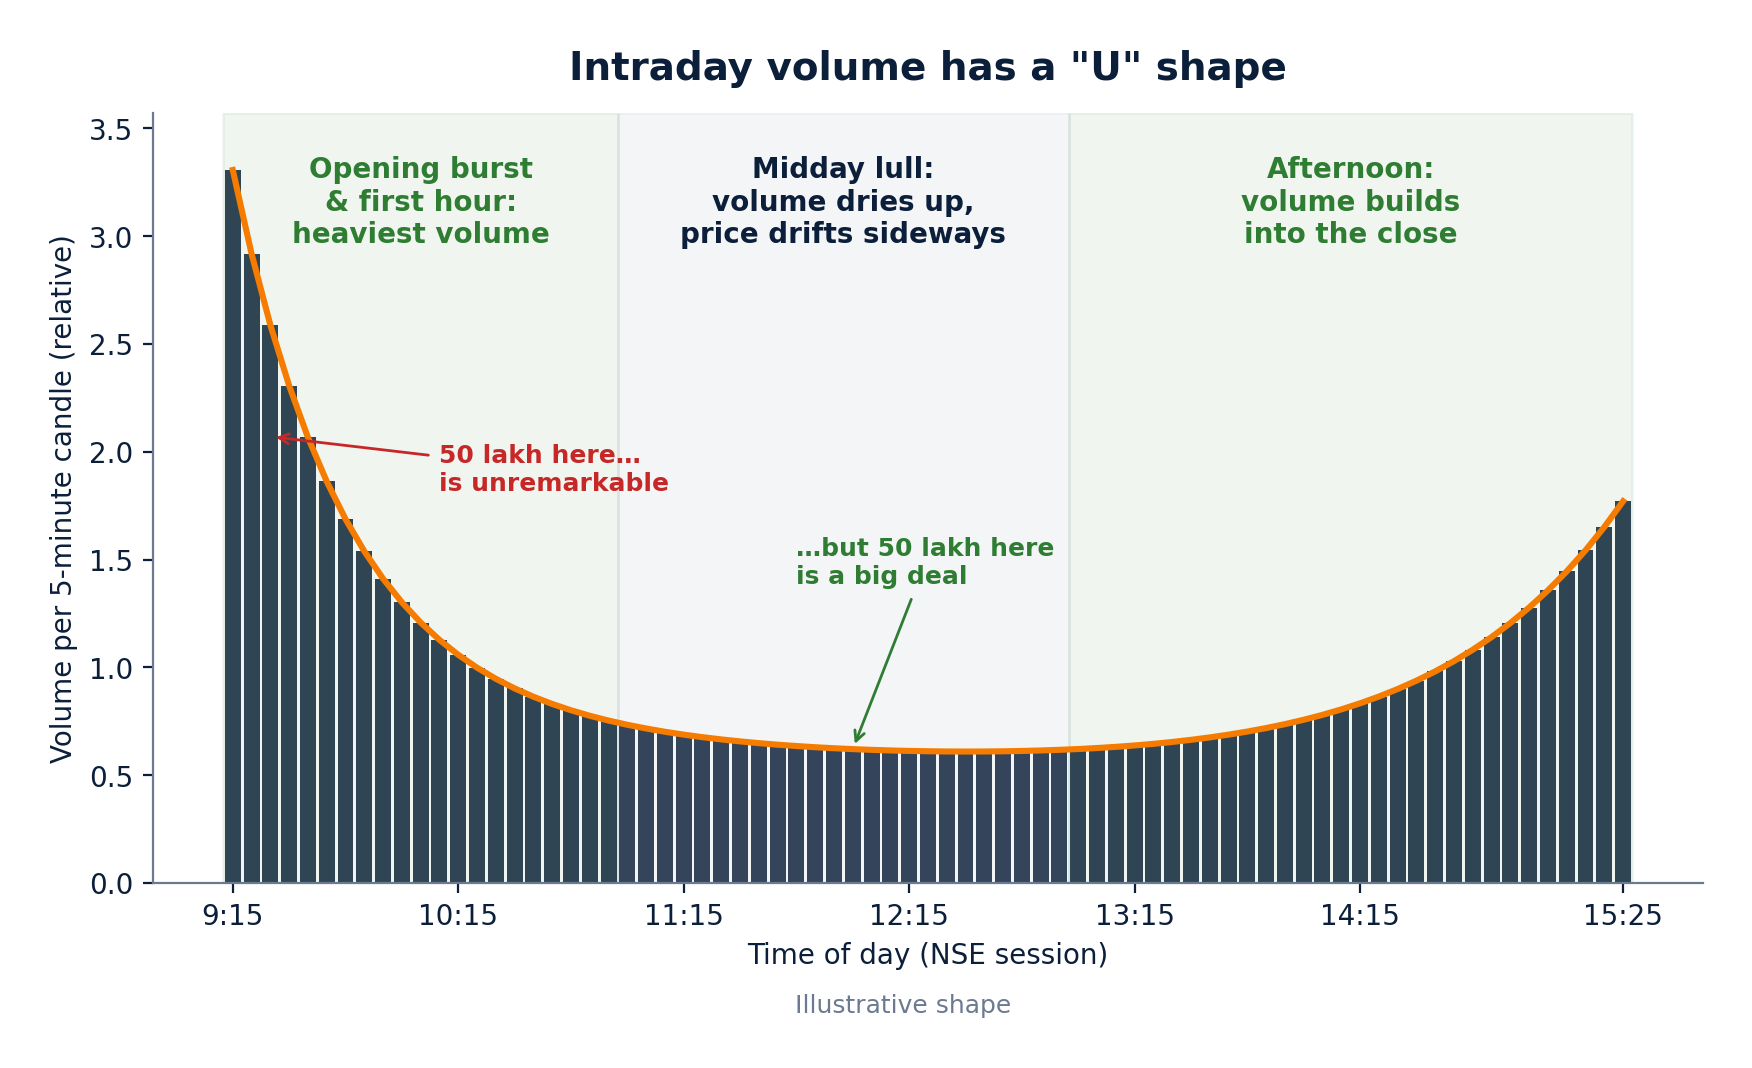
Figure 2: Intraday volume is high at the open, thin at midday and rising again into the close.
| Time of day | What 50 lakh shares means |
|---|---|
| Early morning (open) | Possibly nothing special, because heavy volume is expected here anyway |
| Mid-session | A big event, because volume is normally light at this time |
| Last part of the day | Not unusual, because volume normally builds into the close |
RVOL is built with this shape in mind. It never says “a big volume has arrived” just because a fixed number was crossed. It asks a better question: given the time of day, is today’s volume higher than what this stock normally trades by now?
How RVOL Works
Any indicator is easier to trust once you have opened it up and looked inside. RVOL is built in three parts:
- Build the “normal” line. For every time of day, the indicator averages the stock’s volume over the last 10 sessions. This produces a smooth profile of what is usual for that stock at 10:00, 11:30, 1:30 and so on.
- Track today’s real volume. As the session unfolds, the indicator adds up the volume actually traded so far today.
- Compare the two. Today’s volume so far is divided by the normal volume for the same point in the day. The result is RVOL, or relative volume: relative to the last 10 sessions and relative to the time of day.
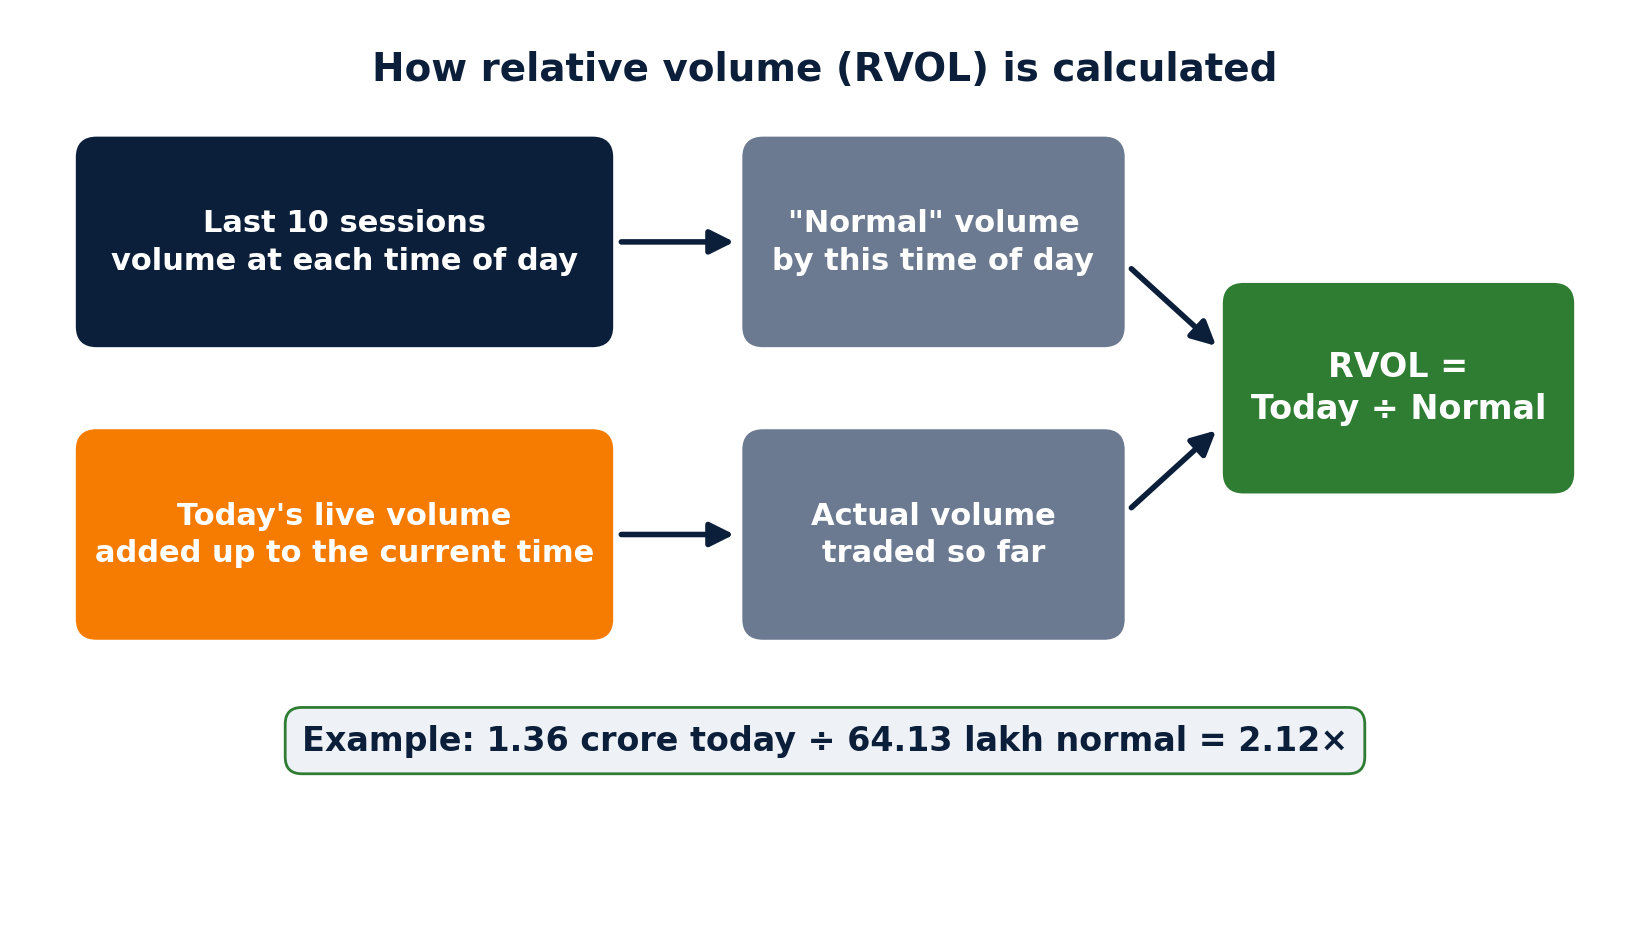
Figure 3: RVOL compares today’s cumulative volume with the 10-session normal for the same time of day.
| RVOL reading | Meaning |
|---|---|
| 1.0× | Volume is exactly in line with the stock’s normal for this time of day |
| Above 1× (for example 2×) | Volume is higher than normal. At 2× the stock is trading double its usual volume by now, a sign that institutions may be active |
| Below 1× | Volume is quieter than normal, so the stock is likely to drift |
Note
Because RVOL uses the last 10 sessions and the time of day, a reading is directly comparable across every stock in the list. That is why it can be used to rank an entire index.
The RVOL Scanner
Checking RVOL stock by stock would be slow, so the indicator is packaged as a scanner. The RVOL Scanner reads live data from the Dhan API, calculates RVOL for every Nifty 50 stock (or a watchlist you choose) and ranks them from most active to least active. It was built with the help of an AI assistant (Claude), and both the ready-to-run application and the full source code are included in the download listed under Resources.
| Requirement | Details |
|---|---|
| Computer | A Windows PC (the scanner ships as a Windows application) |
| Account | A Dhan trading account with access to the DhanHQ APIs |
| Connection | Internet access, because volume is fetched live from the Dhan API |
| Files | The RVOL Scanner download from the Resources section |
Setting it up takes five steps.
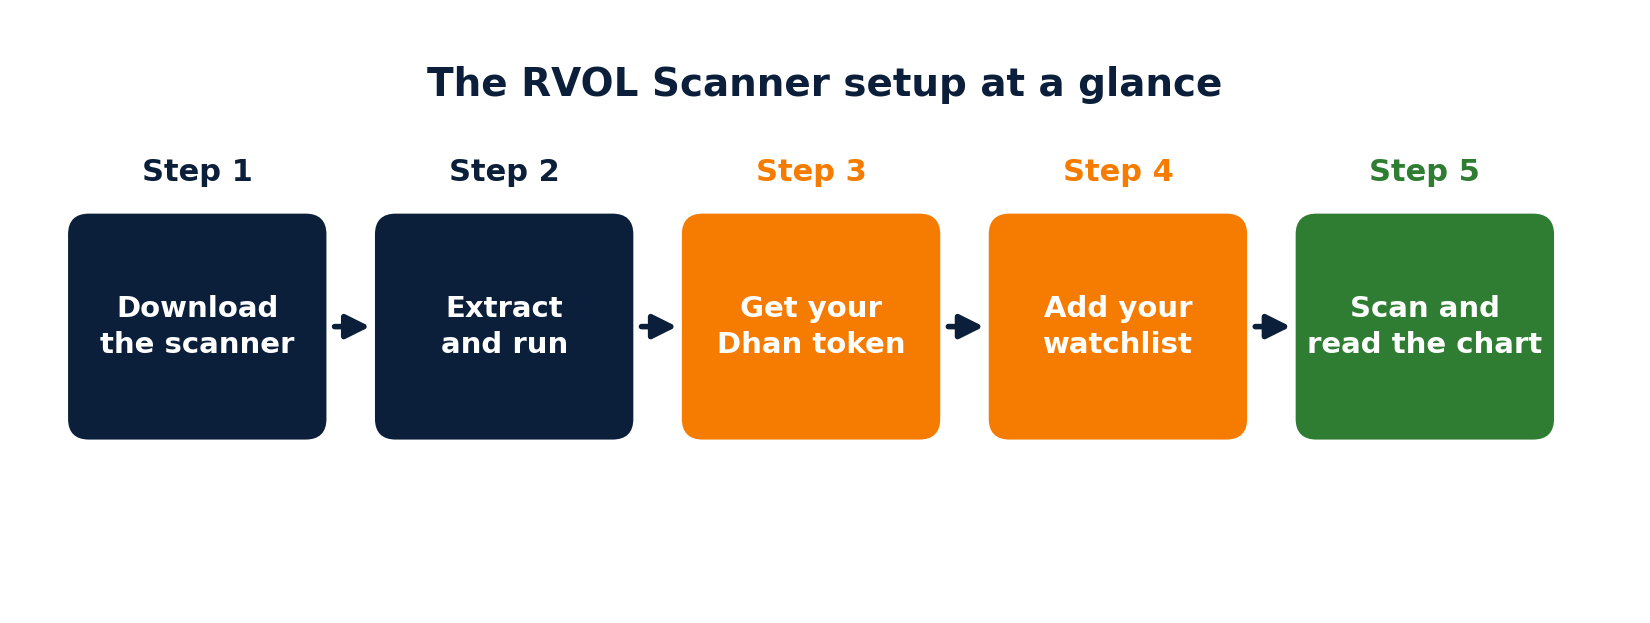
Figure 4: The five steps from download to your first scan.
Step 1: Download the Scanner
What to do: Open the Google Drive link given in the Resources section at the end of this article and download the file to your computer.
Why: The download contains everything you need: the ready-to-run scanner and its source code.
Expected result: A file (or folder) named “RVOL Find Which Stock Will Move Today (Dhan API)” is saved in your Downloads folder.
Step 2: Extract and Run the Scanner
What to do: If the download is compressed, right-click it and choose Extract All. Inside you will find two folders: RVOL Scanner Exe and RVOL Scanner Source Code Files.
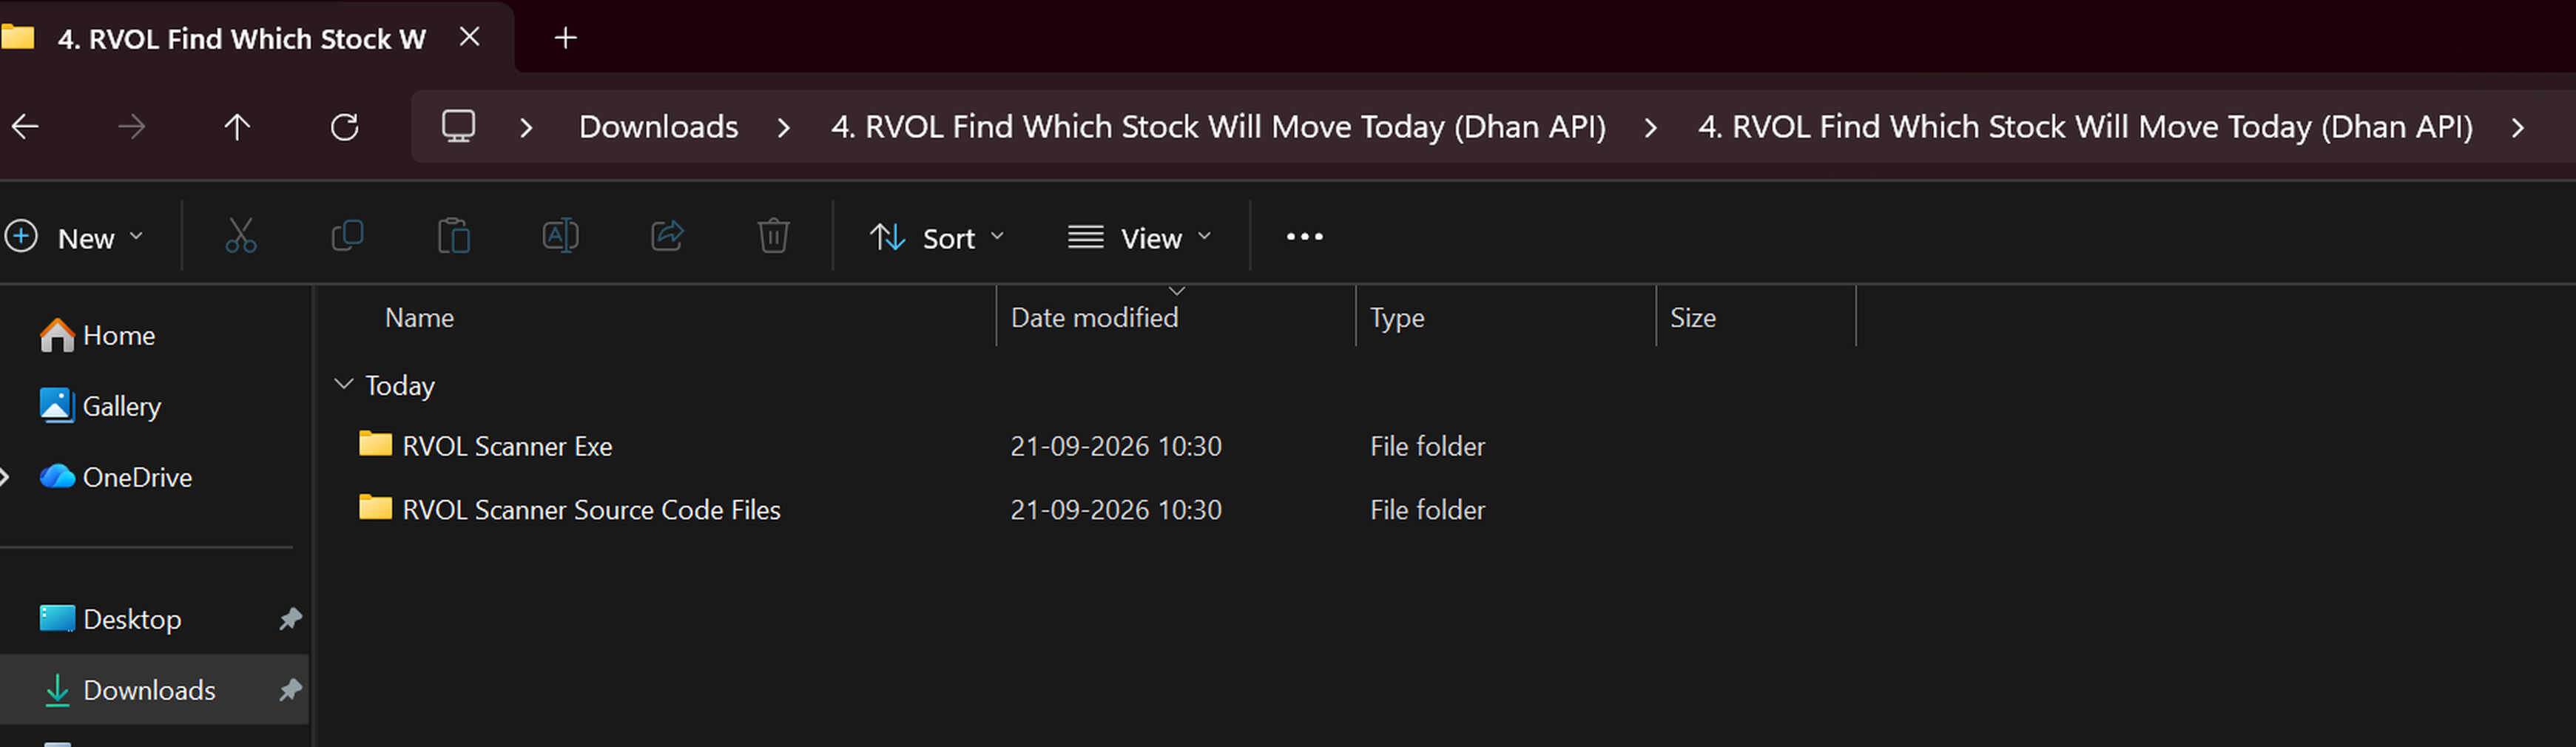
Figure 5: After extraction, the package contains two folders: the ready-to-run application and its source code.
Open RVOL Scanner Exe. It contains four items: RVOLScanner (the application), config.json (where your settings are saved), and the INSTALL and README text files with the bundled notes.
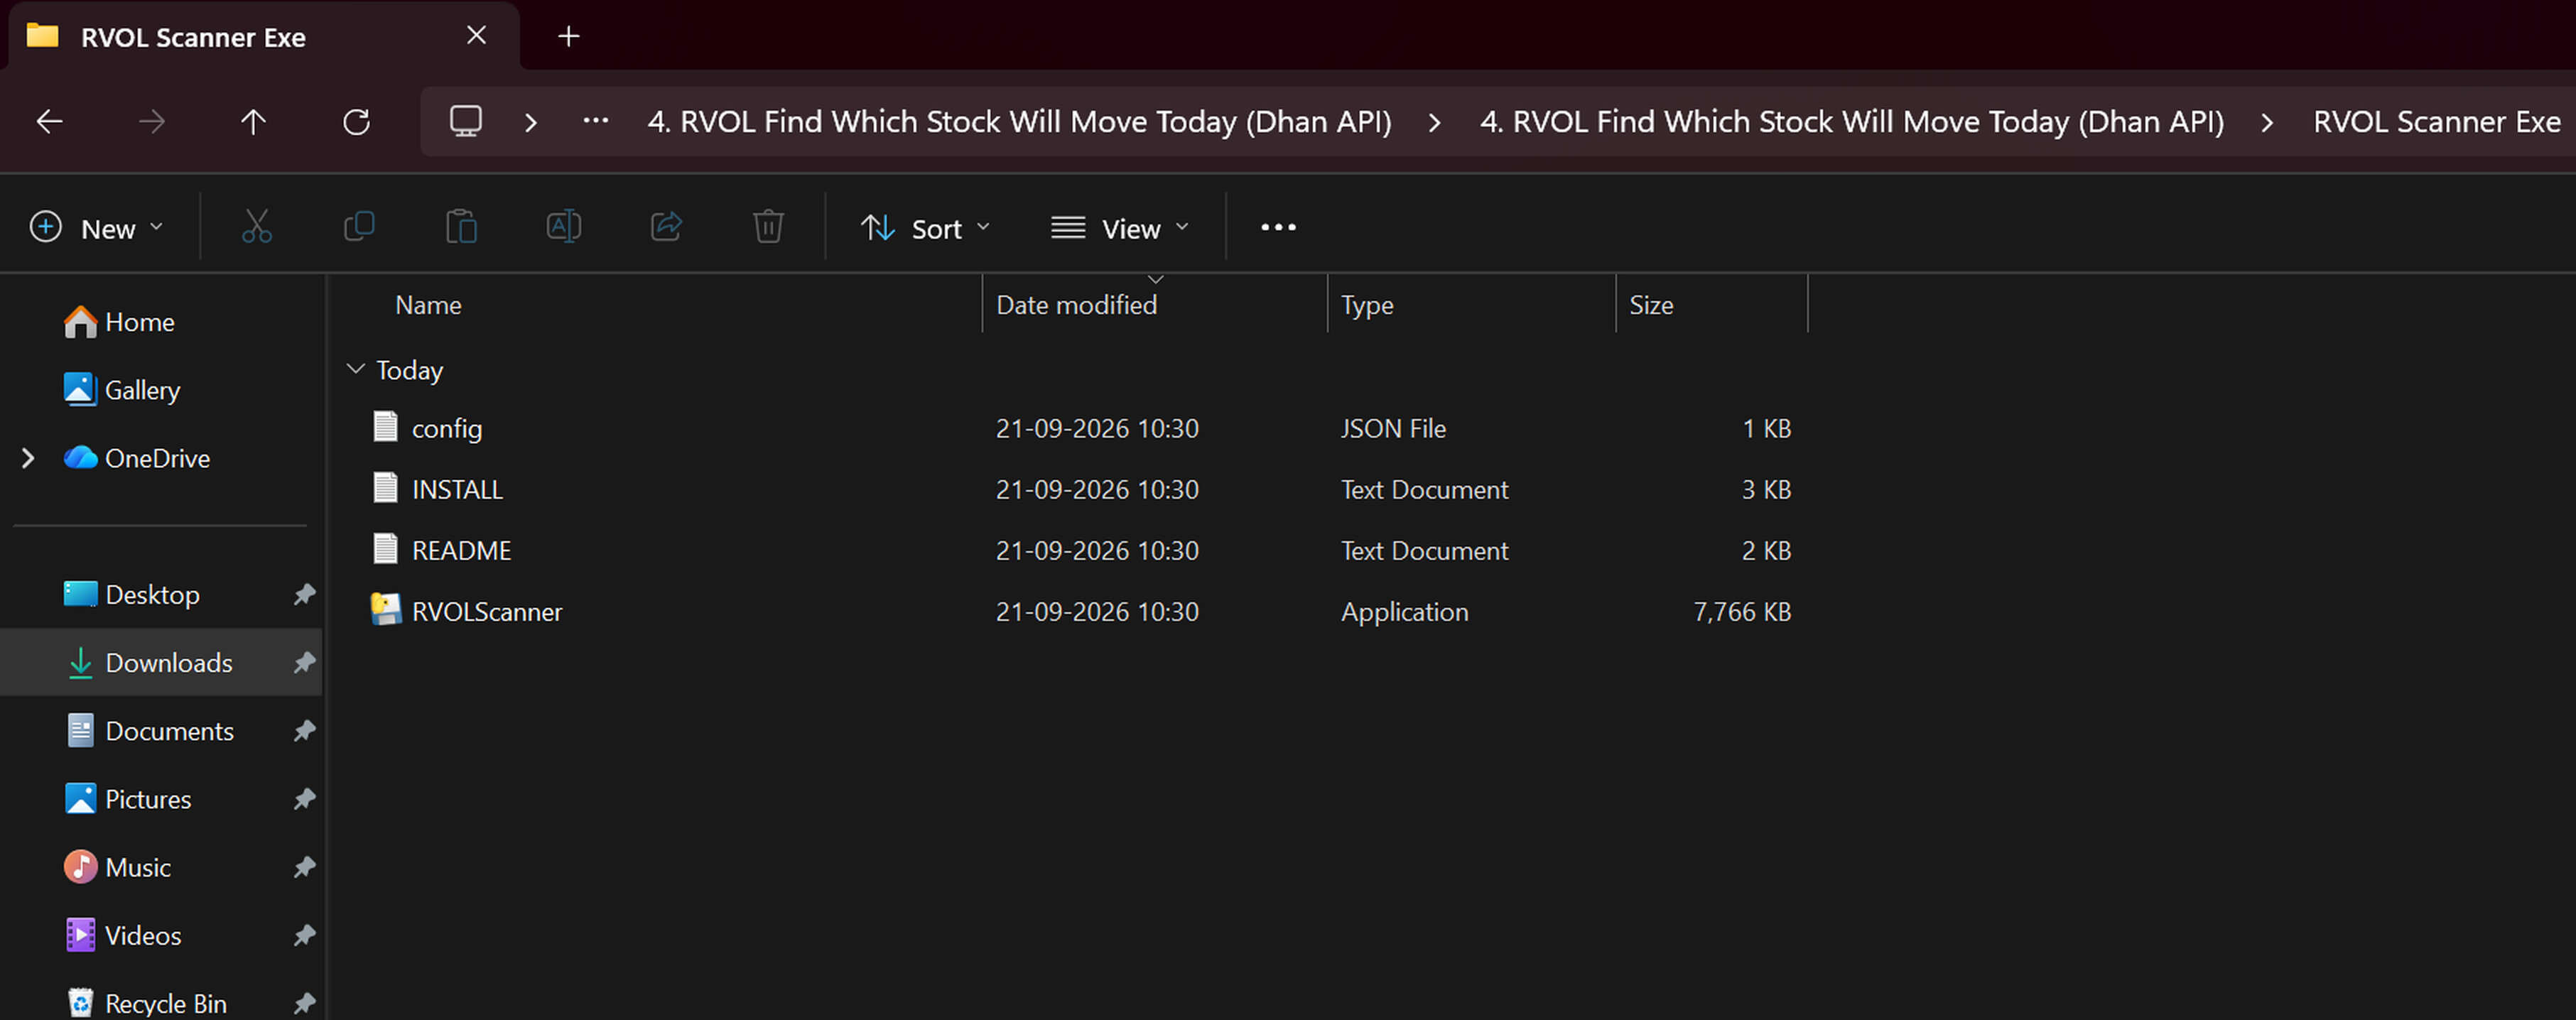
Figure 6: Contents of the RVOL Scanner Exe folder. Double-click RVOLScanner to launch the application.
How: Double-click RVOLScanner. On first launch, the scanner takes you to its Setup screen because no token has been saved yet.
Why: The application is self-contained, so there is nothing else to install or configure before setup.
Keep
RVOLScannerandconfig.jsontogether in the same folder. The scanner saves your settings inconfig.jsonnext to the program, so moving the application alone will lose your configuration.
Step 3: Get Your Dhan Access Token
What to do: Generate an access token from your Dhan account and paste it into the scanner.
Why: The scanner needs the token to fetch volume data from the Dhan API. Your client ID is read directly from the token, so you do not have to type it.
How:
- Log in to your Dhan account.
- Click your Profile.
- Open DhanHQ Trading and Data APIs.
- Create an Access Token and copy it.
- Return to the scanner’s Setup screen and paste it into the Access token box.
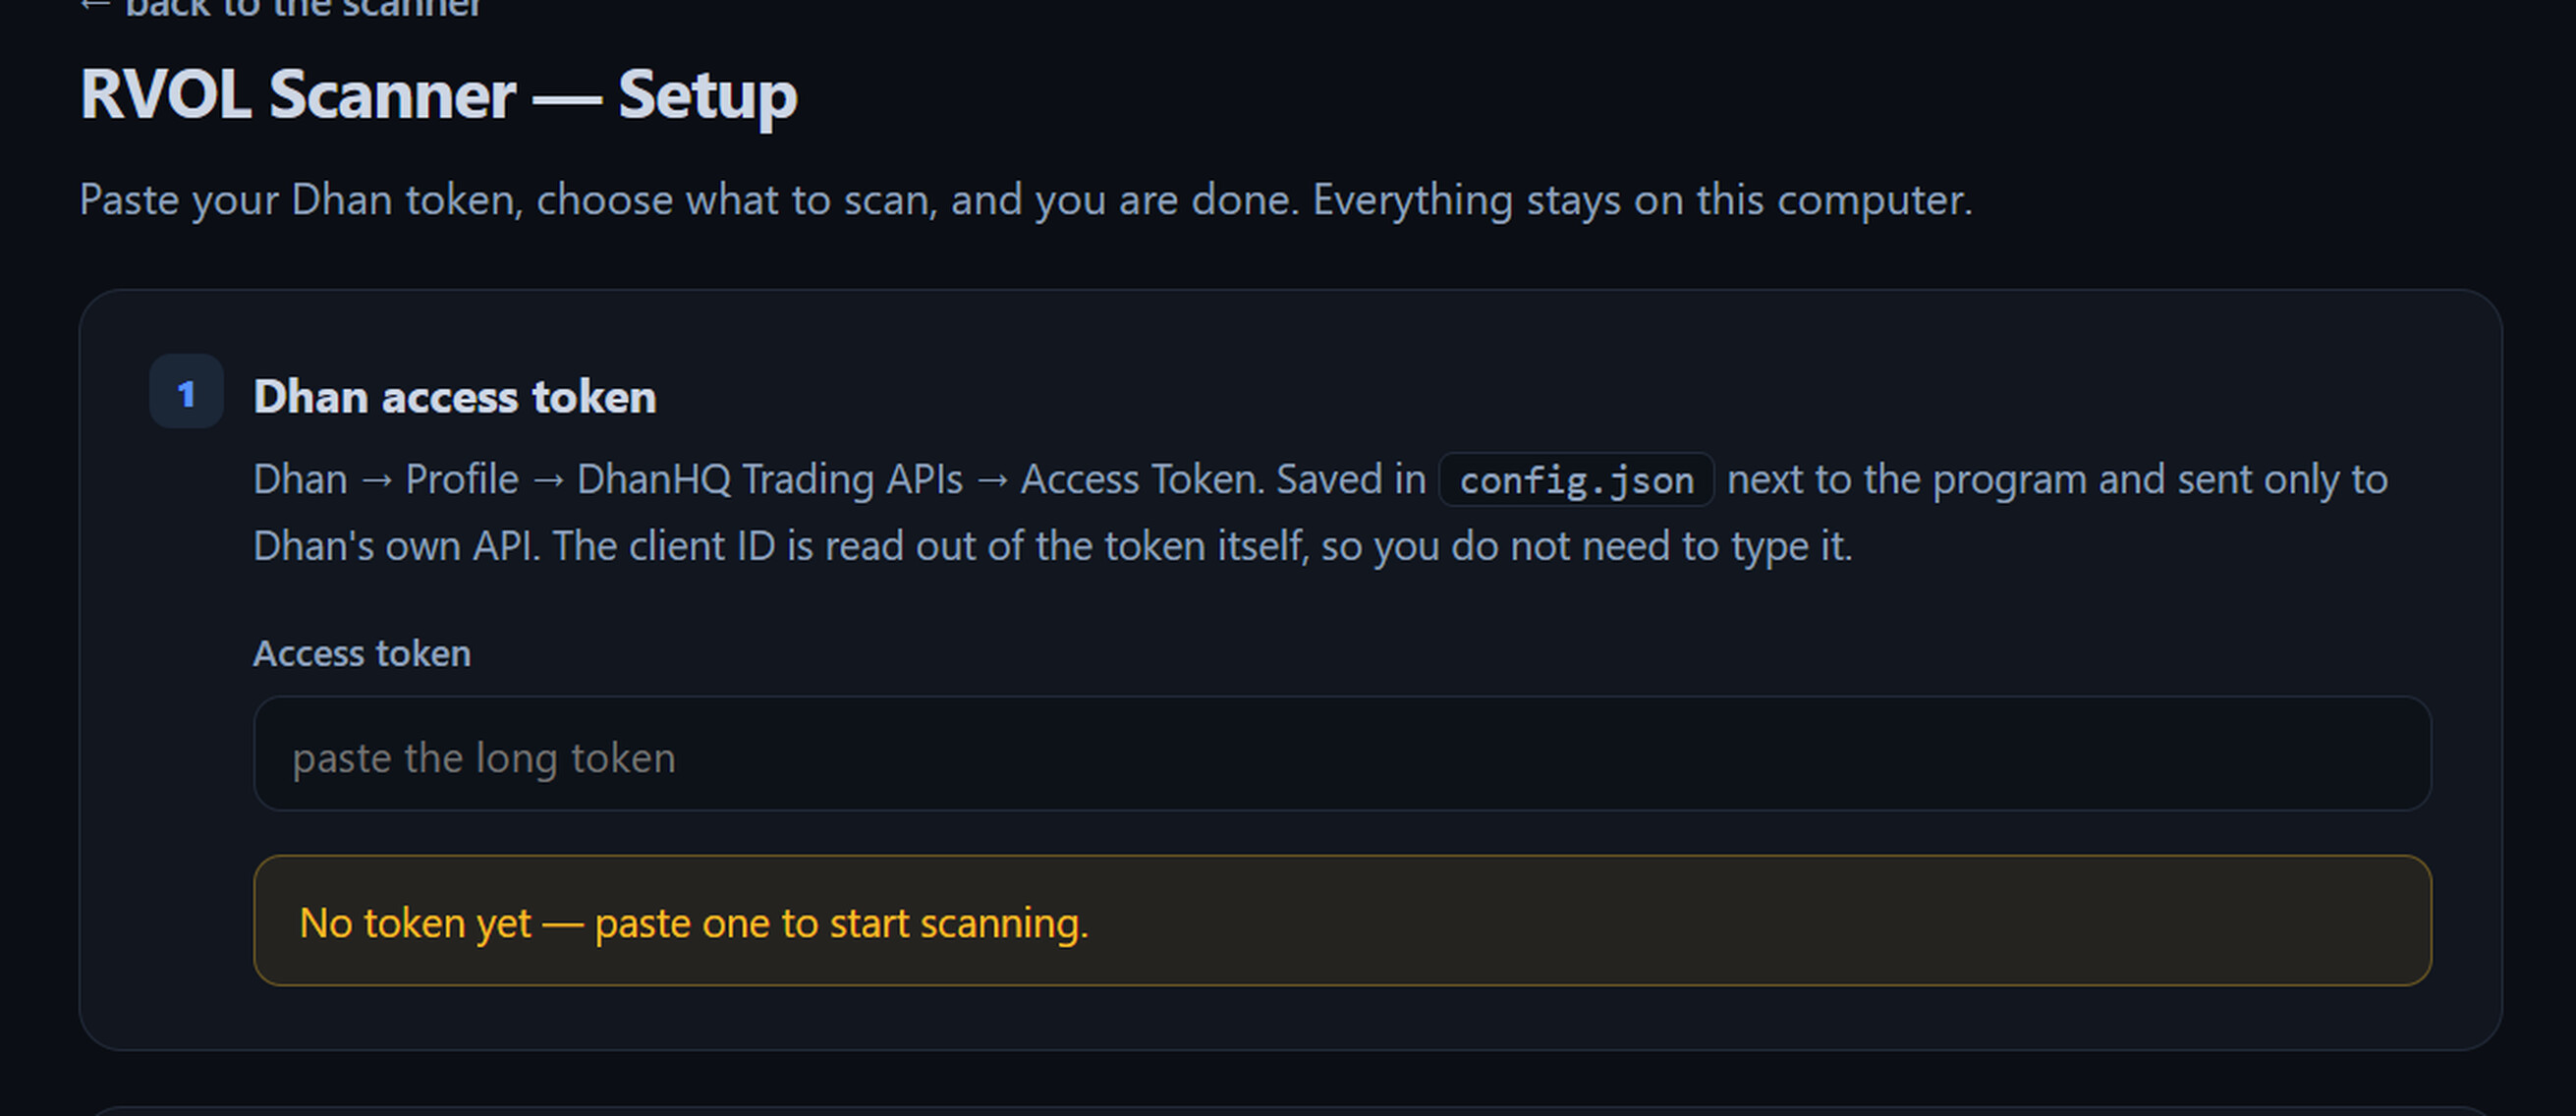
Figure 7: Setup screen before a token is added. The scanner shows “No token yet”.
Expected result: Once the token is saved, the message turns green and confirms the client it belongs to and the date and time until which the token is valid.
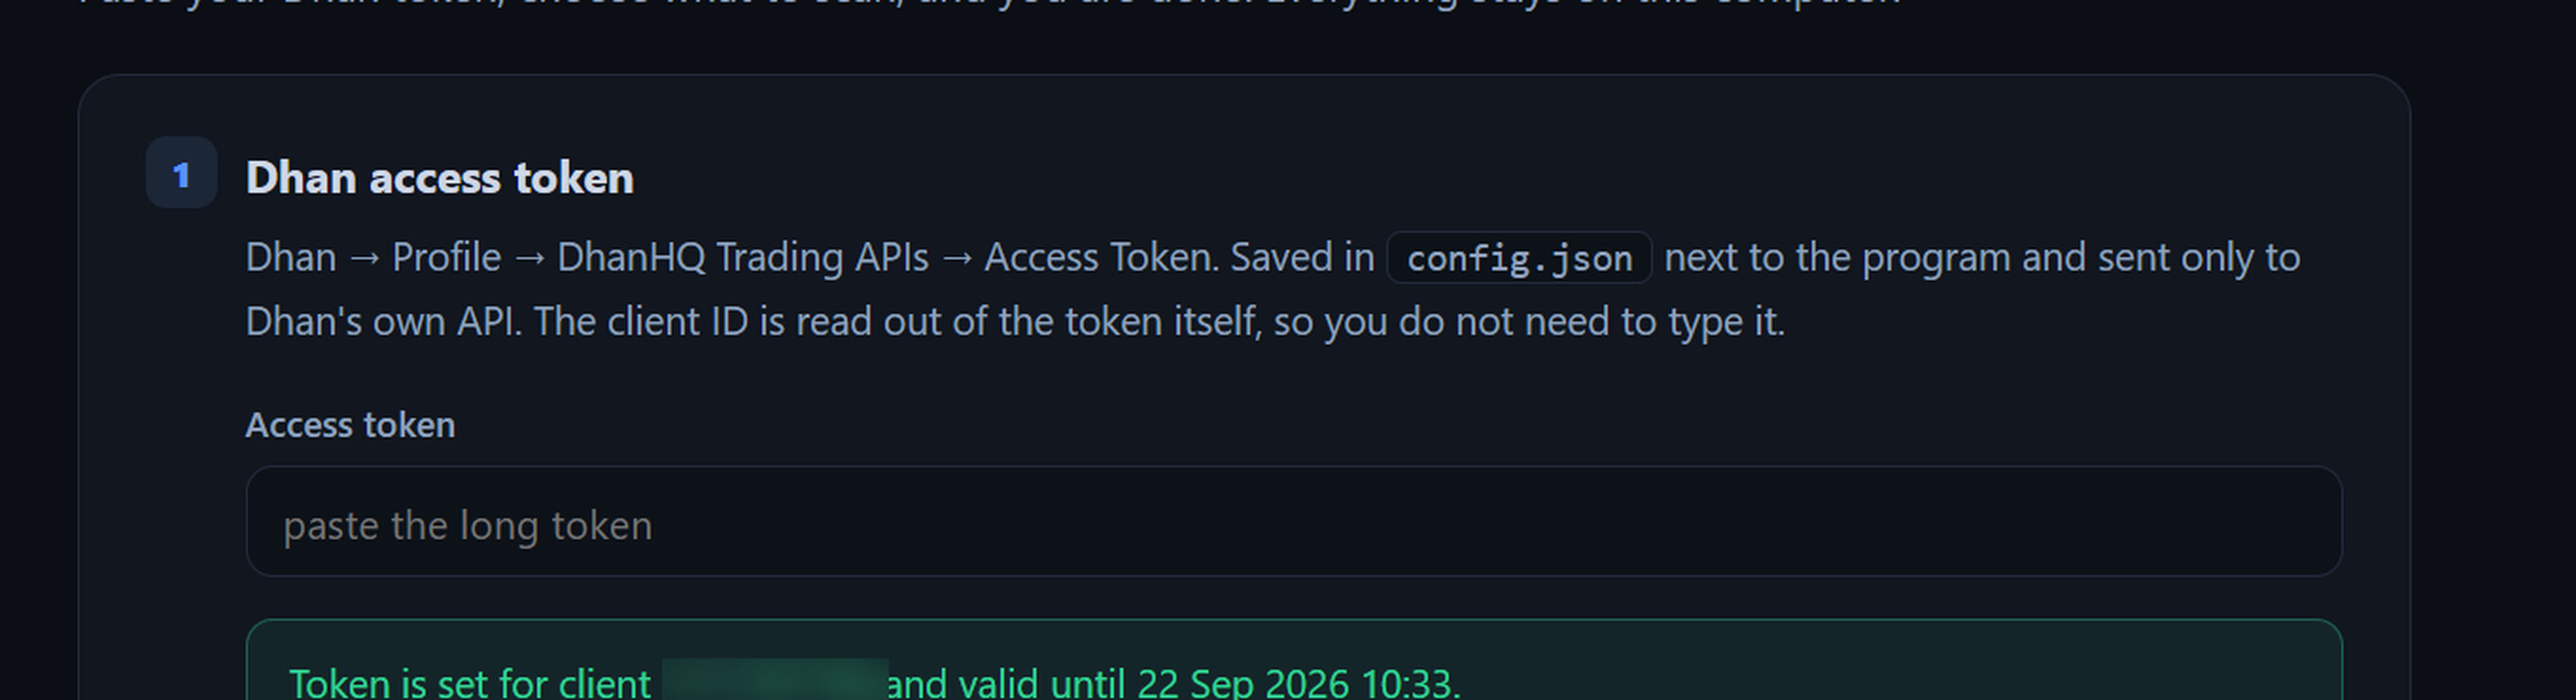
Figure 8: A valid token is confirmed with the client and an expiry date and time.
Keep your token private
Treat the access token like a password. The scanner stores it in
config.jsonon your own computer and sends it only to Dhan’s API. Never shareconfig.jsonor post your token online. Also check the expiry shown in the confirmation message: when it lapses, generate a new token and paste it again.
Step 4: Add Your Watchlist
What to do: Tell the scanner which stocks to scan. There are two options.
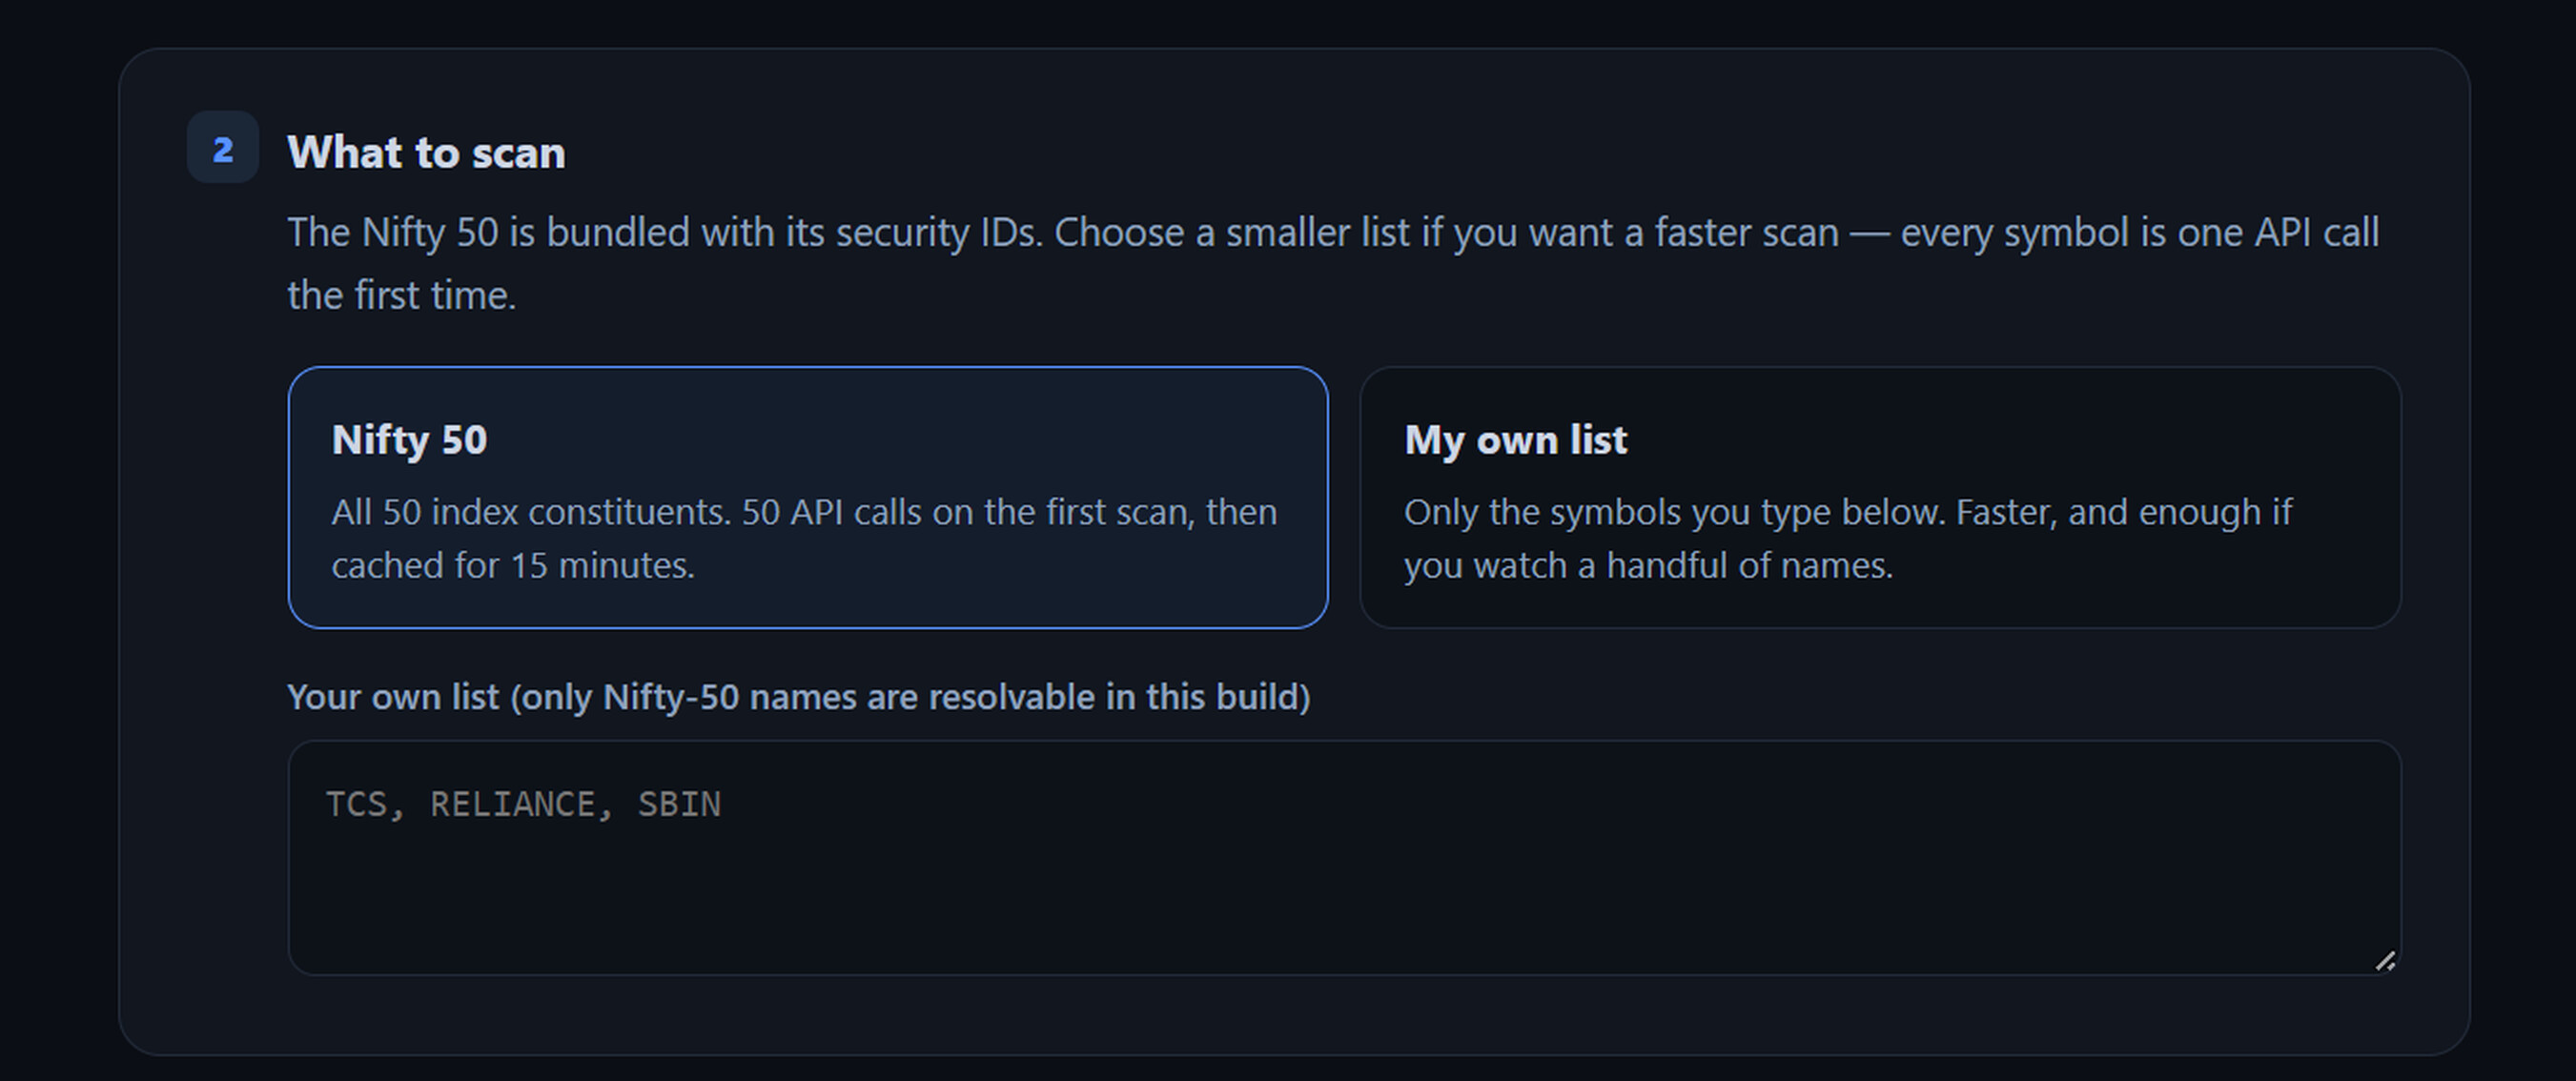
Figure 9: Choose between the full Nifty 50 or your own list of symbols.
| Option | What it does | Example |
|---|---|---|
| Nifty 50 | Scans all 50 index constituents. The first scan makes 50 API calls, and results are then cached for 15 minutes | Just select the card. Nothing to type |
| My own list: general | Scans only the symbols you type. Faster, and enough if you watch a handful of names | TCS, RELIANCE, SBIN |
| My own list: banks | A sector-focused watchlist | KOTAKBANK, HDFCBANK, ICICIBANK, AXISBANK, INDUSINDBK, SBIN |
| My own list: IT | Another sector-focused watchlist | TCS, INFY, WIPRO, HCLTECH, TECHM |
In this build, only Nifty 50 names can be resolved. Type symbols in capitals, separated by commas. Every symbol is one API call the first time, so a shorter list scans faster.
Here is what a filled-in list looks like:
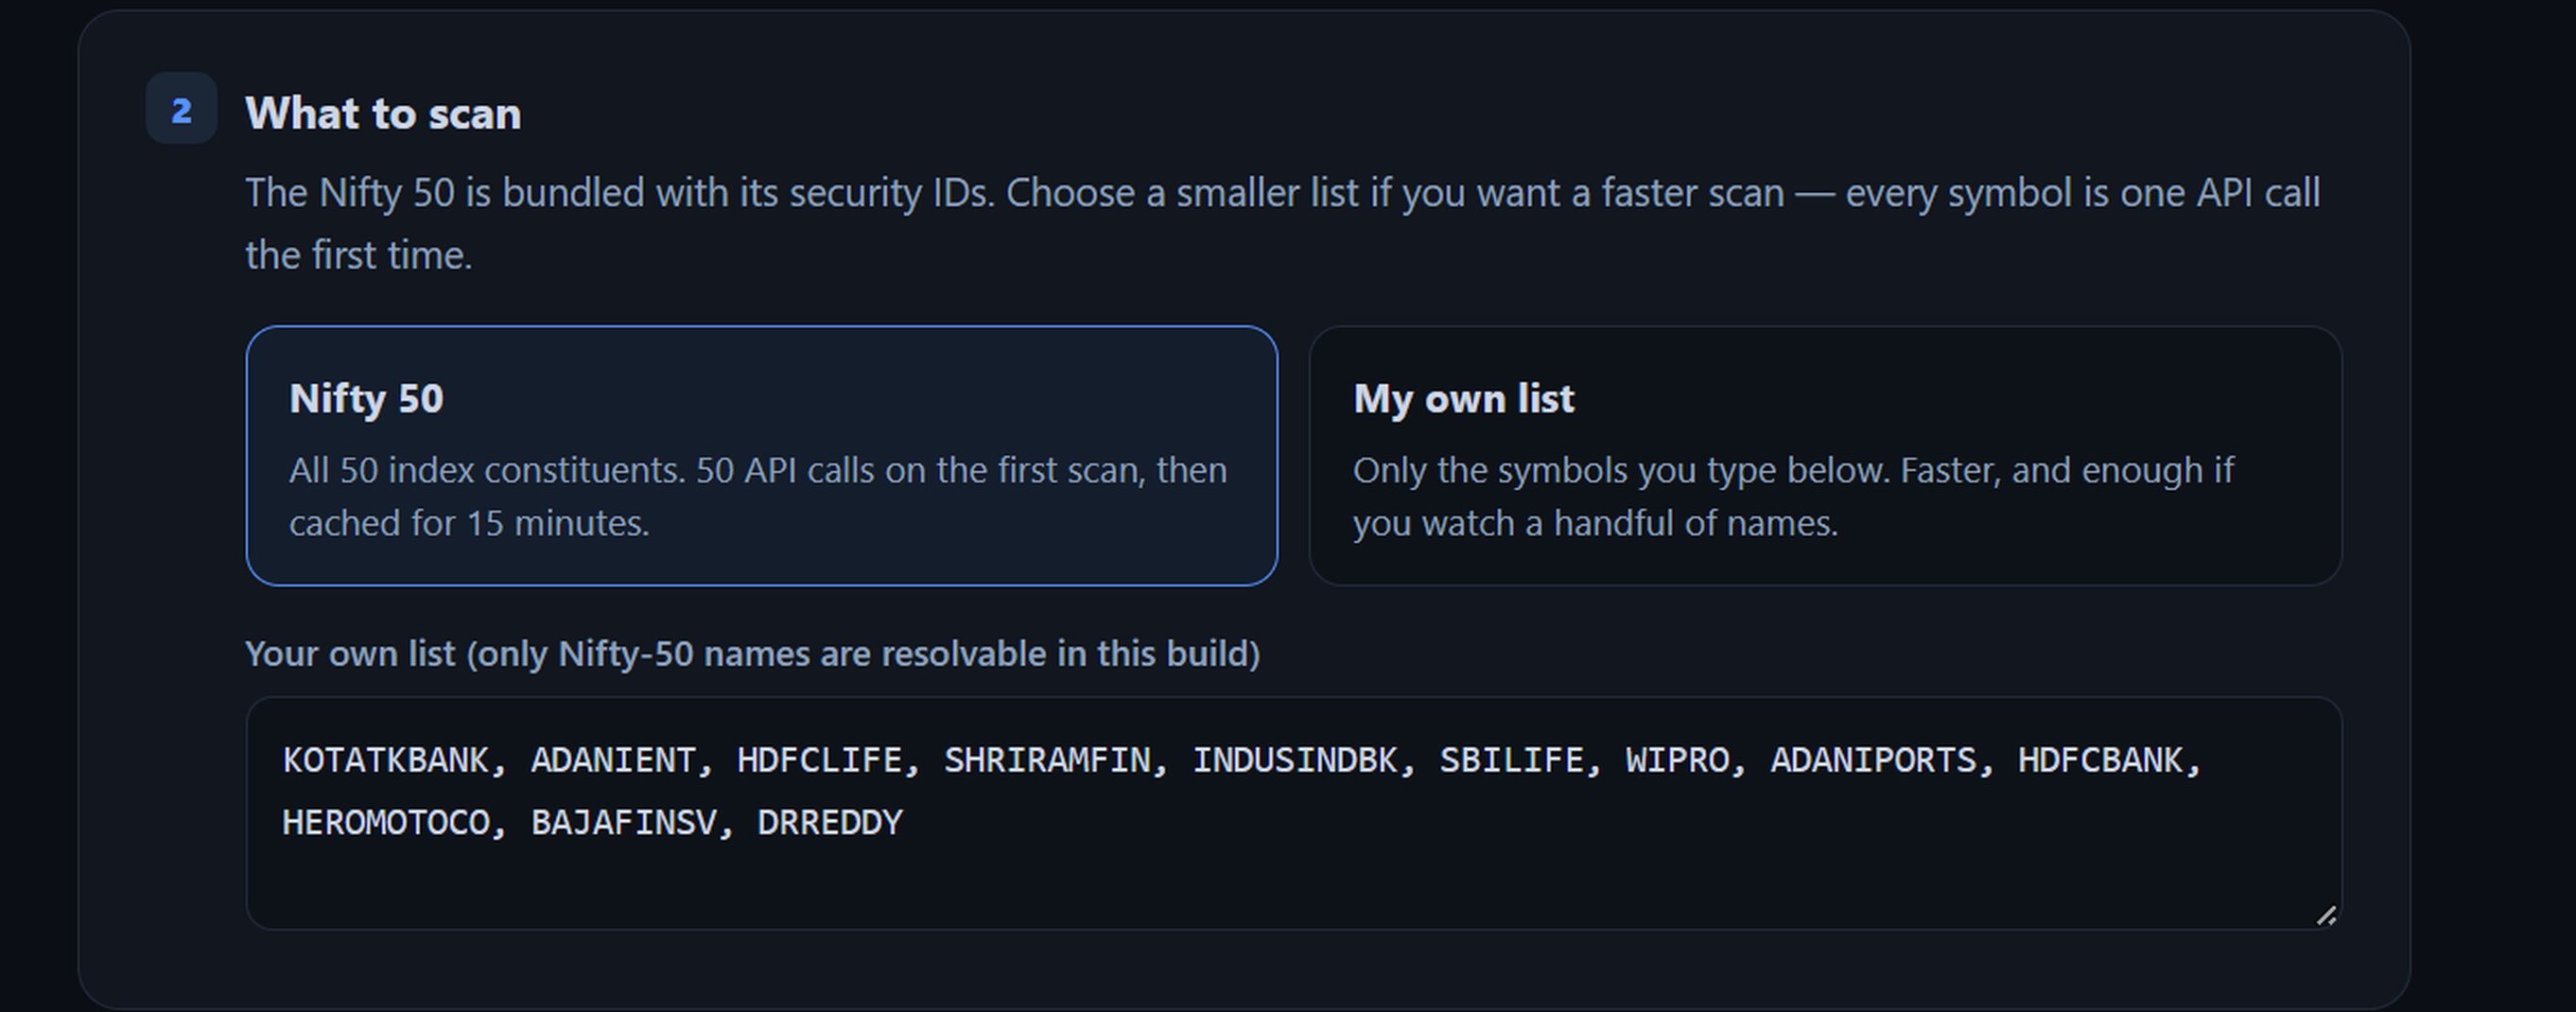
Figure 10: “My own list” with a set of Nifty 50 symbols entered as a comma-separated list.
Next, review How it is measured. The defaults are sensible, and you should change them only if you know why.
| Setting | Default | What it controls |
|---|---|---|
| Baseline sessions | 10 | How many past sessions form the stock’s “normal” volume |
| Minimum turnover (₹ crore) | 5 | Ignores stocks whose traded value is too small to matter |
| Default scan time | 09:45 | The time of day the scan is run for by default |
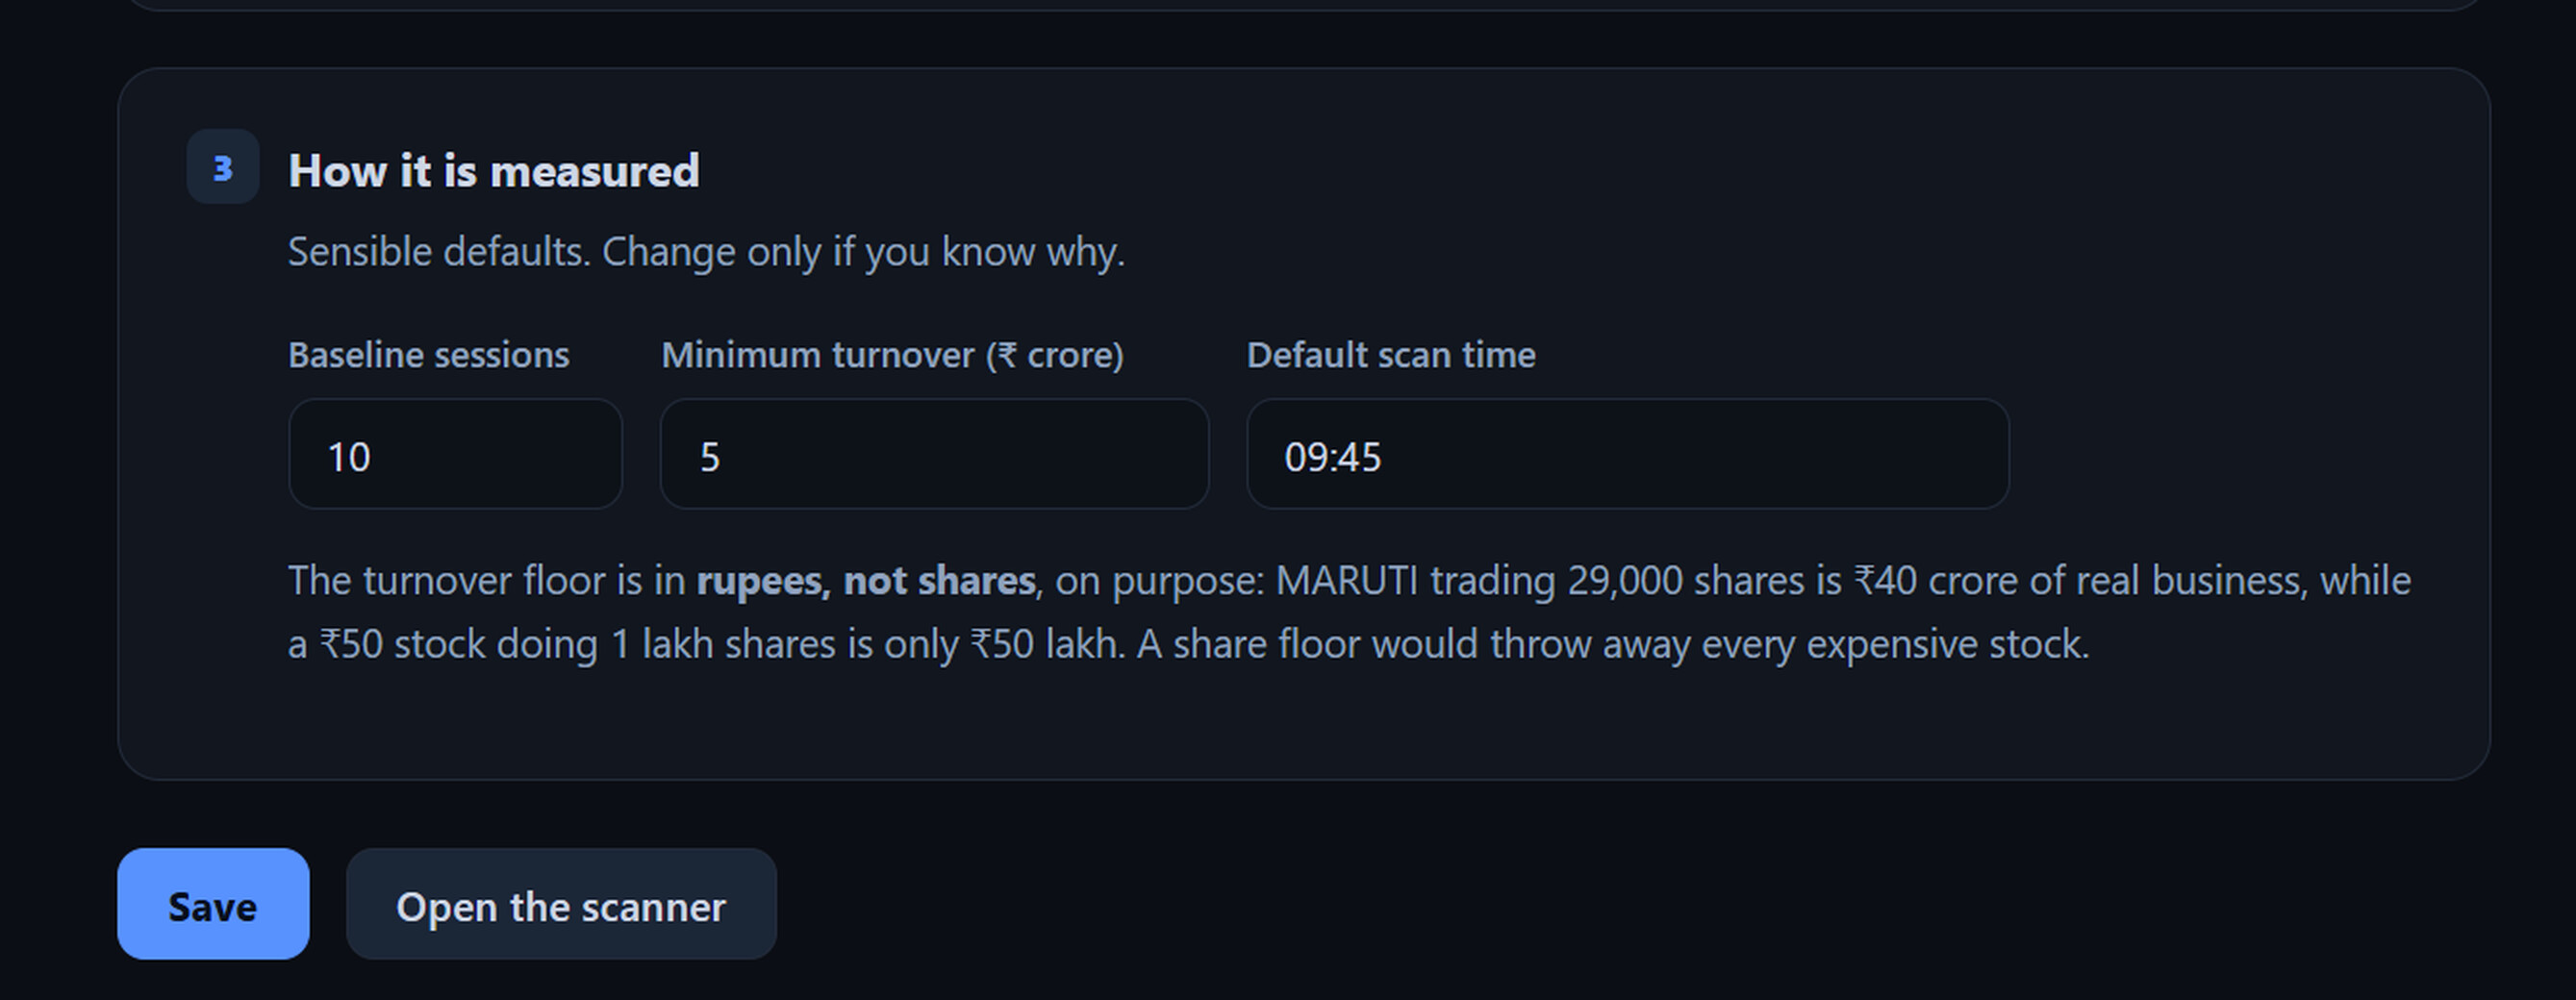
Figure 11: Measurement settings with their default values.
A share-count floor would unfairly discard expensive stocks. For example, MARUTI trading 29,000 shares represents about ₹40 crore of real business, while a ₹50 stock trading 1 lakh shares is only ₹50 lakh. Measuring in rupees keeps the filter fair.
Click Save. Expected result: the scanner confirms “Saved. The scanner is ready.” and shows where your settings file and cache are stored. Then click Open the scanner.
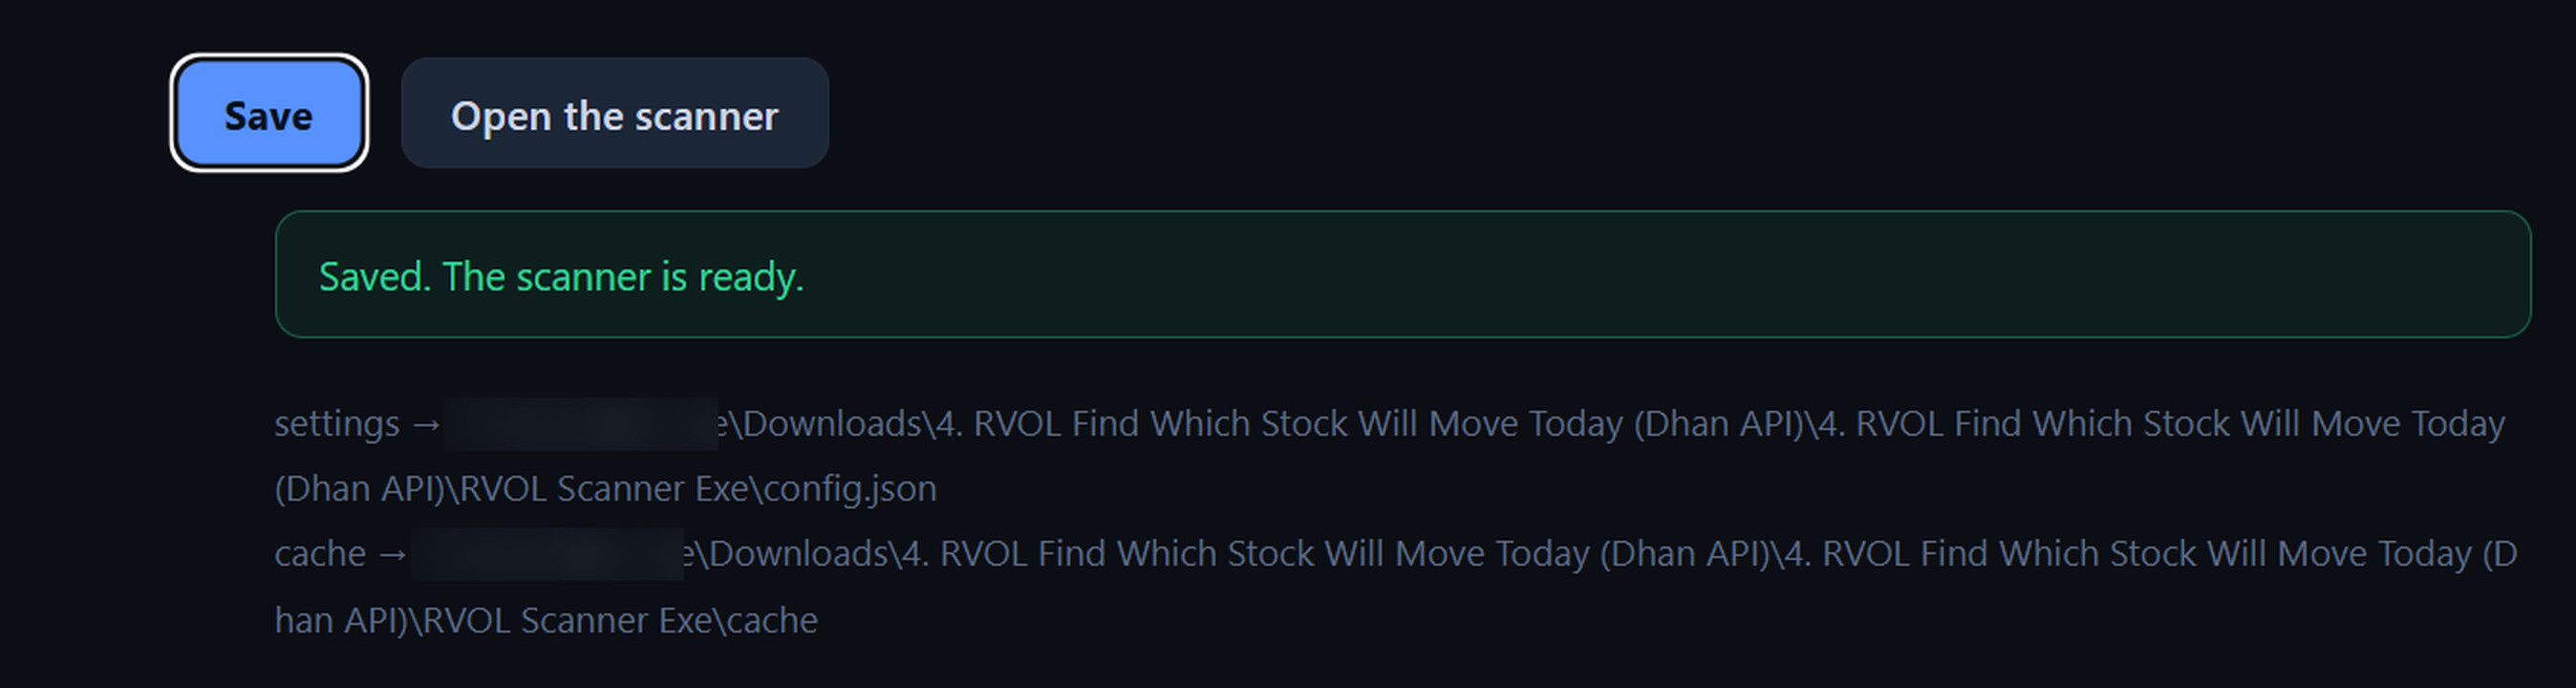
Figure 12: Settings are saved and the scanner is ready to use.
Step 5: Run the Scan and Read the Chart
What to do: In the scanner, choose the time you want to scan for and click Scan.
- As of slider: sets the time of day up to which volume is compared.
- Scan: runs the scan for the selected time.
- Now: sets the time to the present moment.
Expected result: the left panel shows every stock ranked by RVOL, and the right panel draws the chart for the stock you select. The header shows the date, the number of stocks scanned (50 of 50) and the baseline (10 sessions).
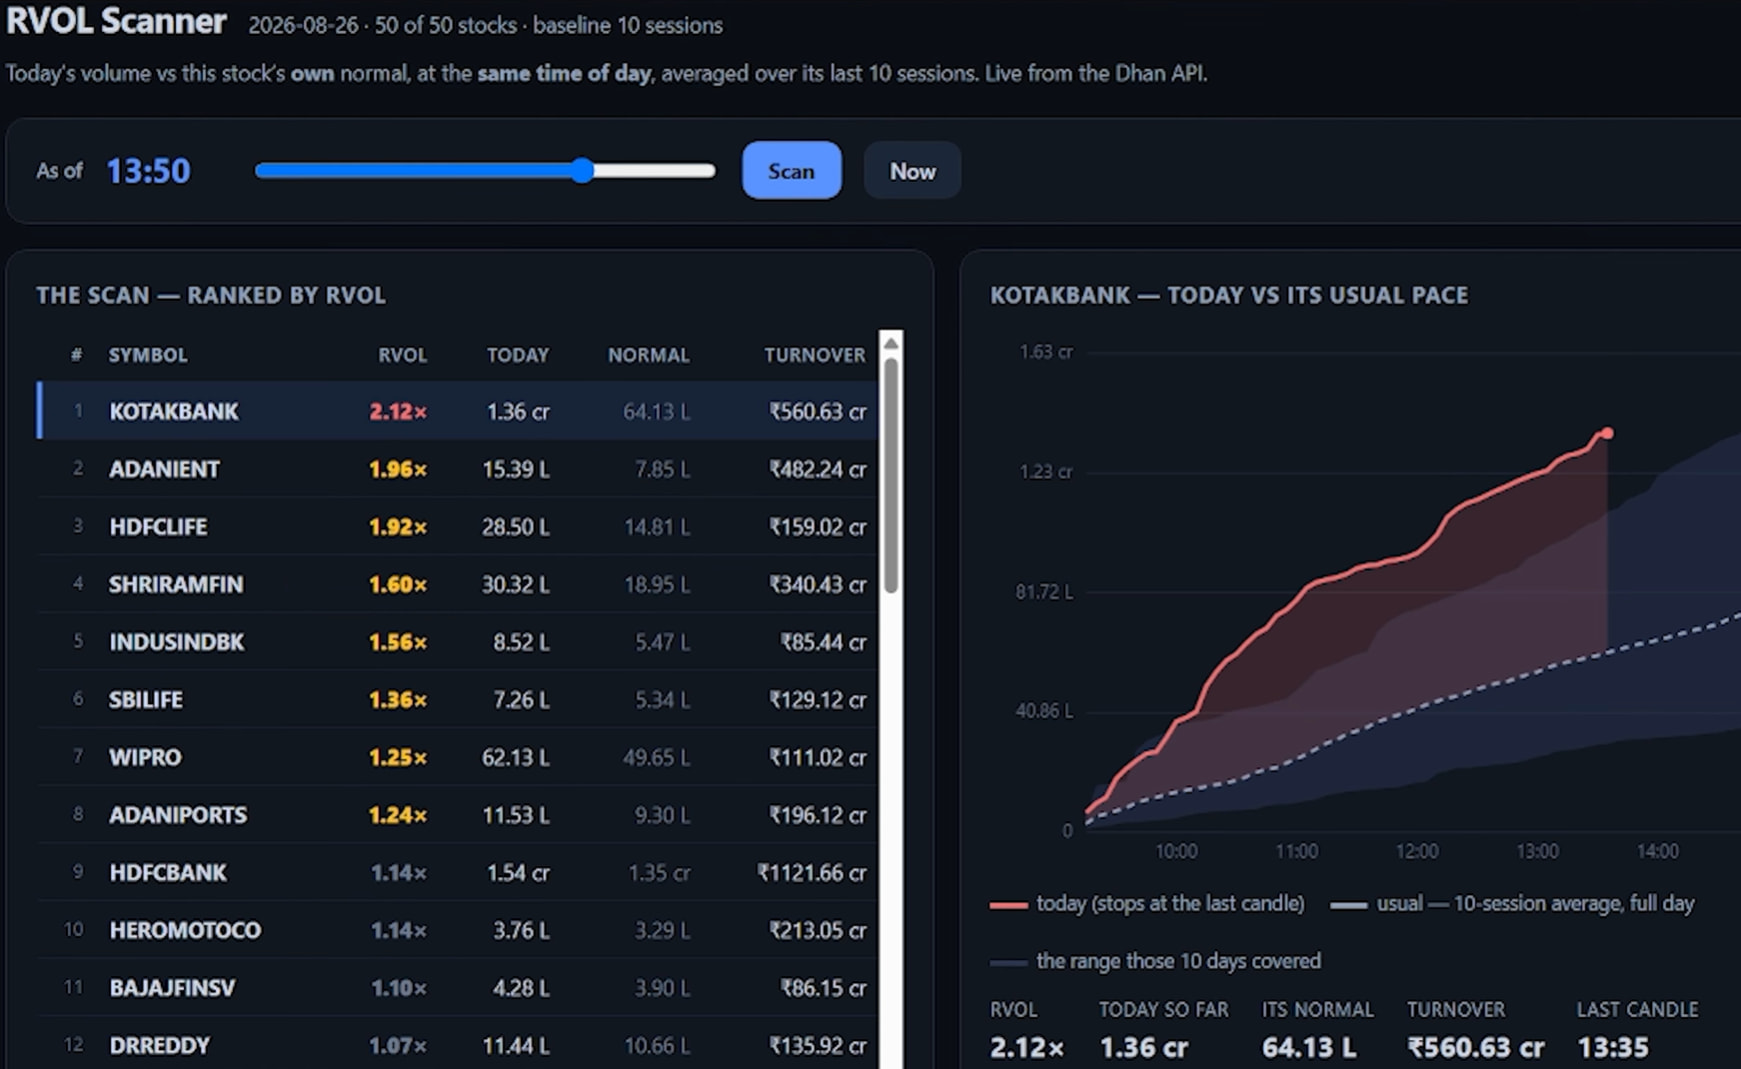
Figure 13: The scanner ranks all stocks by RVOL and draws a chart for the selected stock.
Each row of the table contains four numbers:
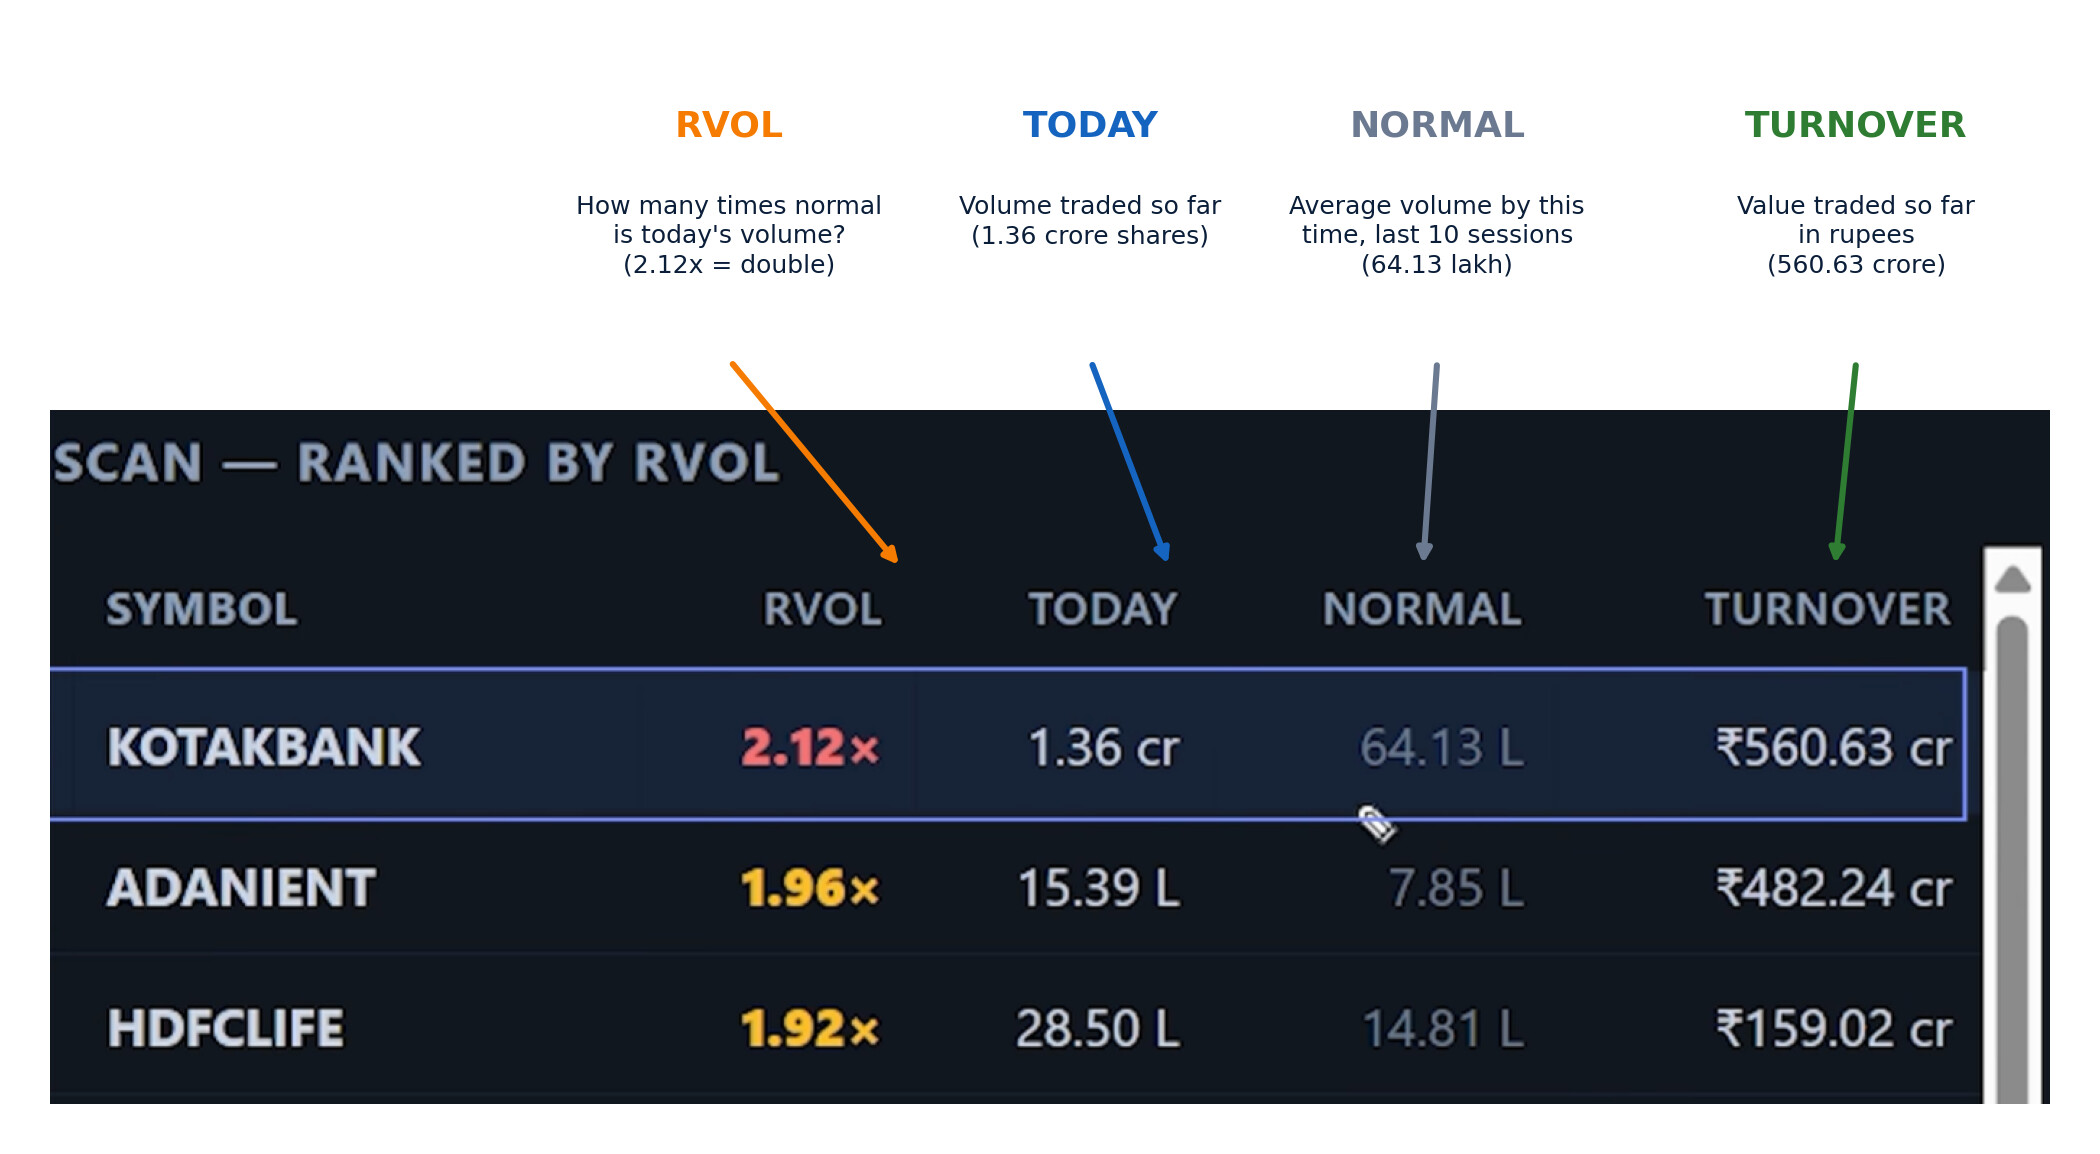
Figure 14: How to read each column of the ranked table.
| Column | Meaning |
|---|---|
| RVOL | Today’s volume as a multiple of normal. The strongest reading is highlighted in red and elevated readings in amber |
| Today | Volume traded so far today |
| Normal | Average volume traded by this time of day over the last 10 sessions |
| Turnover | Value traded so far, in rupees |
Click any stock to see how its day compares with its usual pace. The chart has three elements:
- Red line: today’s cumulative volume. It stops at the last completed candle.
- Dashed line: the usual volume, meaning the 10-session average through the full day.
- Shaded band: the range covered by those 10 sessions.
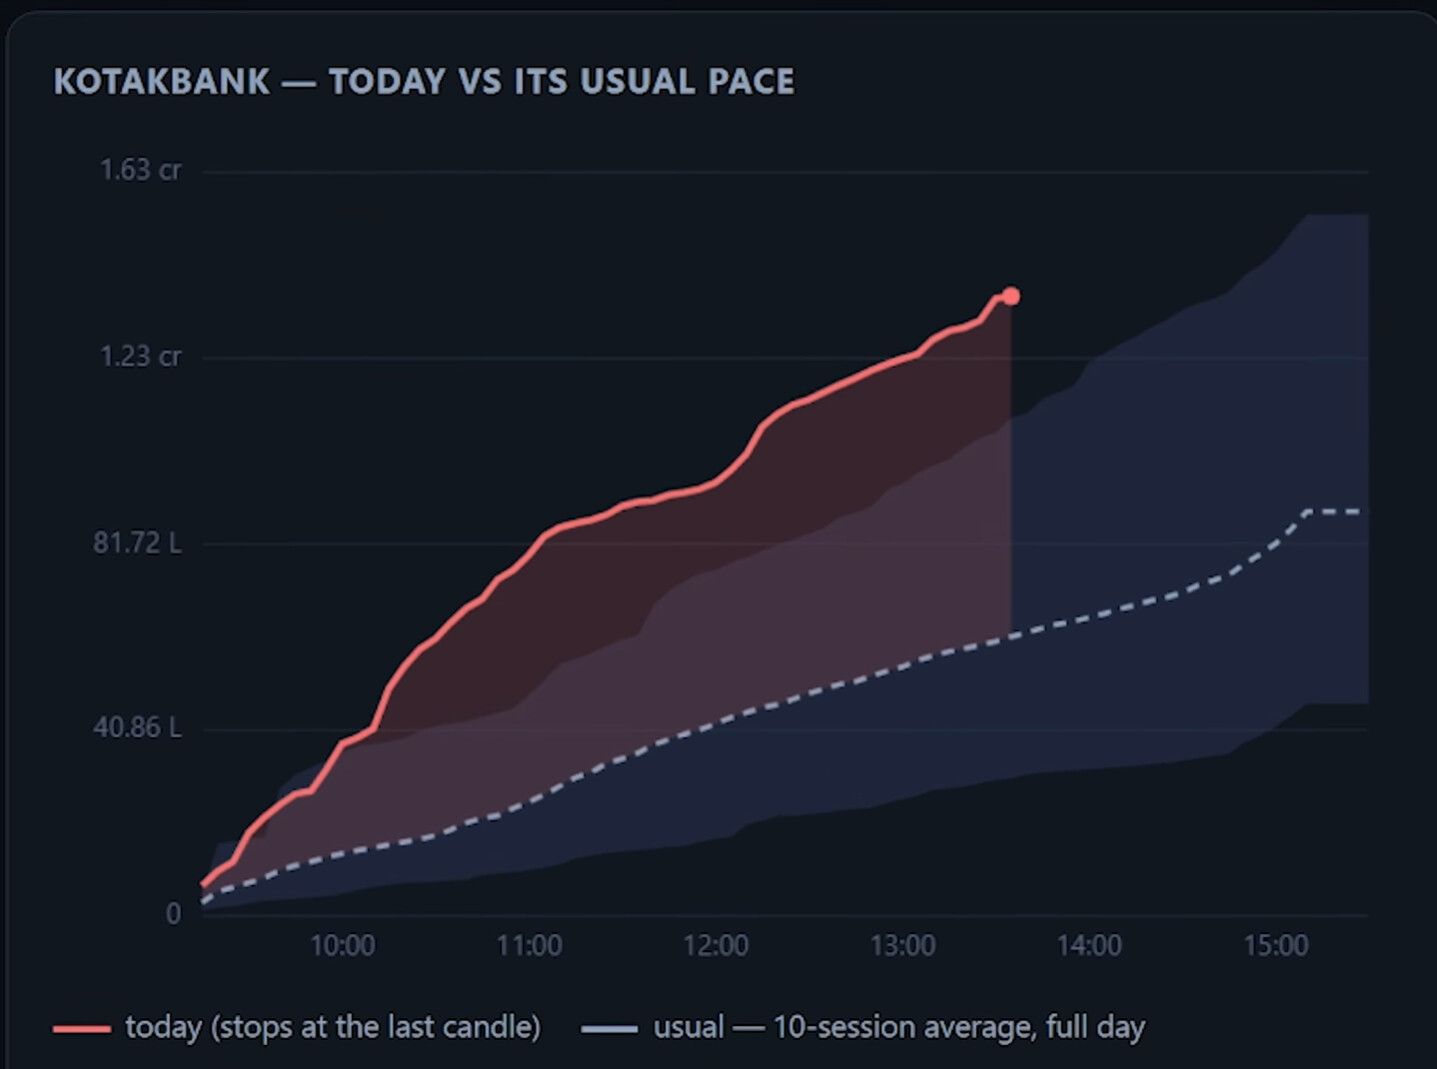
Figure 15: Kotak Bank: today’s cumulative volume (red) against its usual pace (dashed) and the 10-session range (shaded).
Below the chart, the scanner summarises the selected stock: RVOL, volume so far, its normal, turnover and the time of the last candle.
Reading a Real Scan: Kotak Bank in Focus
Here is the scan from the screenshots above, taken at 13:50. The list is ranked by RVOL:
| # | Symbol | RVOL | Today | Normal | Turnover |
|---|---|---|---|---|---|
| 1 | KOTAKBANK | 2.12× | 1.36 cr | 64.13 L | ₹560.63 cr |
| 2 | ADANIENT | 1.96× | 15.39 L | 7.85 L | ₹482.24 cr |
| 3 | HDFCLIFE | 1.92× | 28.50 L | 14.81 L | ₹159.02 cr |
| 4 | SHRIRAMFIN | 1.60× | 30.32 L | 18.95 L | ₹340.43 cr |
| 5 | INDUSINDBK | 1.56× | 8.52 L | 5.47 L | ₹85.44 cr |
| 6 | SBILIFE | 1.36× | 7.26 L | 5.34 L | ₹129.12 cr |
| 7 | WIPRO | 1.25× | 62.13 L | 49.65 L | ₹111.02 cr |
| 8 | ADANIPORTS | 1.24× | 11.53 L | 9.30 L | ₹196.12 cr |
| 9 | HDFCBANK | 1.14× | 1.54 cr | 1.35 cr | ₹1121.66 cr |
| 10 | HEROMOTOCO | 1.14× | 3.76 L | 3.29 L | ₹213.05 cr |
| 11 | BAJAJFINSV | 1.10× | 4.28 L | 3.90 L | ₹86.15 cr |
| 12 | DRREDDY | 1.07× | 11.44 L | 10.66 L | ₹135.92 cr |
Kotak Bank tops the list. Its normal volume by this time is about 64 lakh shares, yet today it has already crossed roughly 1.36 crore. That is around twice its usual volume, so something has clearly happened in Kotak Bank. Similarly, Adani Enterprises normally trades close to 8 lakh shares by this time but is running at about 16 lakh.
The next step is to confirm on the price chart. On the day of this scan, Kotak Bank’s volume was visibly denser than on earlier sessions, and the stock was also making a strong move of about 4%. This is the pattern to expect: in a stock where institutions have arrived, the price does not sit still. It tends to move decisively in one direction.
Note how the ranking works in your favour. A stock like HDFC Bank has enormous turnover (over ₹1,100 crore), yet its RVOL is only 1.14×, which means that huge number is simply normal for it. A smaller-volume stock can rank higher with much less turnover, because RVOL judges each stock against its own normal.
What RVOL Looks Like on a Price Chart
To see why RVOL is useful for stock selection, compare two model intraday charts. Each has the price candles on top, volume in the middle (with the normal volume as a dashed line), and the running RVOL at the bottom.
Model Chart A: High RVOL
In the morning, volume runs close to normal and price drifts sideways. Once volume expands, RVOL climbs well above 1× and the stock makes a strong, sustained one-sided move.
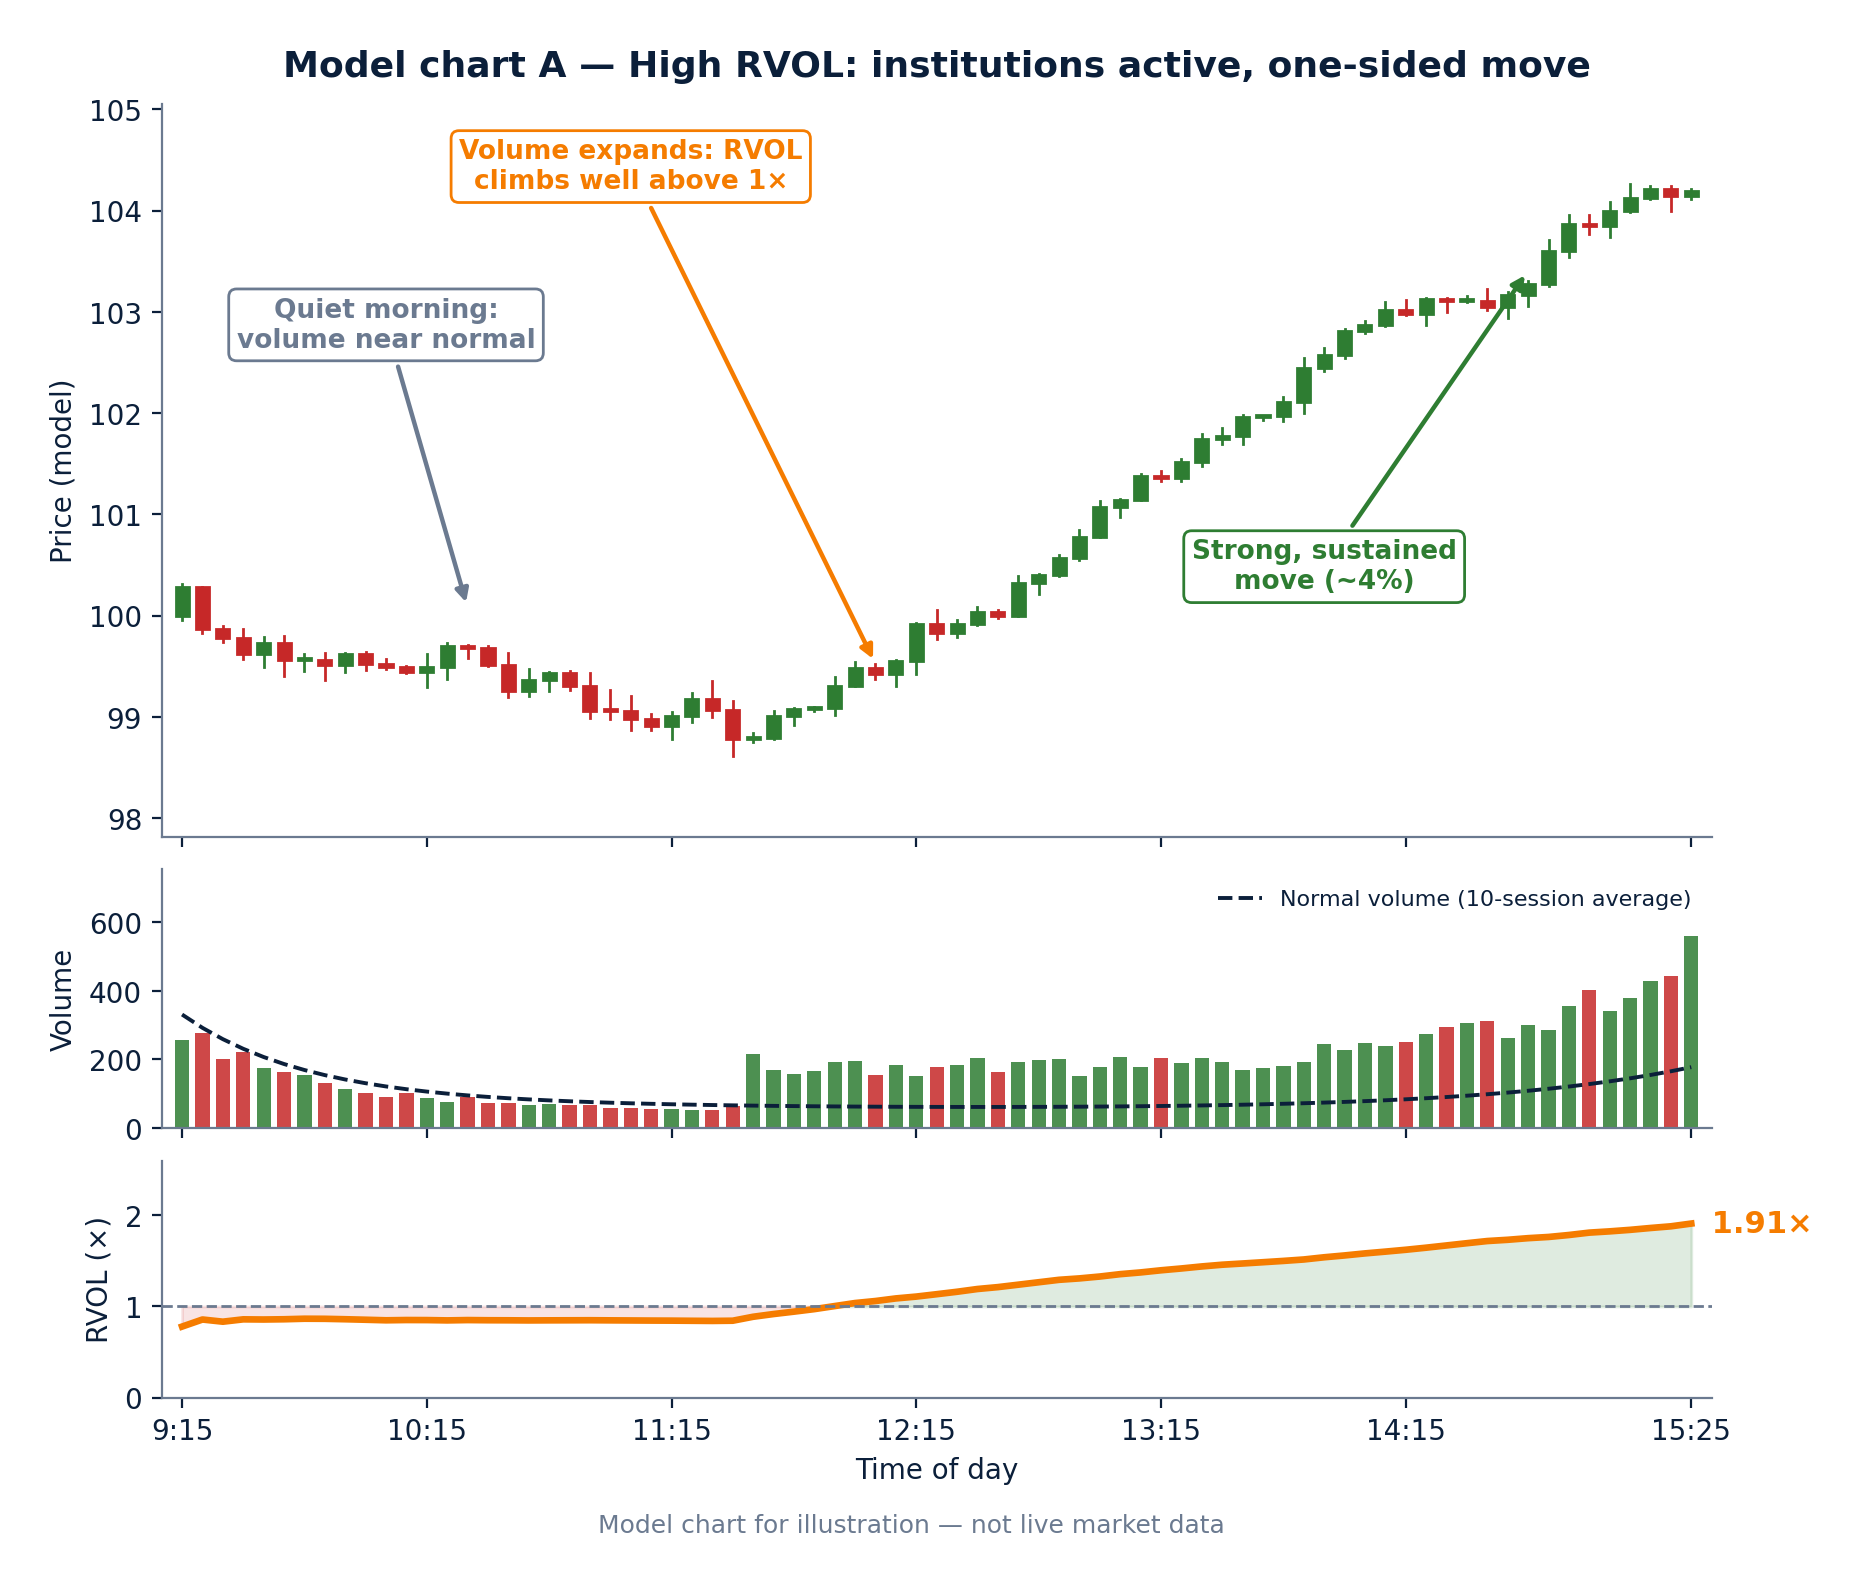
Figure 16: Model chart A: volume expansion pushes RVOL above 1× and price follows with a decisive move.
Model Chart B: Low RVOL
Here volume stays below its normal all day, so RVOL never gets above 1×. The price wanders between roughly the same levels: the classic trade that neither hits the stop-loss nor the target.
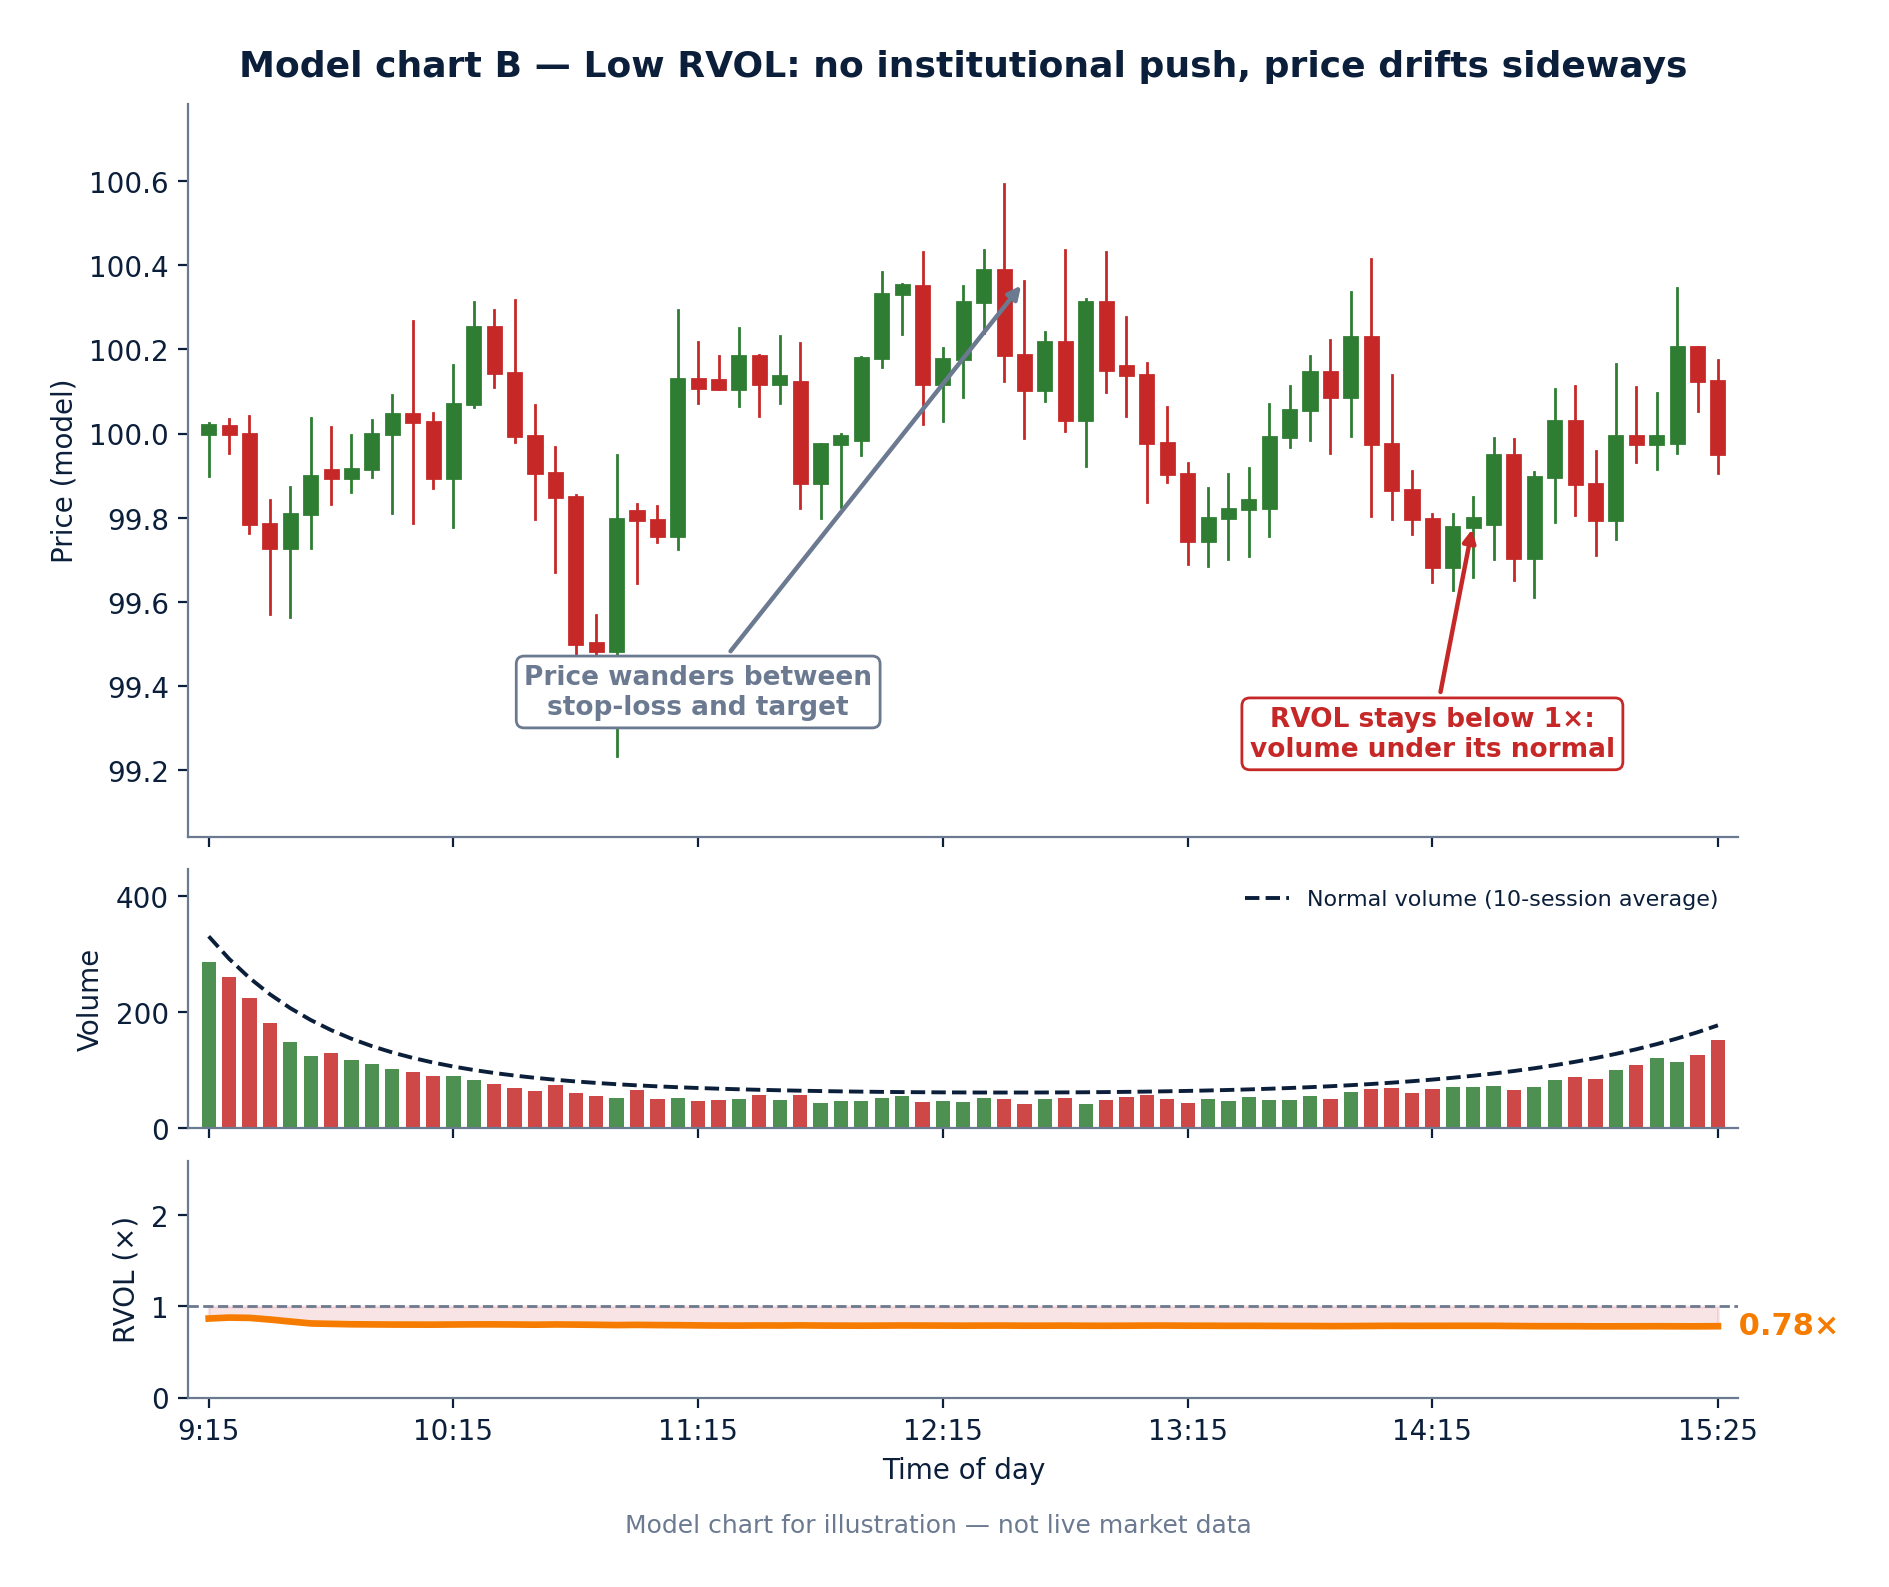
Figure 17: Model chart B: volume stays under normal, RVOL stays below 1×, and price goes nowhere.
| High RVOL | Low RVOL | |
|---|---|---|
| Volume vs normal | Above normal | Below normal |
| Institutional activity | Likely present | Likely absent |
| Typical price behaviour | Decisive, one-sided move | Sideways drift |
| Suitability for trading today | Add to the watchlist | Skip for now |
Using RVOL in Your Trading Workflow
RVOL is best thought of as a stock-selection tool. It does not tell you when to buy or sell. It tells you which stocks deserve your attention today, meaning the ones where a move is more likely. To put it to work:
- Scan the Nifty 50 (or your list) at your chosen time.
- Rank the results by RVOL.
- Shortlist the top four or five stocks and keep them in your watchlist.
- Wait for your own entry condition on those stocks. It can be price action, a trend, or any rule you already use.
- Take positions only in the shortlisted stocks when your condition triggers.
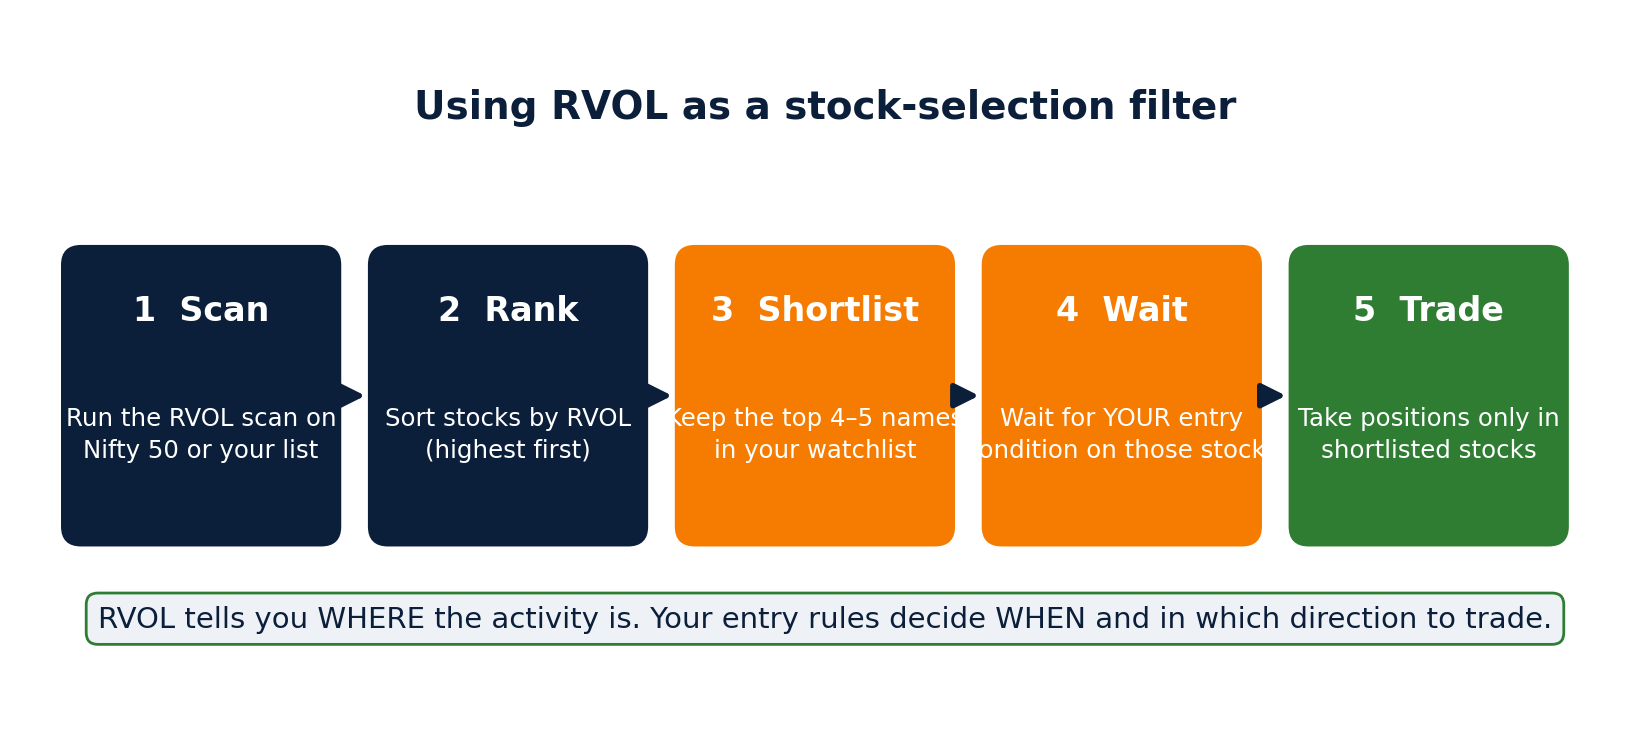
Figure 18: RVOL narrows the field; your entry rules decide when to trade.
Here is how that plays out on a shortlisted stock:
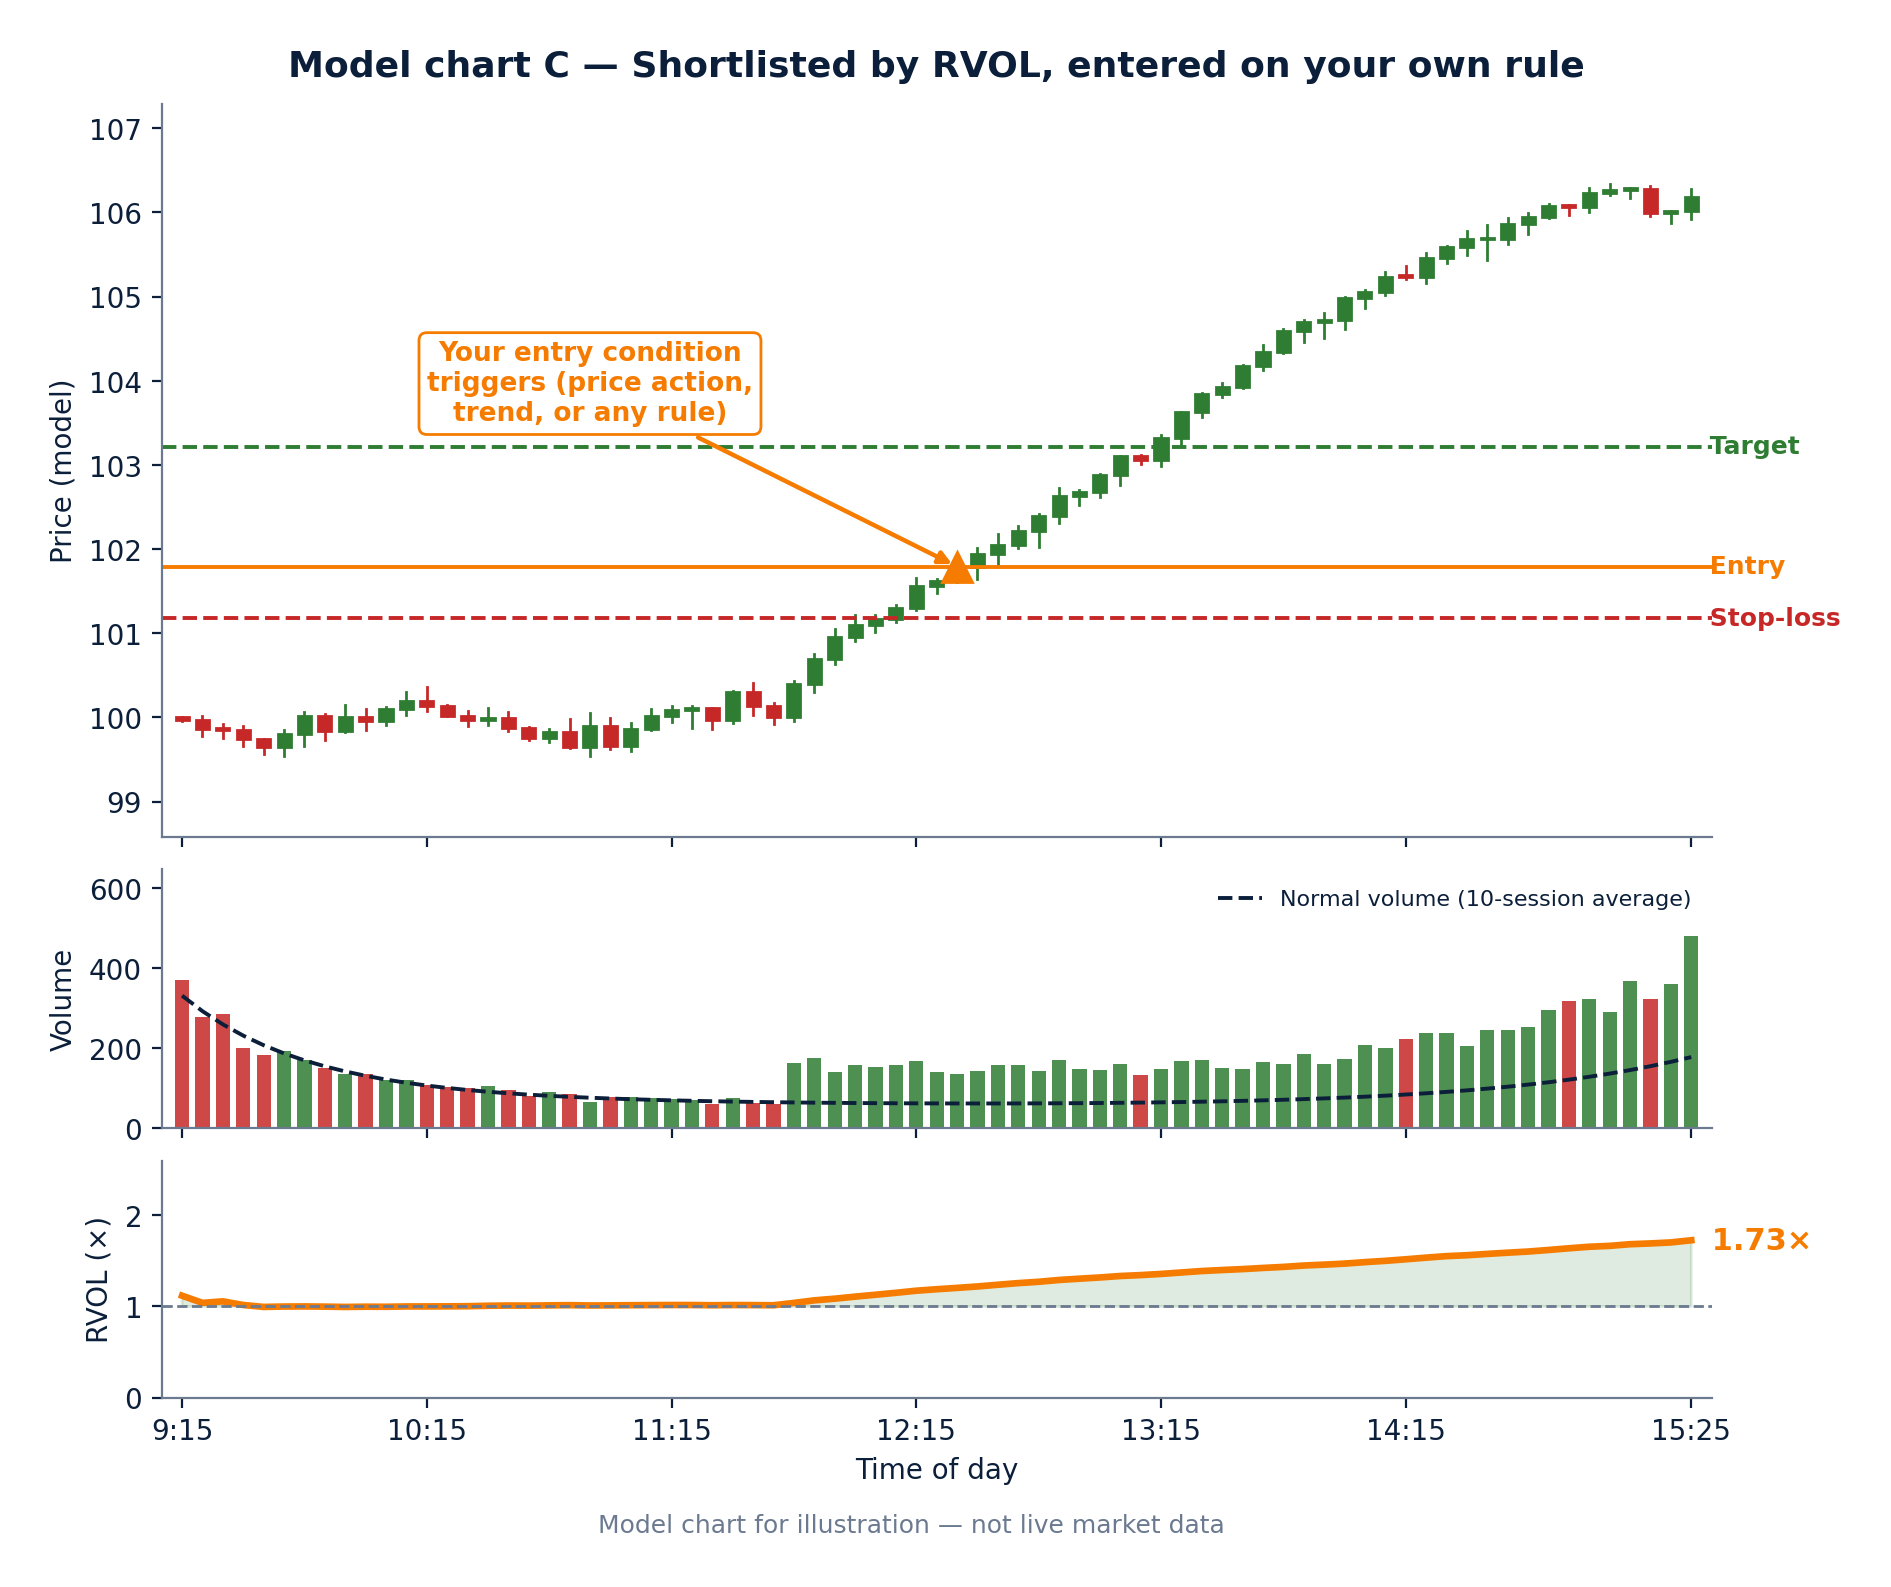
Figure 19: Model chart C: a stock shortlisted by RVOL, entered when the trader’s own condition triggers, with stop-loss and target marked.
A high RVOL says institutions are active. It does not say whether they are buying or selling. Use your own entry conditions and the price chart to decide direction, and always trade with a stop-loss.
Key Takeaways
- Timing matters most, and the best timing is when institutions are active.
- Raw volume cannot identify institutions. Each stock must be compared with its own normal.
- Volume follows a “U” shape through the day, so RVOL compares volume at the same time of day.
- RVOL = today’s volume so far ÷ the 10-session normal for this time of day.
- The RVOL Scanner ranks Nifty 50 stocks by RVOL using the Dhan API, so you can build a daily shortlist in seconds.
- Use RVOL to choose where to trade, and your own entry rules to decide when.
Resources
- YouTube video: Watch the RVOL tutorial
- Download (Google Drive): RVOL Scanner package
- RVOL Scanner Exe: the ready-to-run Windows application, including
RVOLScanner,config.json,INSTALLandREADME - RVOL Scanner Source Code Files: the complete source code of the scanner, for anyone who wants to study or customise it