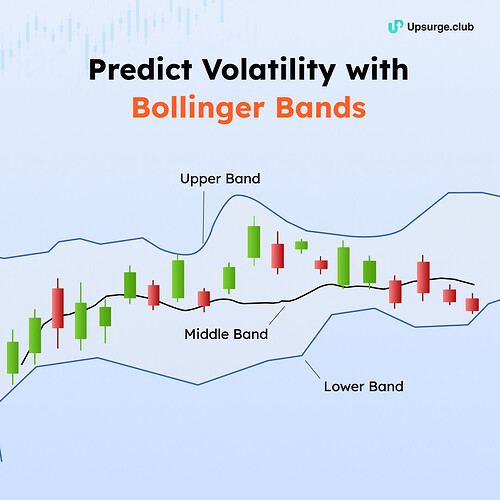
![]() The Bollinger Band is a lagging indicator used to determine price volatility. It consists of 3 bands - the middle band (20-days SMA), and the upper and lower bands, which are ± 2 standard deviations from the middle band.
The Bollinger Band is a lagging indicator used to determine price volatility. It consists of 3 bands - the middle band (20-days SMA), and the upper and lower bands, which are ± 2 standard deviations from the middle band.
![]() Learn how to use this indicator to spot winning trades in our latest newsletter issue
Learn how to use this indicator to spot winning trades in our latest newsletter issue ![]()
Join 2100+ people getting such strategies delivered to their inbox daily by signing up for Upsurge’s Newsletter: Subscribe to Upsurge's Newsletter
