![]() What is the 200 DMA?
What is the 200 DMA?
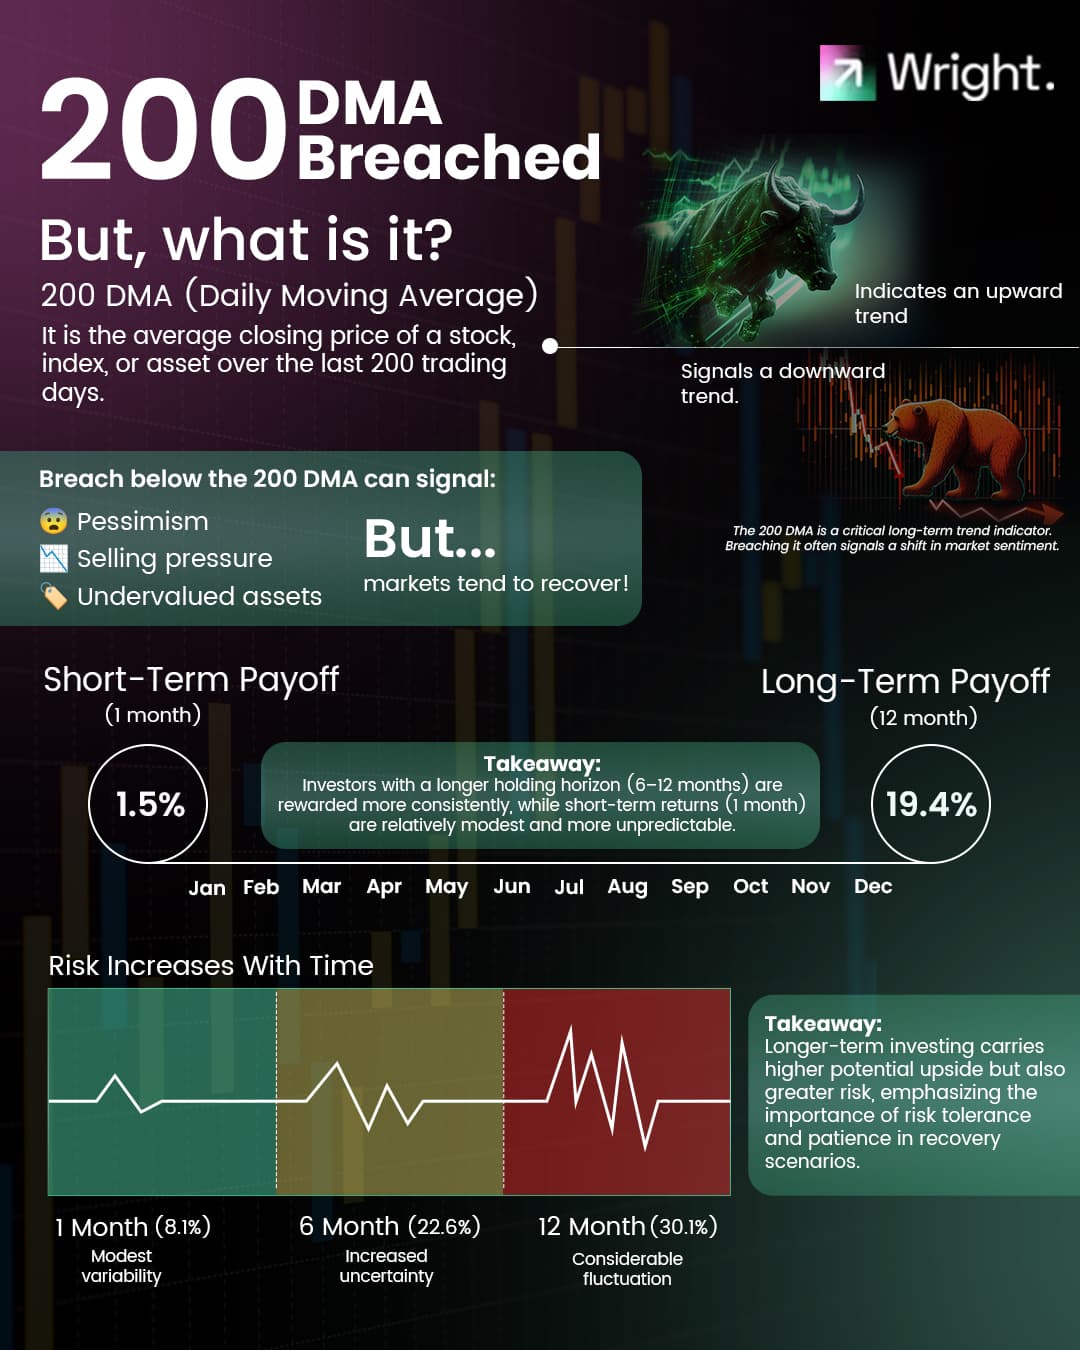
200 DMA (Daily Moving Average) is the average closing price of a stock, index, or asset over the last 200 trading days.
Above 200 DMA = Bullish trend ![]()
Below 200 DMA = Bearish trend ![]()
![]() Why is the 200 DMA Breach Important?
Why is the 200 DMA Breach Important?
A break below 200 DMA often signals market pessimism, leading to potential undervaluation.
Recovery aligns with mean-reversion, where markets return to long-term growth trends.
![]() Short-Term vs. Long-Term Payoff
Short-Term vs. Long-Term Payoff
Short-term (1 Month): Returns = 1.5% (modest, unpredictable).
Long-term (12 Months): Returns = 19.4% (more consistent recovery).
![]() Takeaway: Longer holding periods (6-12 months) reward patient investors.
Takeaway: Longer holding periods (6-12 months) reward patient investors.
![]() Risk vs. Reward
Risk vs. Reward
Risk grows with time, but so do potential returns:
1 Month: Max return = 35.4% ![]()
12 Months: Max return = 104.4% ![]()
Takeaway: Be ready for volatility but trust long-term growth.
![]() High Probability of Positive Returns
High Probability of Positive Returns
Positive return probability rises from 60.4% (1 Month) to 70.2% (12 Months).
![]() History favors patience: Nearly 3 in 4 chances of earning positive returns over a year!
History favors patience: Nearly 3 in 4 chances of earning positive returns over a year!
After a 200 DMA breach, holding for 6–12 months historically pays off. Prepare for volatility, but let time and patience work in your favor.