Hi @Everyone,
A beginner-friendly guide to understanding volatility, why it moves options P&L, and how to use India VIX to time your trades
Introduction
If you trade options — or even stocks, there’s a number quietly sitting on your dashboard that has more influence over your profit and loss than most traders realise: India VIX. Most traders think option P&L works in a simple, one-dimensional way — buy a call, and if Nifty goes up, you make money. That’s true, but it’s only part of the picture.
Option premiums aren’t driven by direction alone. They’re driven by three forces working together:
- Direction — did the market move the way you expected?
- Time — how much time is left until expiry?
- Volatility — how much is the market expected to move, which is exactly what India VIX measures.
Get the direction right but ignore volatility, and your P&L can still disappoint you. This blog breaks down the three most important things every algo trader should understand about India VIX, with practical examples you can apply directly to your own strategy.
1. India VIX Tells You How Much Nifty Can Move in a Year
The first and most fundamental thing India VIX tells you is the market’s own expectation of how far Nifty can travel over the next 12 months. Think of it as the market pricing in its own uncertainty.
On Dhan’s Dex terminal, when India VIX is trading around 17, it is telling you something very specific: Nifty could move up to 17% in either direction over the next year, based on what options are currently pricing in.
NOTE India VIX is expressed as an annualised percentage. A VIX value of 17 means the market expects roughly a ±17% move in Nifty over the coming year — not per month or per week.
Applying this to a real number makes it concrete. If Nifty is trading around 24,350 and India VIX is at 17:
| Scenario | Calculation | Approximate Level |
|---|---|---|
| Upside boundary | 24,350 × (1 + 17%) | ≈ 28,500 |
| Downside boundary | 24,350 × (1 − 17%) | ≈ 20,200 |
India VIX at 17 implies Nifty could trade anywhere between roughly 20,200 and 28,500 over the next year
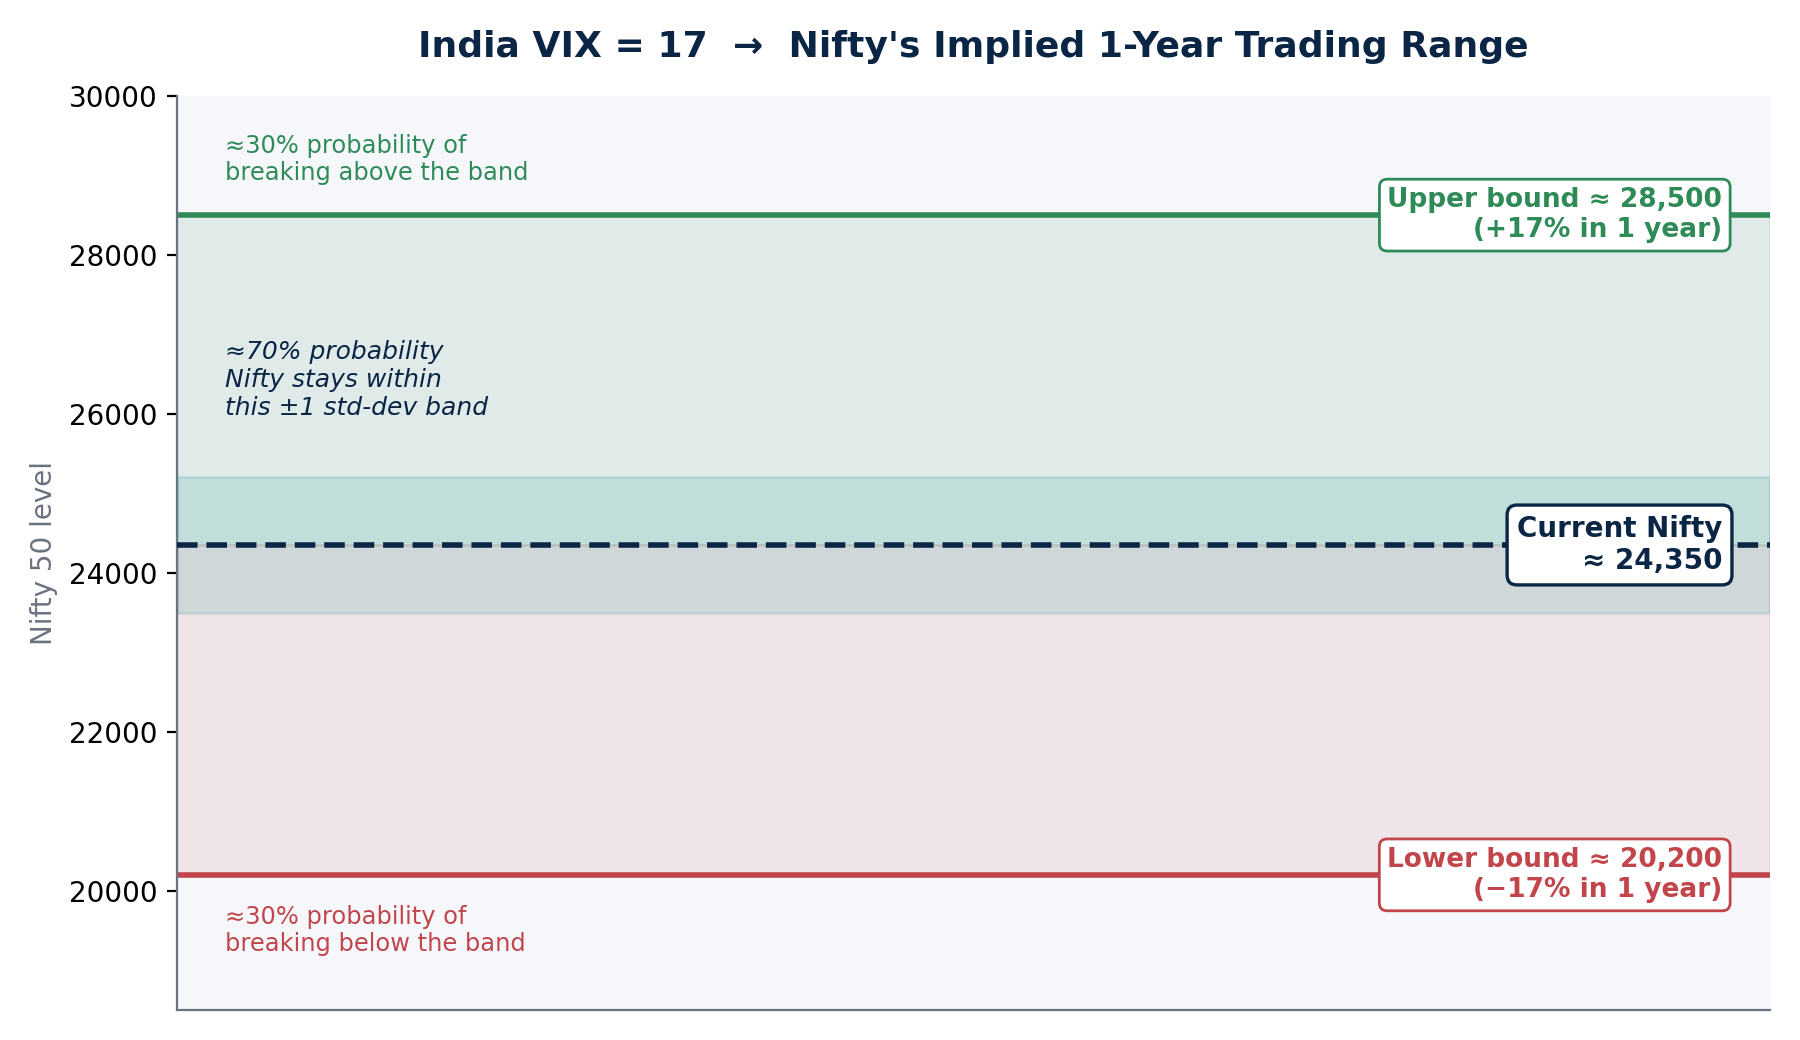
Figure 1: India VIX at 17 implies Nifty could trade anywhere between roughly 20,200 and 28,500 over the next year.
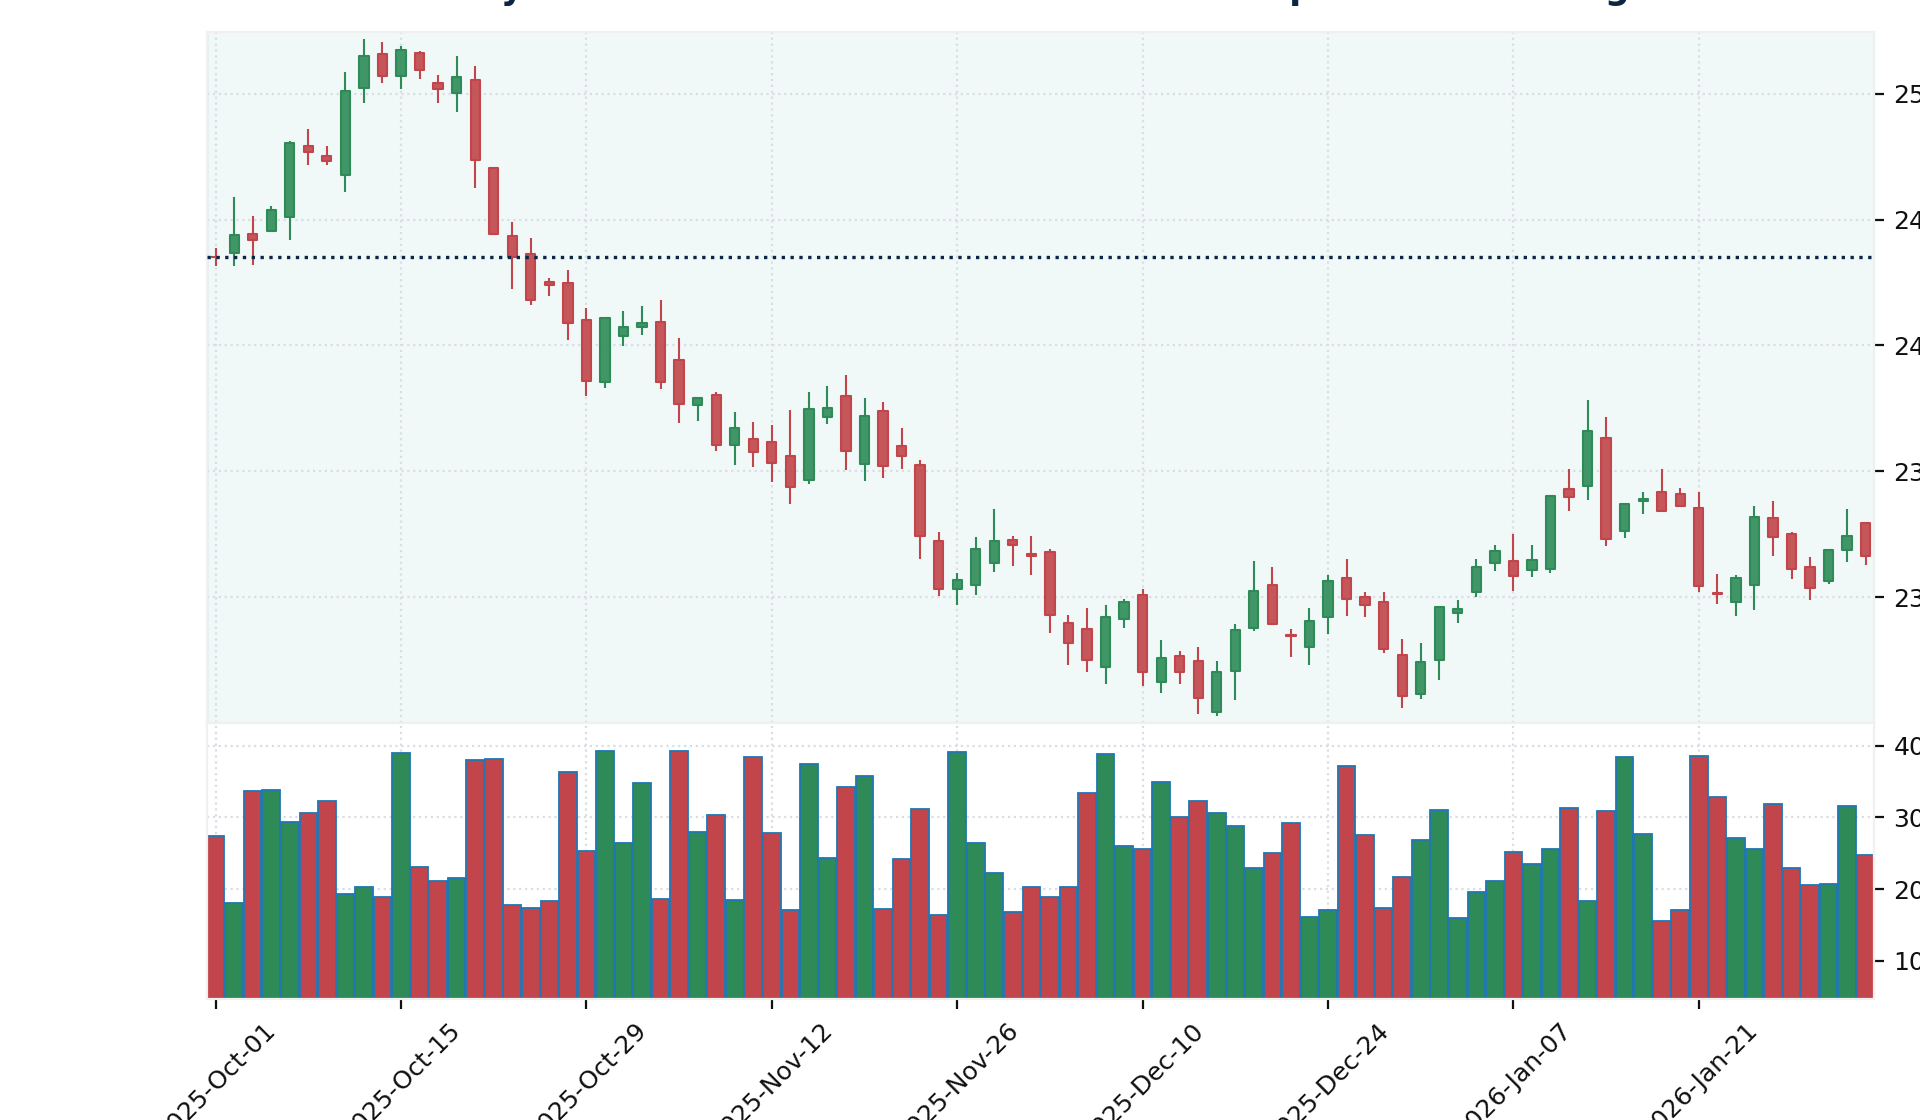
Figure 1B: A realtime-style Nifty candlestick chart with the India VIX-implied upper and lower range bands overlaid, so you can see how price action sits inside that expected range.
This range isn’t a guarantee, though — it comes with a probability attached. Statistically, there’s close to a 70% chance that Nifty stays within this band (what’s called the first standard deviation range). That still leaves real possibilities outside it:
- ≈30% chance Nifty breaks above the upper boundary (≈28,500) at some point.
- ≈30% chance Nifty breaks below the lower boundary (≈20,200) at some point.
In short: India VIX gives you the market’s own forecast of its trading range, along with a rough sense of how confident that forecast is. For an algo trader, that’s incredibly useful context when setting strike prices, stop-losses, or position sizing — you’re no longer guessing at the range; the market is telling you.
2. India VIX Is a Leading Indicator — Not a Lagging One
Most of the indicators algo traders rely on every day — Supertrend, RSI, MACD — are lagging indicators. They’re built entirely from historical price data. Supertrend tells you what has already happened up to this candle. RSI reflects momentum that has already played out. You’re using old information to make decisions about the future.
India VIX works differently. It is a leading indicator — it reflects what the market expects to happen next, not what has already happened.
Lagging indicators look backward at historical price action; India VIX is derived from live options pricing and looks forward
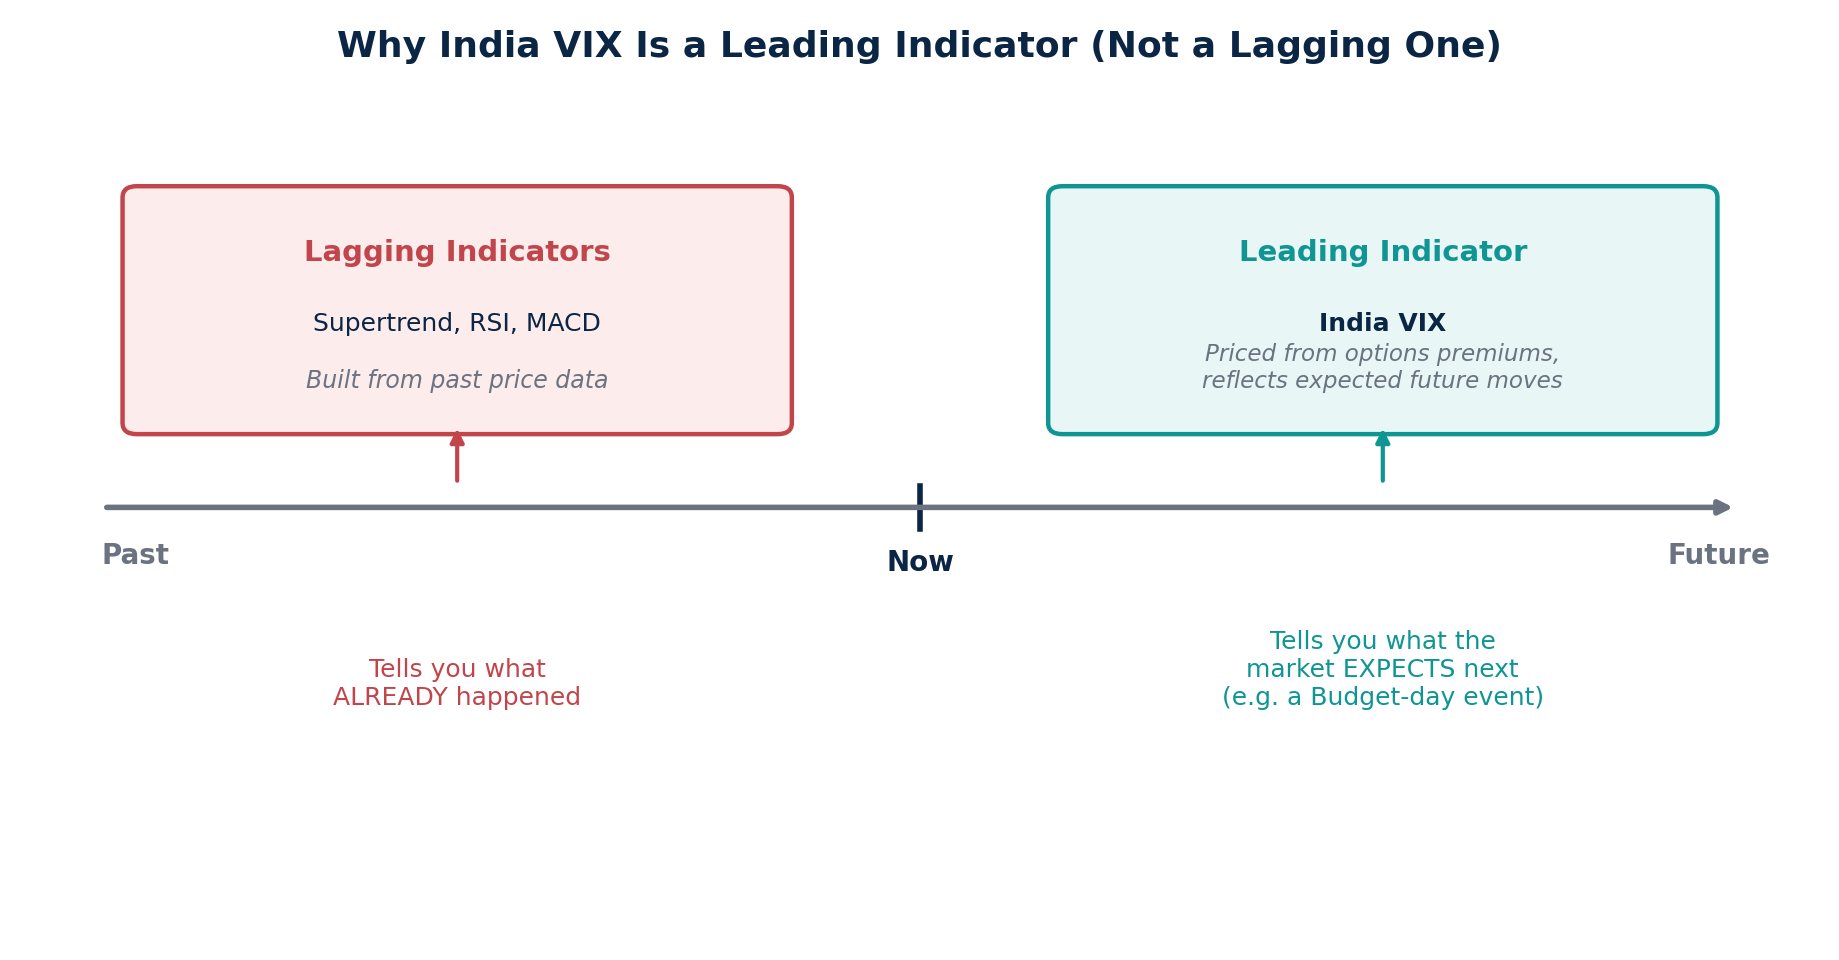
Figure 2: Lagging indicators look backward at historical price action; India VIX is derived from live options pricing and looks forward.
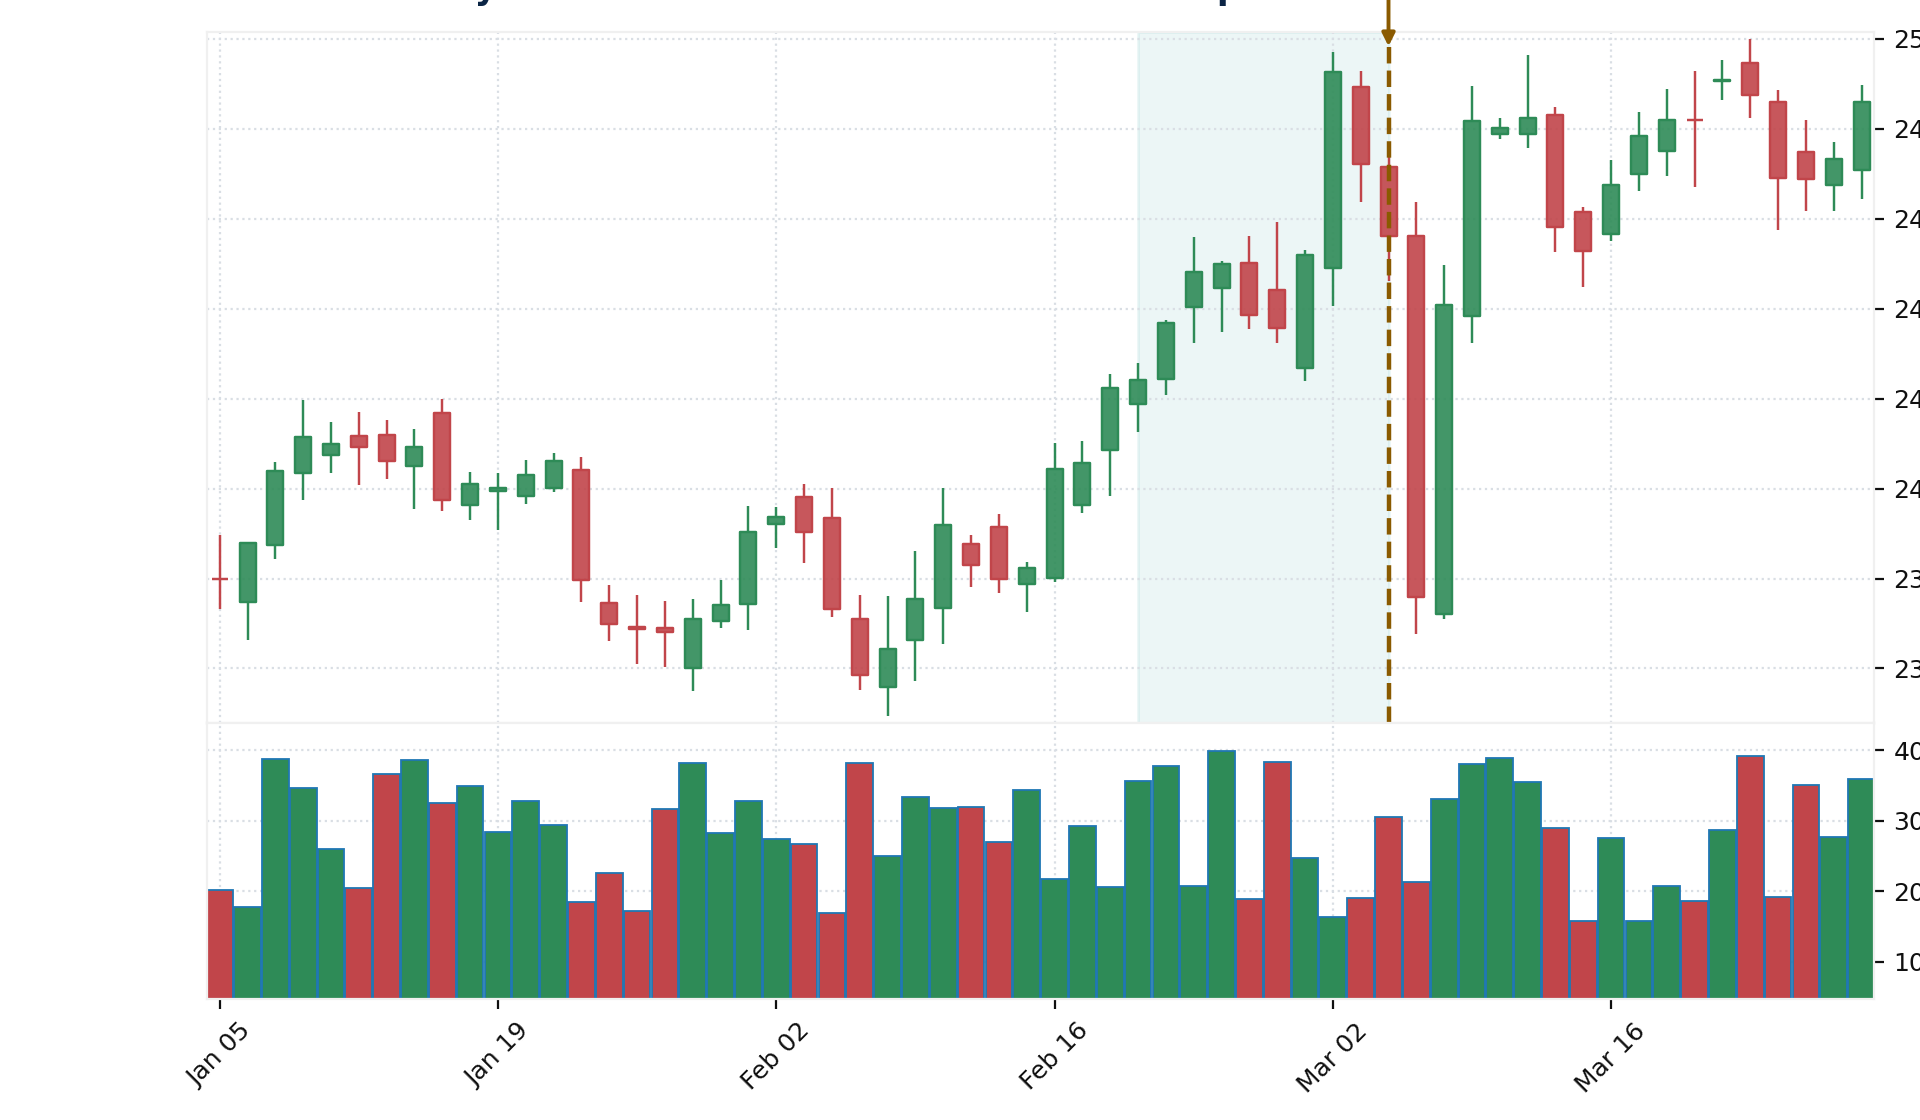
Figure 2B: A realtime-style Nifty candlestick chart showing how price action and volume can build up in the sessions leading into a known event such as Budget Day, before the actual event-day move.
Why Can India VIX ‘See’ the Future?
The answer lies in how it’s calculated. India VIX is derived directly from the premiums of Nifty options — specifically, how expensive or cheap those premiums are right now. And option premiums are extremely sensitive to upcoming uncertainty.
Consider a real example: if a major corporate announcement or a Union Budget date is approaching, option premiums start getting more expensive — and this doesn’t happen suddenly on the day of the event. It happens well in advance.
WHY THIS HAPPENS In the days leading up to a Budget or a big event, every trader knows the market could swing sharply. Anyone selling options in that window knows they’re taking on extra risk, so they demand a higher premium to compensate. That collective repricing — happening before the event, not after — is exactly what pushes India VIX higher.
Because India VIX is built from these forward-looking option prices, it effectively absorbs the market’s collective expectation of upcoming risk — before that risk actually shows up in the price chart. That’s what makes it a leading indicator, and why it deserves a place in your pre-trade checklist alongside your usual technical indicators.
3. India VIX Is the Market’s Fear Gauge
The third key idea is that India VIX effectively measures fear in the market. When India VIX rises, it means participants are becoming more fearful and uncertain about what’s coming next.
A useful real-world example: during periods of sudden geopolitical stress — like an unexpected war-related headline — Nifty tends to fall sharply, and in that exact window, India VIX rises. That’s not a coincidence; it’s the defining relationship between the two.
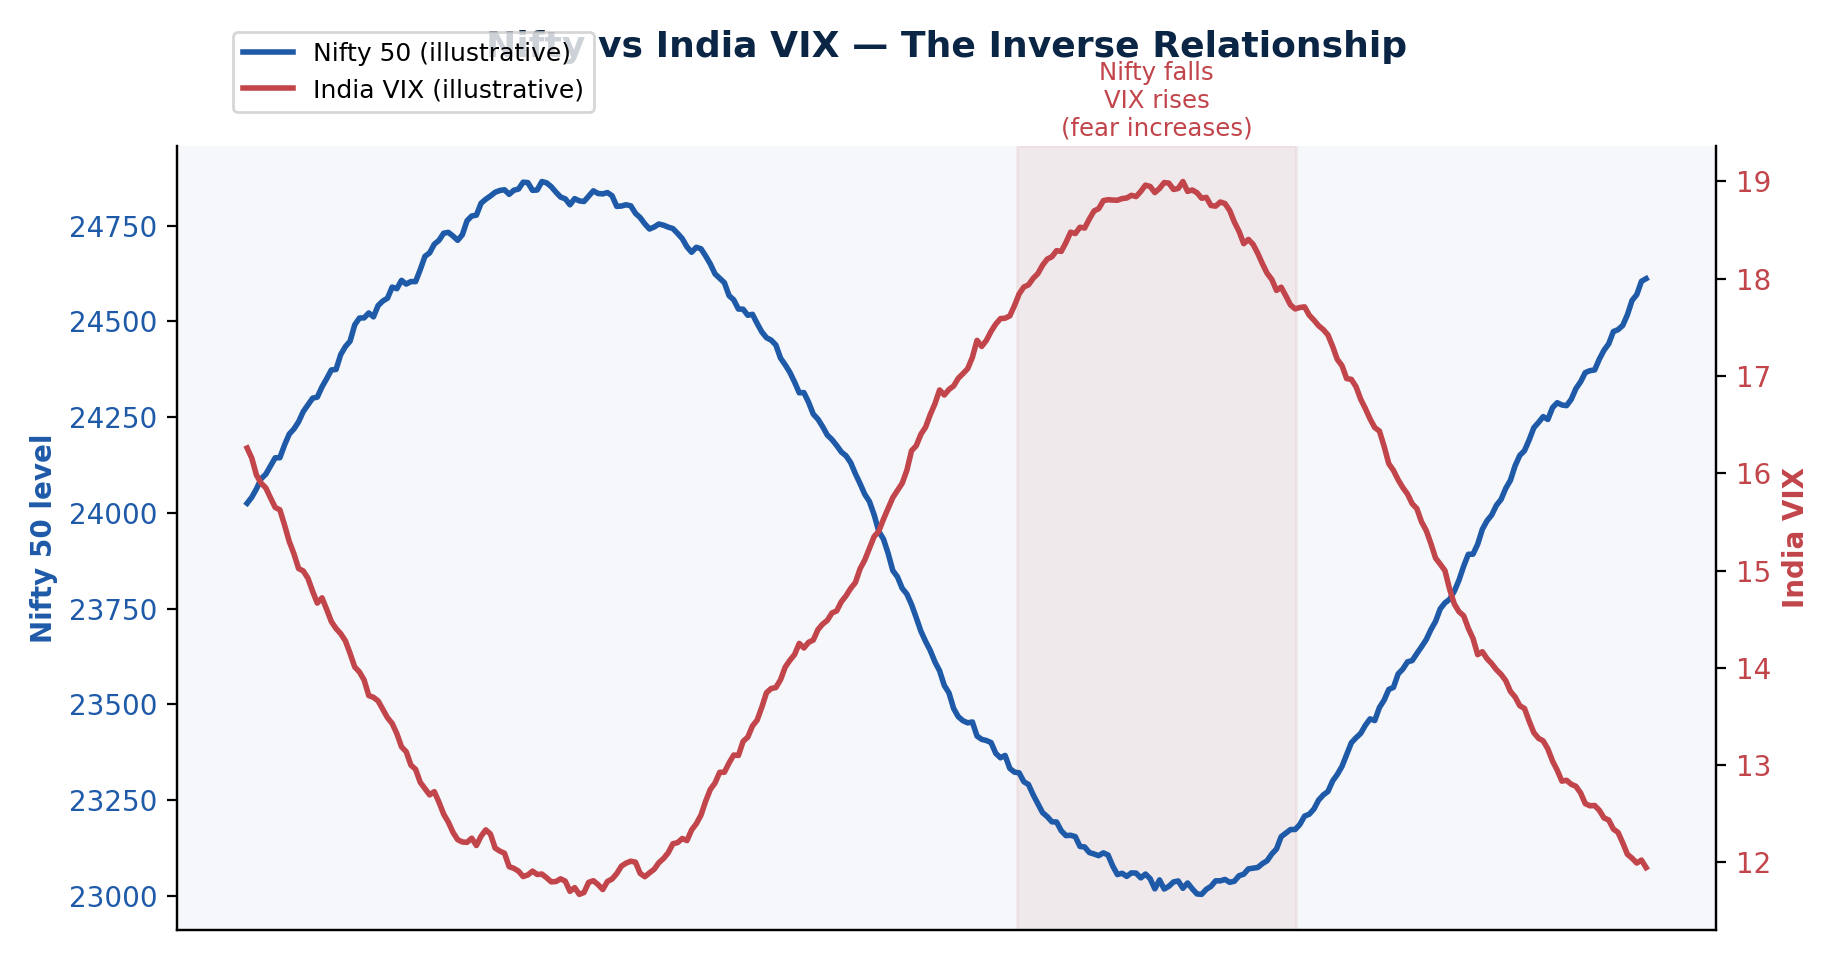
Figure 3: India VIX and Nifty typically move in opposite directions — VIX rises when Nifty falls, and eases when Nifty is calm or rising.
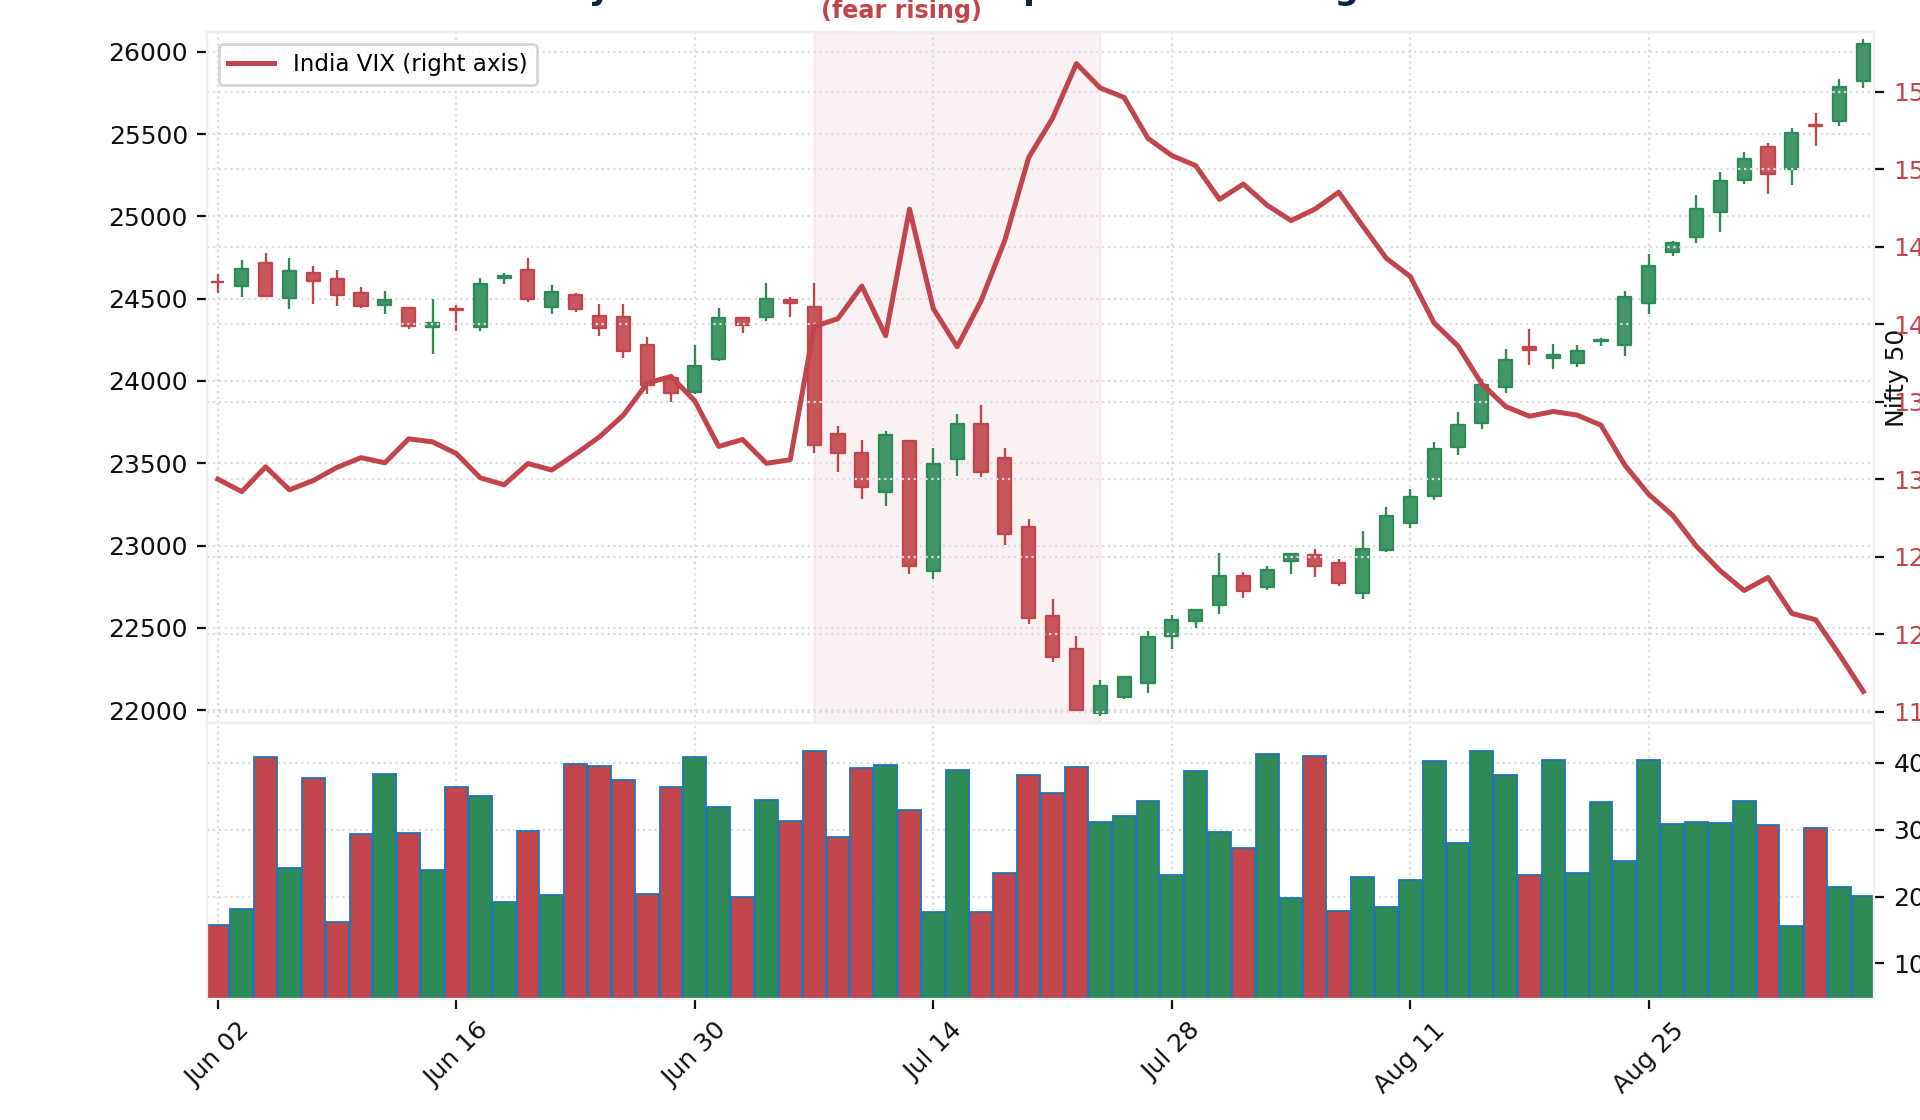
Figure 3B: A realtime-style Nifty candlestick chart during a sharp selloff, with India VIX (right axis) spiking as fear enters the market.
This gives you a simple, dependable rule of thumb:
- India VIX rising → fear is increasing → Nifty is more likely falling.
- India VIX falling → confidence is returning → Nifty is stable or rising.
The relationship is inversely correlated — when one goes up, the other tends to go down, and vice versa.
Why Rising Fear Means Expensive Options
There’s a practical consequence to this fear-gauge behaviour. When India VIX is elevated, option sellers know they’re taking on more risk, so they demand a higher premium before they’ll sell. This makes it a comparatively good time to sell options, and a comparatively expensive — and riskier — time to buy them.
ANALOGY Think of it like health insurance. A 60-year-old pays a much higher premium than a 25-year-old because the insurer is taking on more risk. In the same way, when India VIX (market risk) rises, option sellers price in extra risk and charge a higher premium — making that a less favourable window for buying options.
WARNING A high or rising India VIX doesn’t just mean “more risk” in the abstract — it directly inflates the premium you’ll pay to buy options. Entering large option-buying positions during VIX spikes can quietly erode your edge even if your directional view turns out correct.
Putting It Into Practice: Timing Option Buying vs Selling
Once you understand these three ideas, you can use India VIX as a practical, rules-based filter for deciding whether the current environment favours buying options or selling them. One simple way to do this — the same approach used on Dhan’s Dex terminal — is to apply a trend-following overlay, such as Supertrend, directly onto the India VIX chart itself, rather than onto Nifty.
- Open the India VIX chart on your terminal (for example, Dhan’s Dex terminal).
- Apply a Supertrend indicator on the India VIX chart.
- When India VIX is falling and trading below the Supertrend line, that zone favours option buying.
- When India VIX is rising and trading above the Supertrend line, that zone favours option selling.
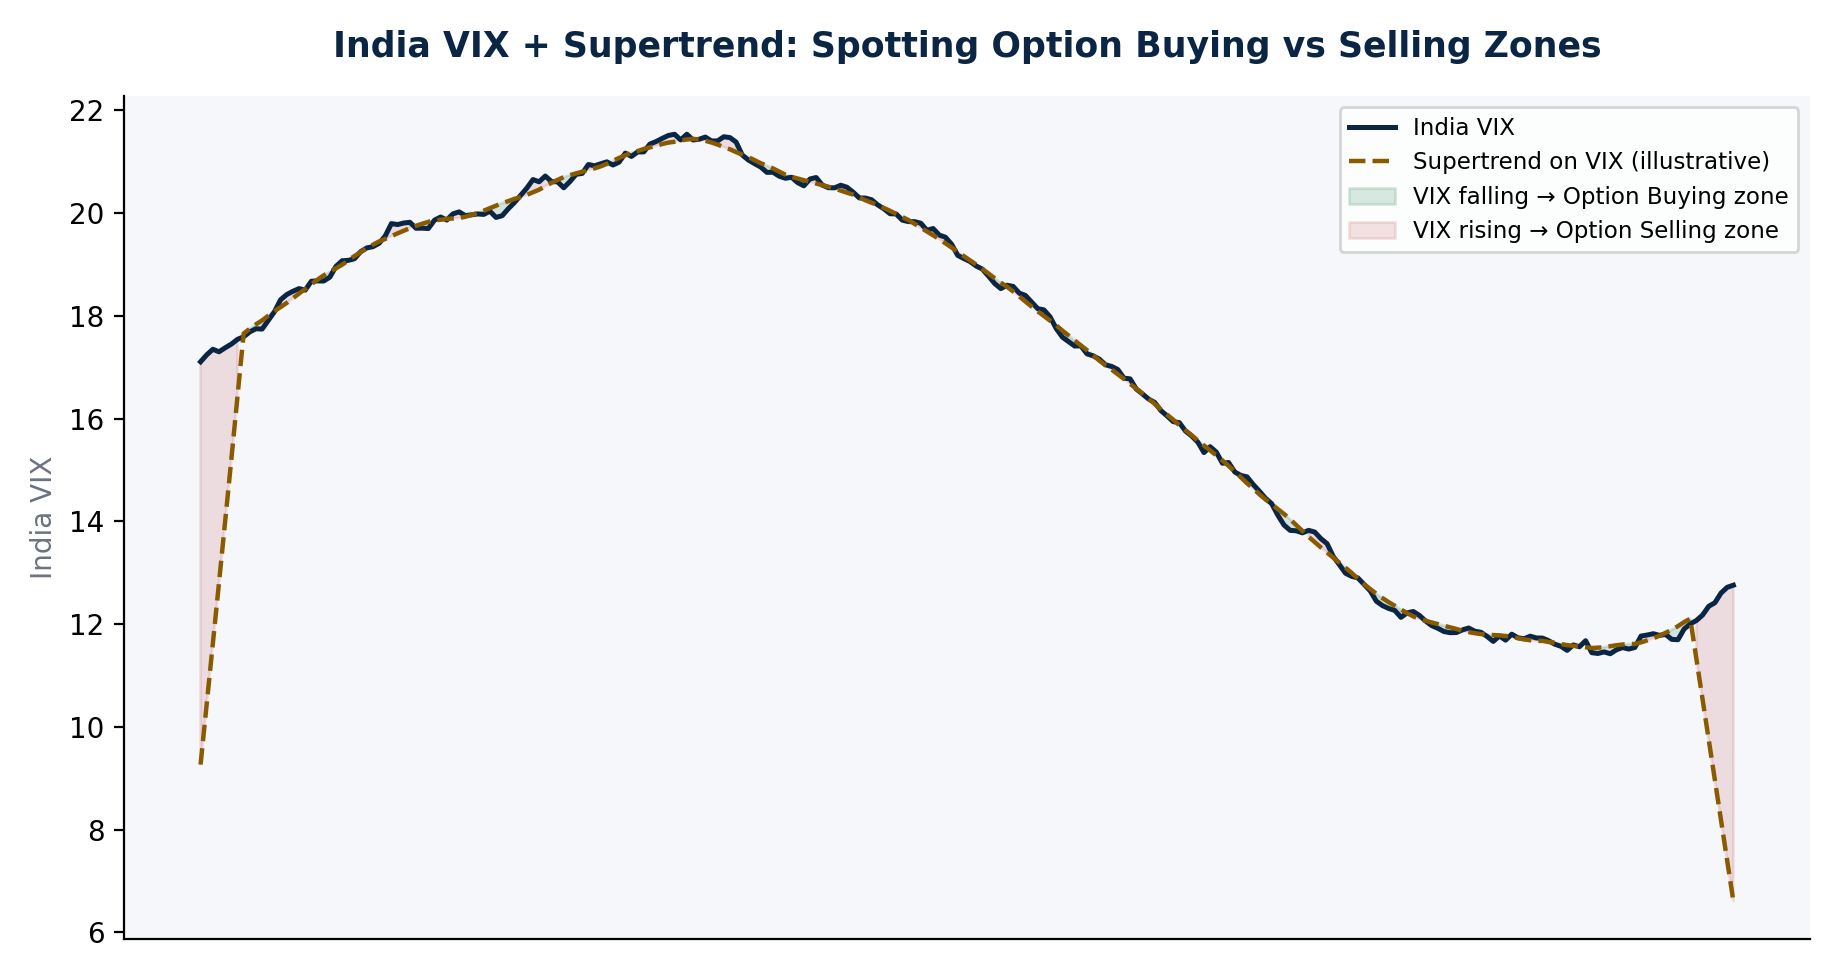
Figure 4: A Supertrend overlay on the India VIX chart helps visually separate option-buying zones (falling VIX) from option-selling zones (rising VIX).
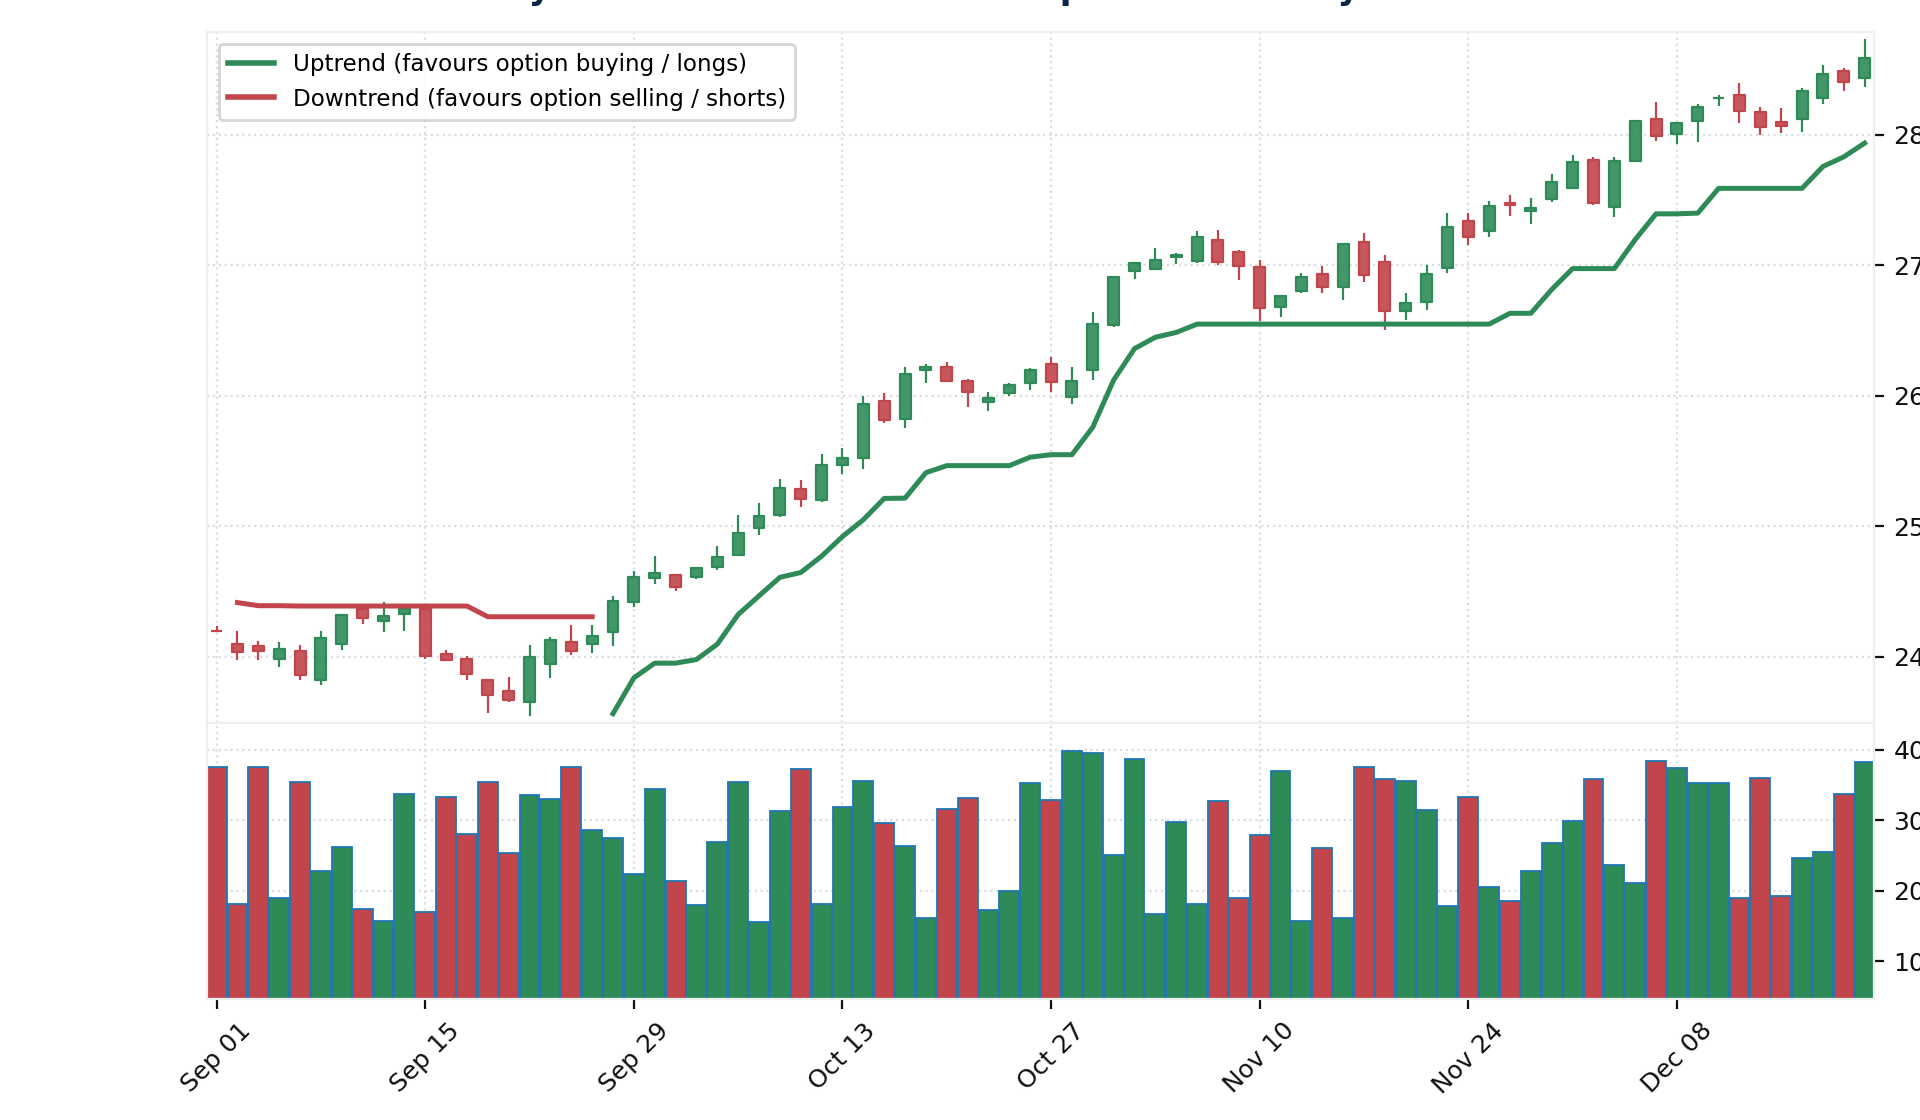
Figure 4B: The same idea applied directly to a realtime-style Nifty candlestick chart — green Supertrend segments mark uptrend zones that favour option buying/longs, red segments mark downtrend zones that favour option selling/shorts.
TIP This isn’t a standalone trading signal — treat it as one more filter alongside your existing direction and momentum analysis. Its real value is helping you avoid buying options right when volatility (and therefore premium cost) is peaking.
A Related Concept: Implied Volatility
If you found India VIX useful, it’s worth knowing there’s a more granular, option-specific version of the same idea called Implied Volatility (IV). Implied Volatility works on a very similar concept to India VIX, but it’s calculated per option contract and goes considerably deeper into how individual strikes are priced. It’s a more advanced topic on its own, worth a dedicated deep-dive once you’re comfortable with how India VIX behaves.
Summary
India VIX is far more than a background number on your trading dashboard — it’s a direct window into how the options market is pricing risk, uncertainty, and expected movement. Here’s a quick recap of the three things every algo trader should remember:
| # | What India VIX Tells You | Why It Matters |
|---|---|---|
| 1 | Nifty’s expected 1-year trading range | Helps set realistic strike prices, targets, and stop-losses |
| 2 | It’s a leading indicator, not a lagging one | Reflects forward-looking risk baked into option premiums, ahead of events like Budget day |
| 3 | It’s the market’s fear gauge | Rising VIX = rising fear = falling Nifty = pricier, riskier option buying |
Used alongside your existing technical setup, India VIX helps answer a question most indicators can’t: not just where the market might go, but how confident the market itself is in that move — and whether the current environment favours buying options or selling them.