How hedge funds answer three questions every trader asks, tested on real Indian market data
Introduction
Every trader eventually runs into the same three questions:
- Why do option sellers seem to win more often than option buyers?
- My strategy has several rules. Which of them actually make it work?
- Is the market calm right now, or is it about to turn volatile?
Quant desks at hedge funds and banks already have well-established answers to all three. In this guide, we walk through each answer step by step, using real data from the Dhan API: Nifty daily candles, India VIX and a live Nifty option chain snapshot. No theory for its own sake, only what the data shows and how you can use it.
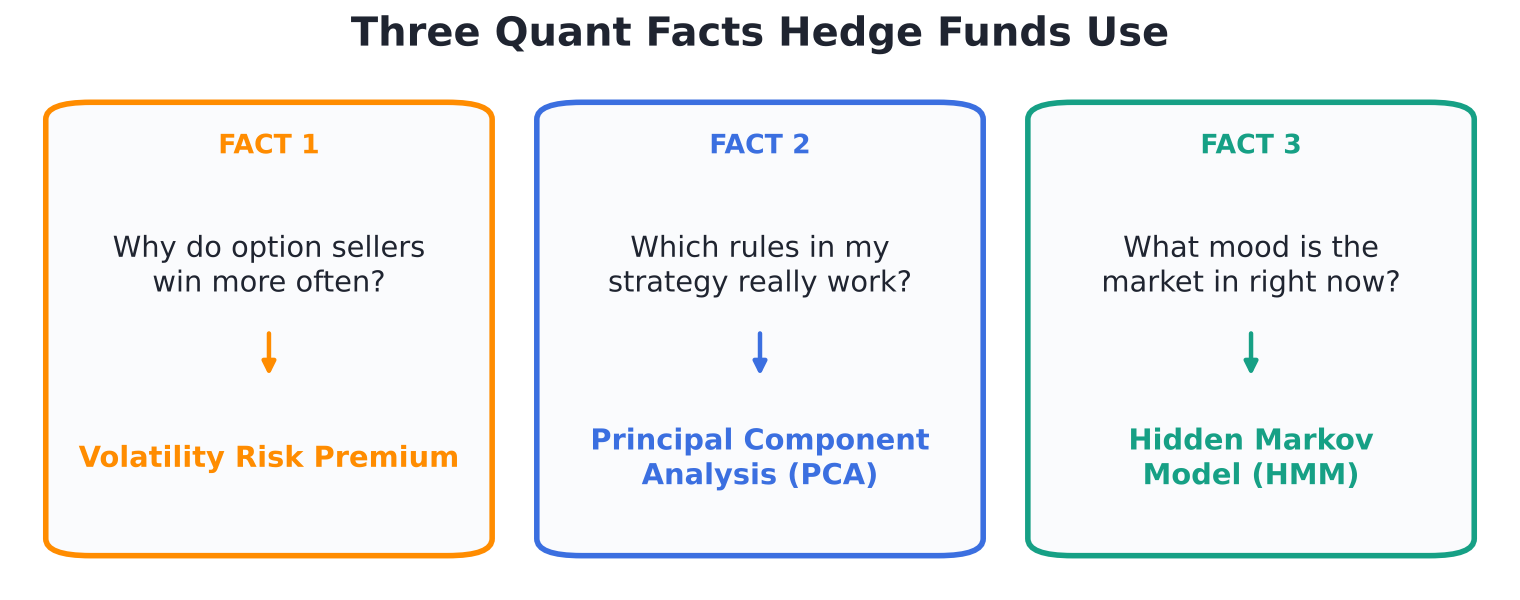
Figure 1: The three facts covered in this guide and the quant tool behind each one.
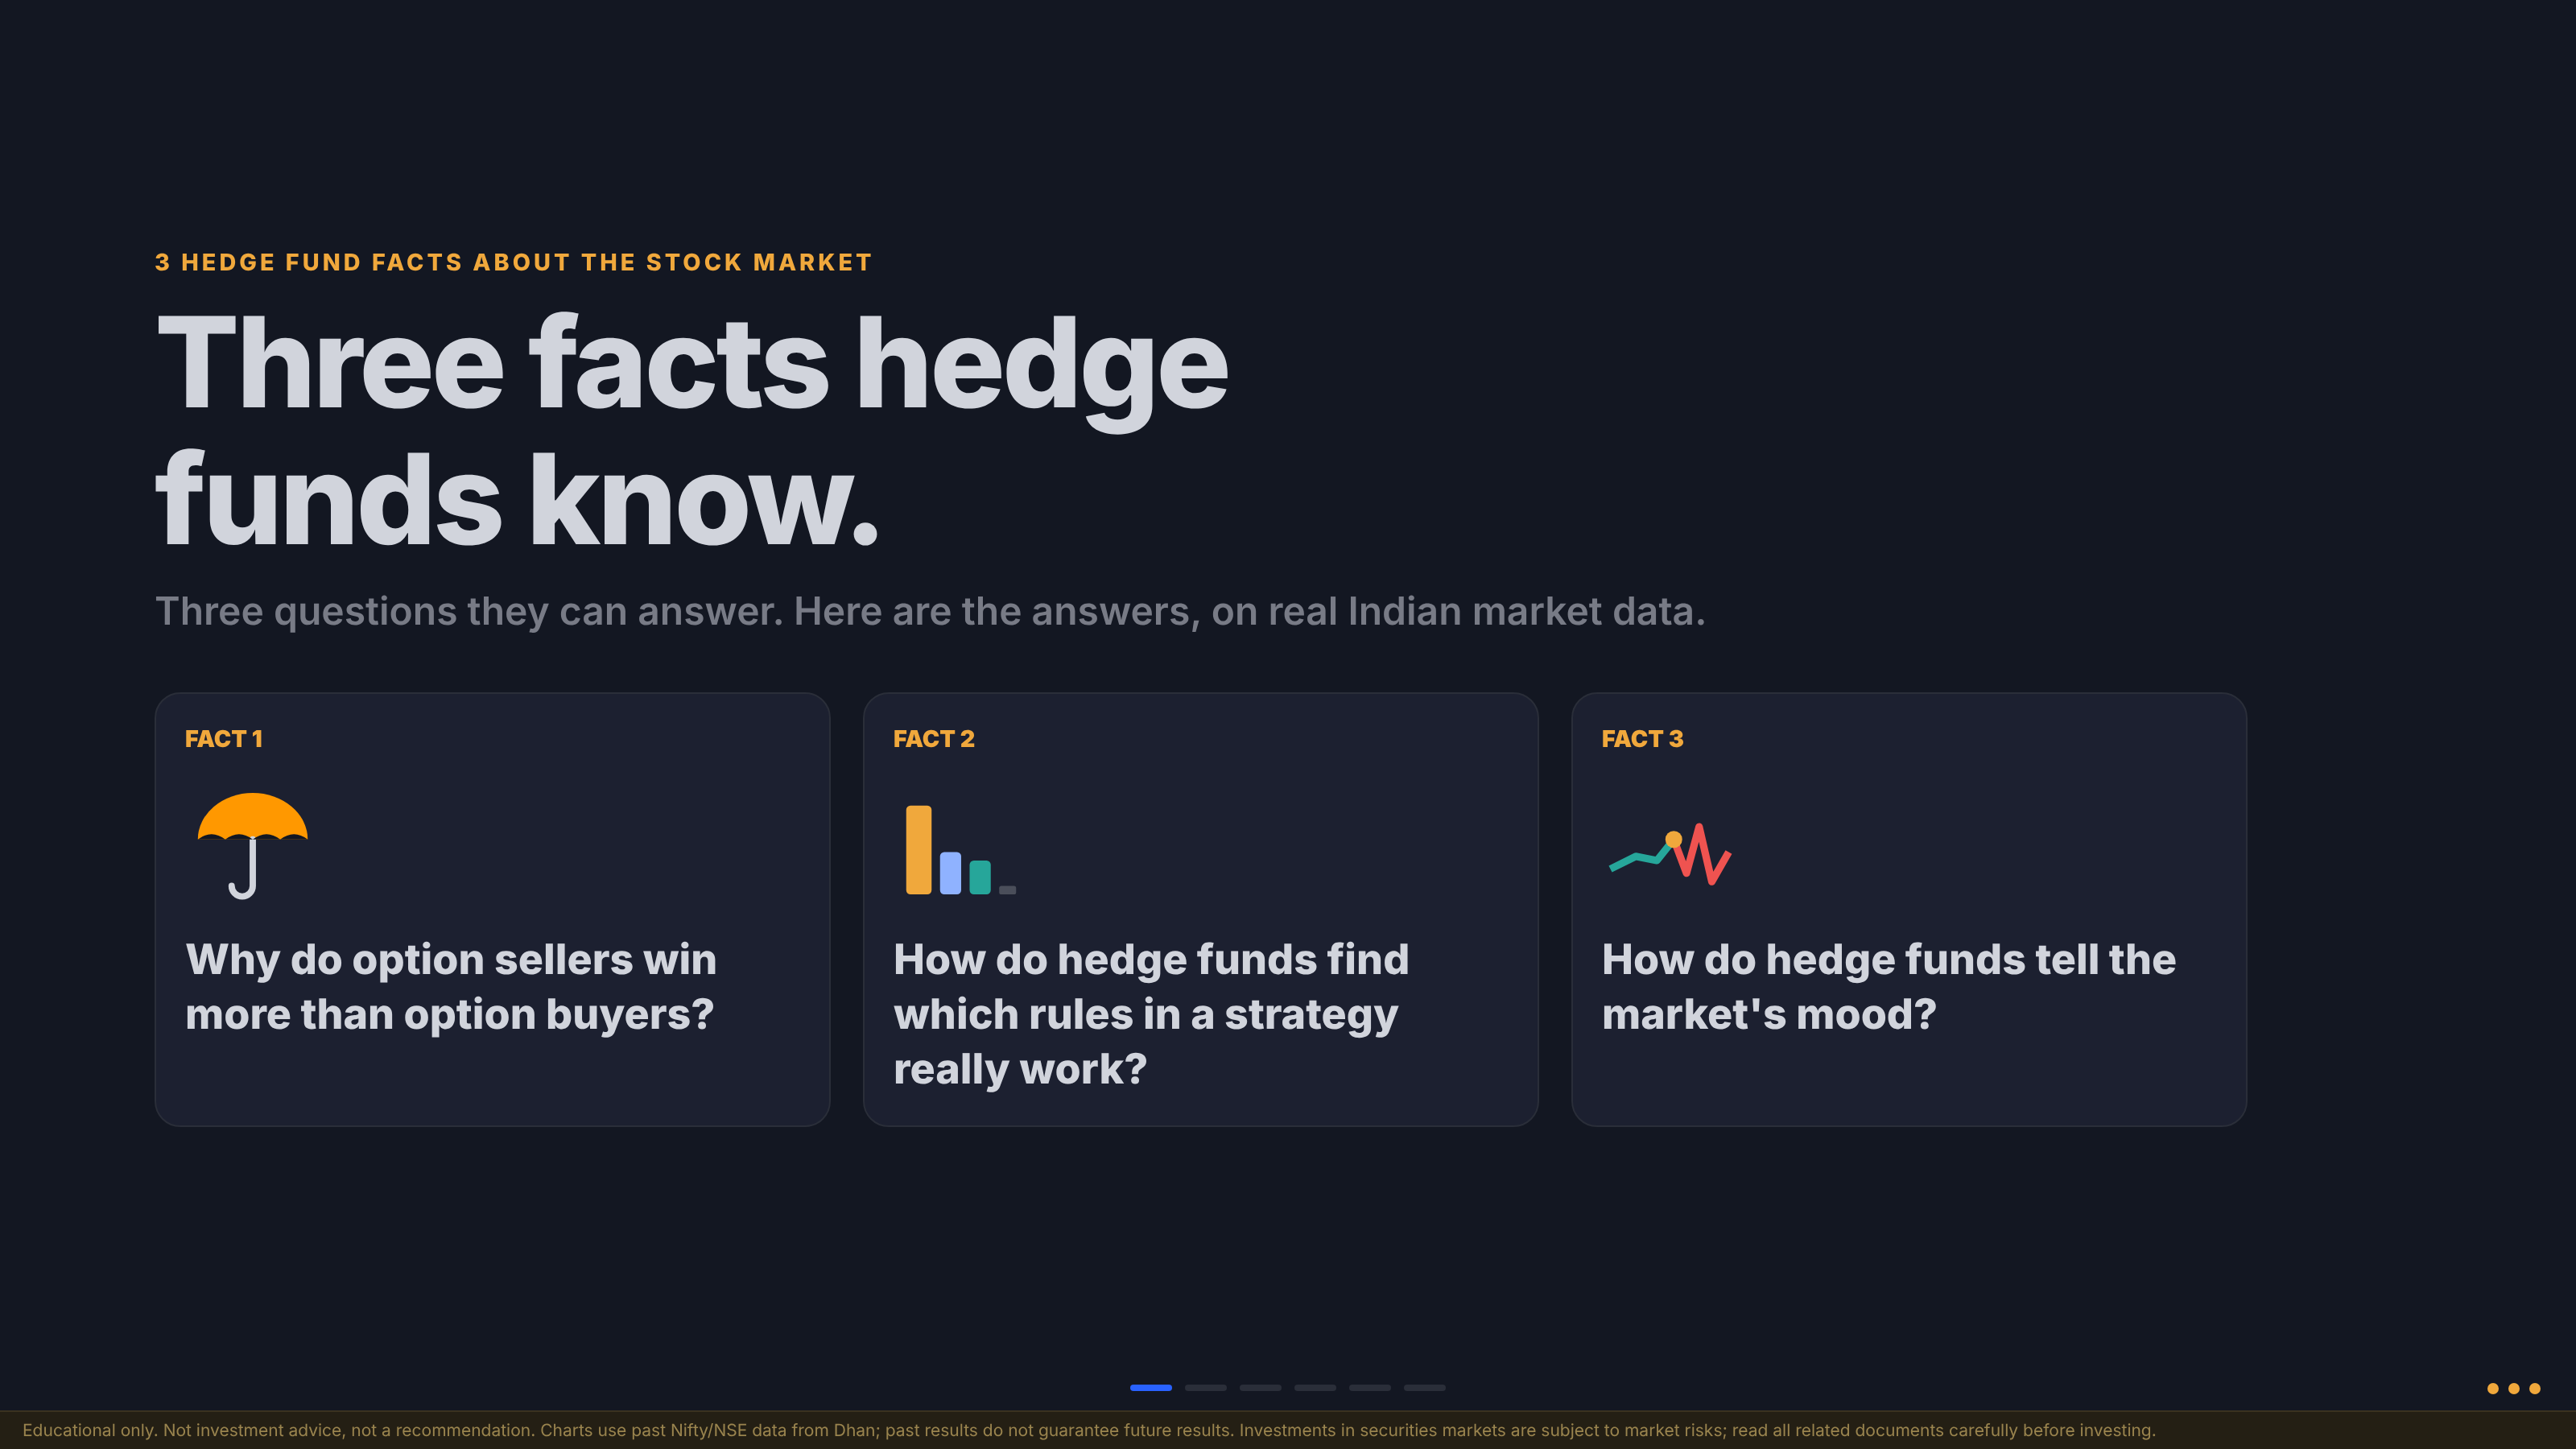
Slide 1: The opening slide of the video deck, posing the three questions.
| Fact | The question | The hedge fund tool |
|---|---|---|
| 1 | Why do option sellers win more often? | Volatility Risk Premium |
| 2 | Which rules in my strategy really work? | Principal Component Analysis (PCA) |
| 3 | What mood is the market in? | Hidden Markov Model (HMM) |
Note: This article is educational only. It is not investment advice or a recommendation. All charts use past Nifty/NSE data; past results do not guarantee future results.
Fact 1: Why Option Sellers Win More Often (The Volatility Risk Premium)
What an option price really is
An option’s price is essentially a bet on how far the market will move before expiry. The bigger the move the market expects, the more expensive the option.
The cleanest public measure of that expectation in India is India VIX: the move the market is pricing in for Nifty over the next month, expressed as an annualised percentage.
Think of the option seller as an insurance company
The easiest way to understand Fact 1 is through insurance.
- When a company sells you car insurance, health insurance or life insurance, it charges you more than the average claim it expects to pay out. It has to; it needs a margin to run its business.
- An option seller is in exactly the same position. When an option is sold to you, the seller charges a premium that includes their own margin, typically in the region of 18 to 20% above what the move is really worth.
That built-in margin has a name: the Volatility Risk Premium (VRP).
Tip: A simple way to remember it: every option you buy carries roughly 18% extra, like a second GST on top of the real price of the move.
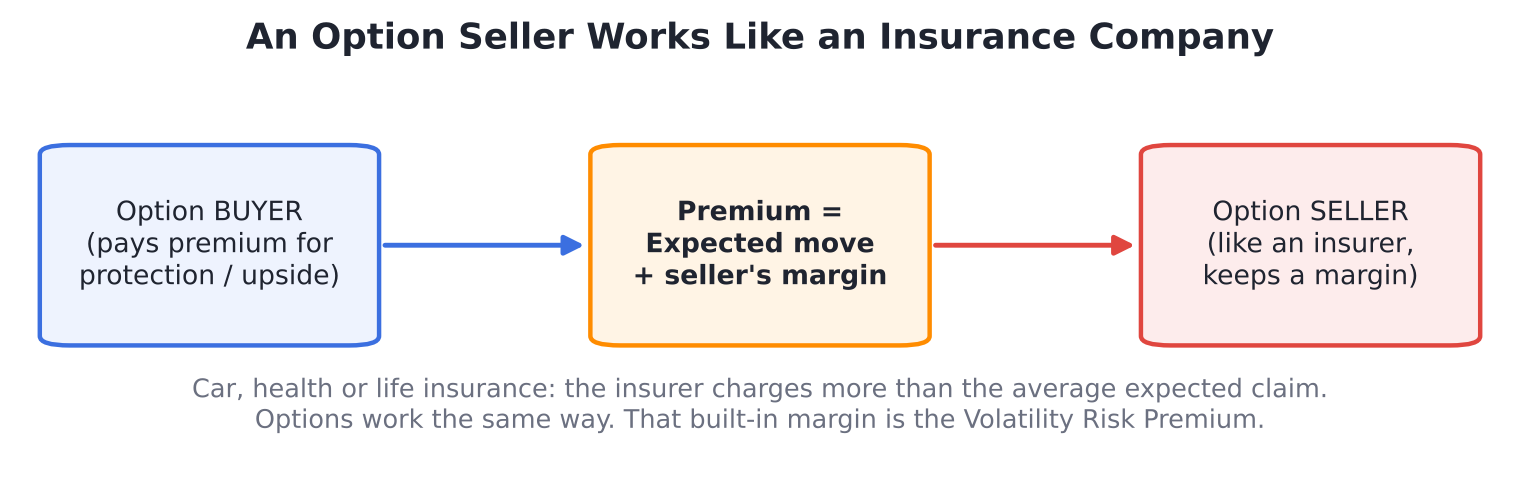
Figure 2: The buyer pays a premium made of the expected move plus the seller’s margin, just as an insurer prices in a margin above expected claims.
Step 1: Compare what the market priced with what actually happened
What we do: Plot India VIX (the move the market priced in) against the move Nifty actually made over the following 21 trading sessions, month by month from 2015 to 2026.
Why: If options were priced fairly, the two lines would sit roughly on top of each other. Any persistent gap shows who has the edge.
How it works:
- When the orange VIX line is above the actual move, options were priced too richly. That month belonged to the sellers (shaded red).
- When the actual move is above VIX, the market moved more than was priced in. That month belonged to the buyers (shaded green).
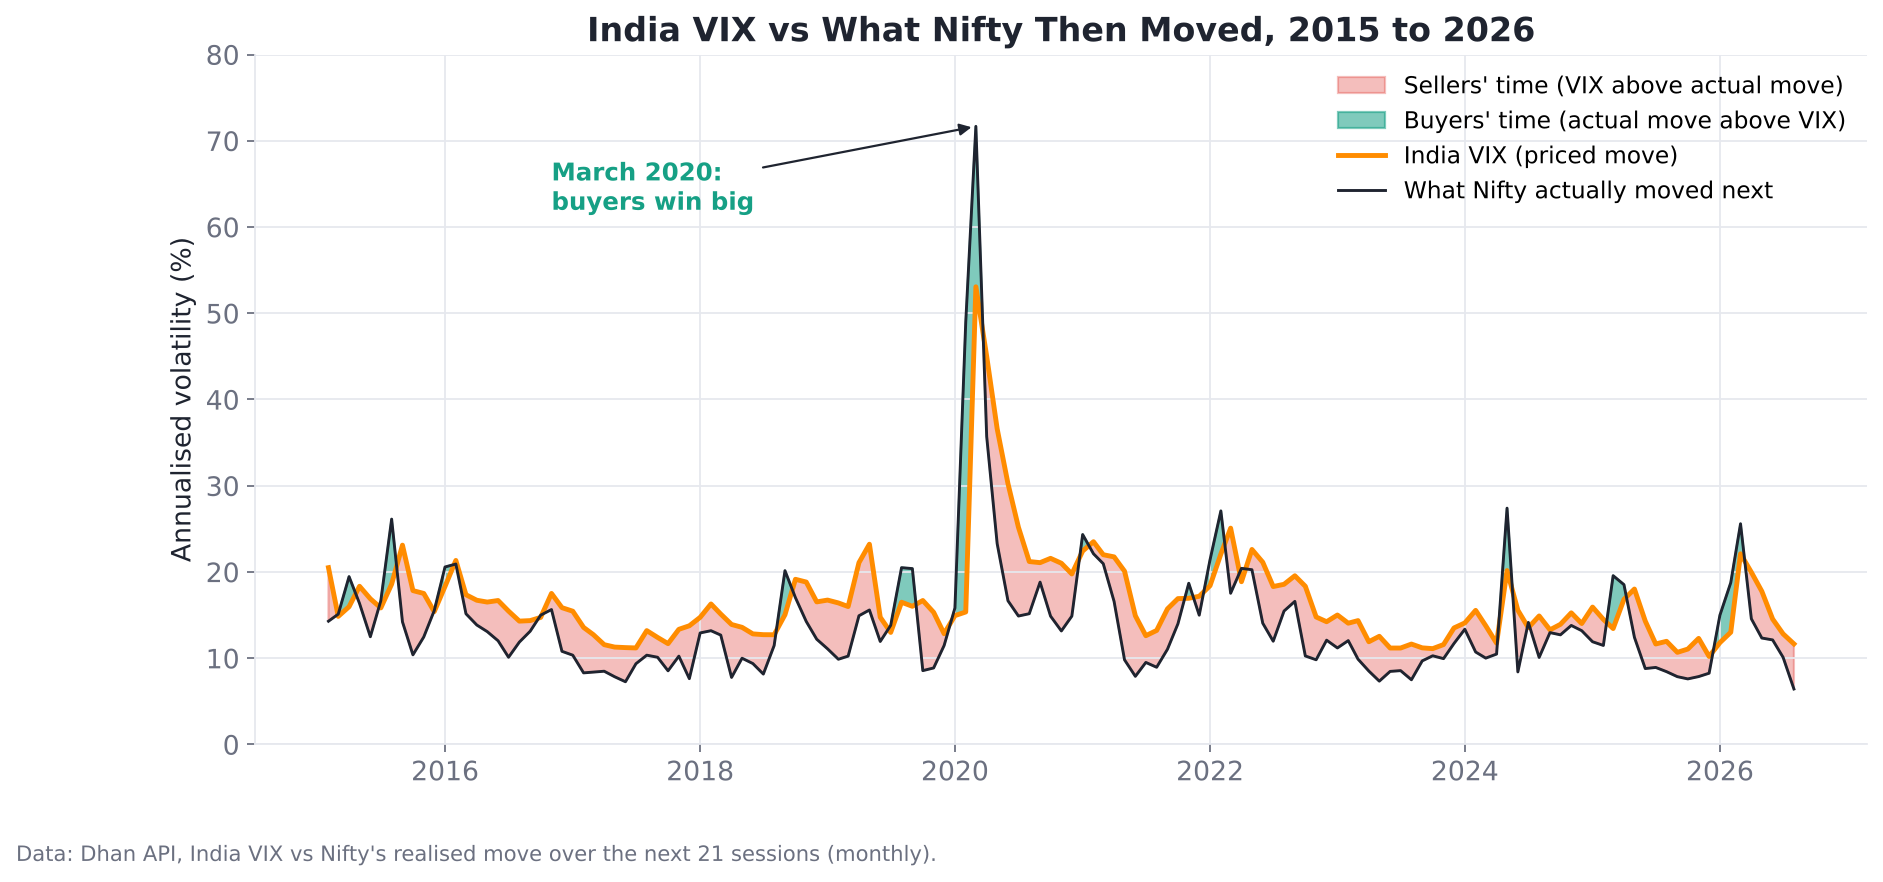
Figure 3: India VIX (orange) vs what Nifty then actually moved (black). Red areas are sellers’ time; green areas are buyers’ time. Note March 2020, when buyers won big.
Expected result: The red area dominates. Most of the time, the market charges for a bigger move than the one that arrives.
Step 2: Count the days
Over 2,861 trading days, the split is striking:
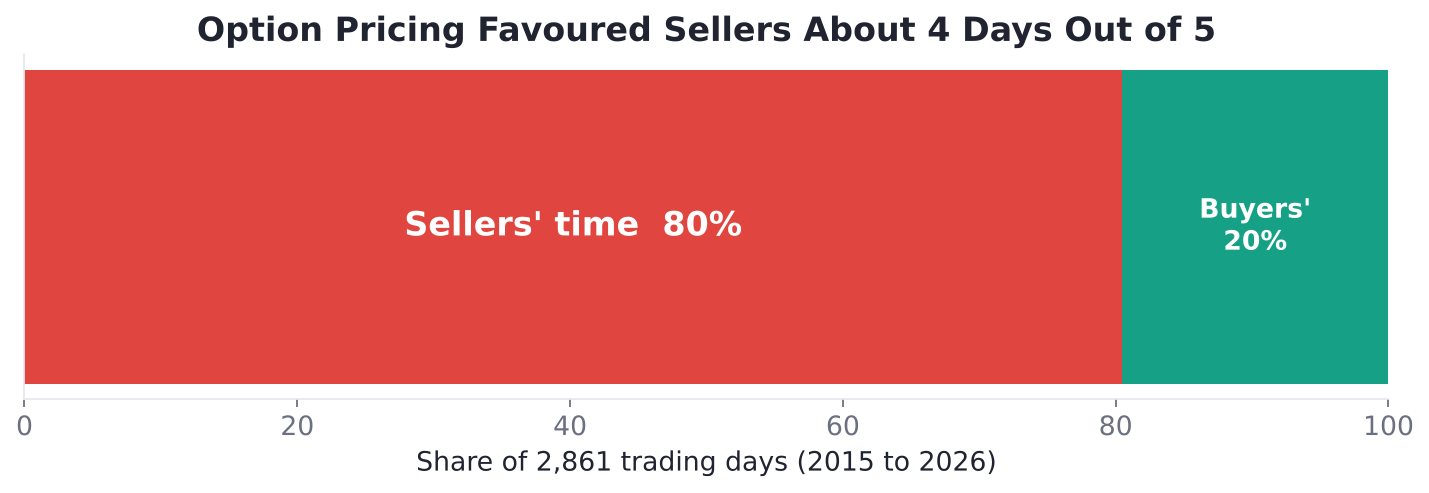
Figure 4: About 80% of the time, options were priced above the move that followed.
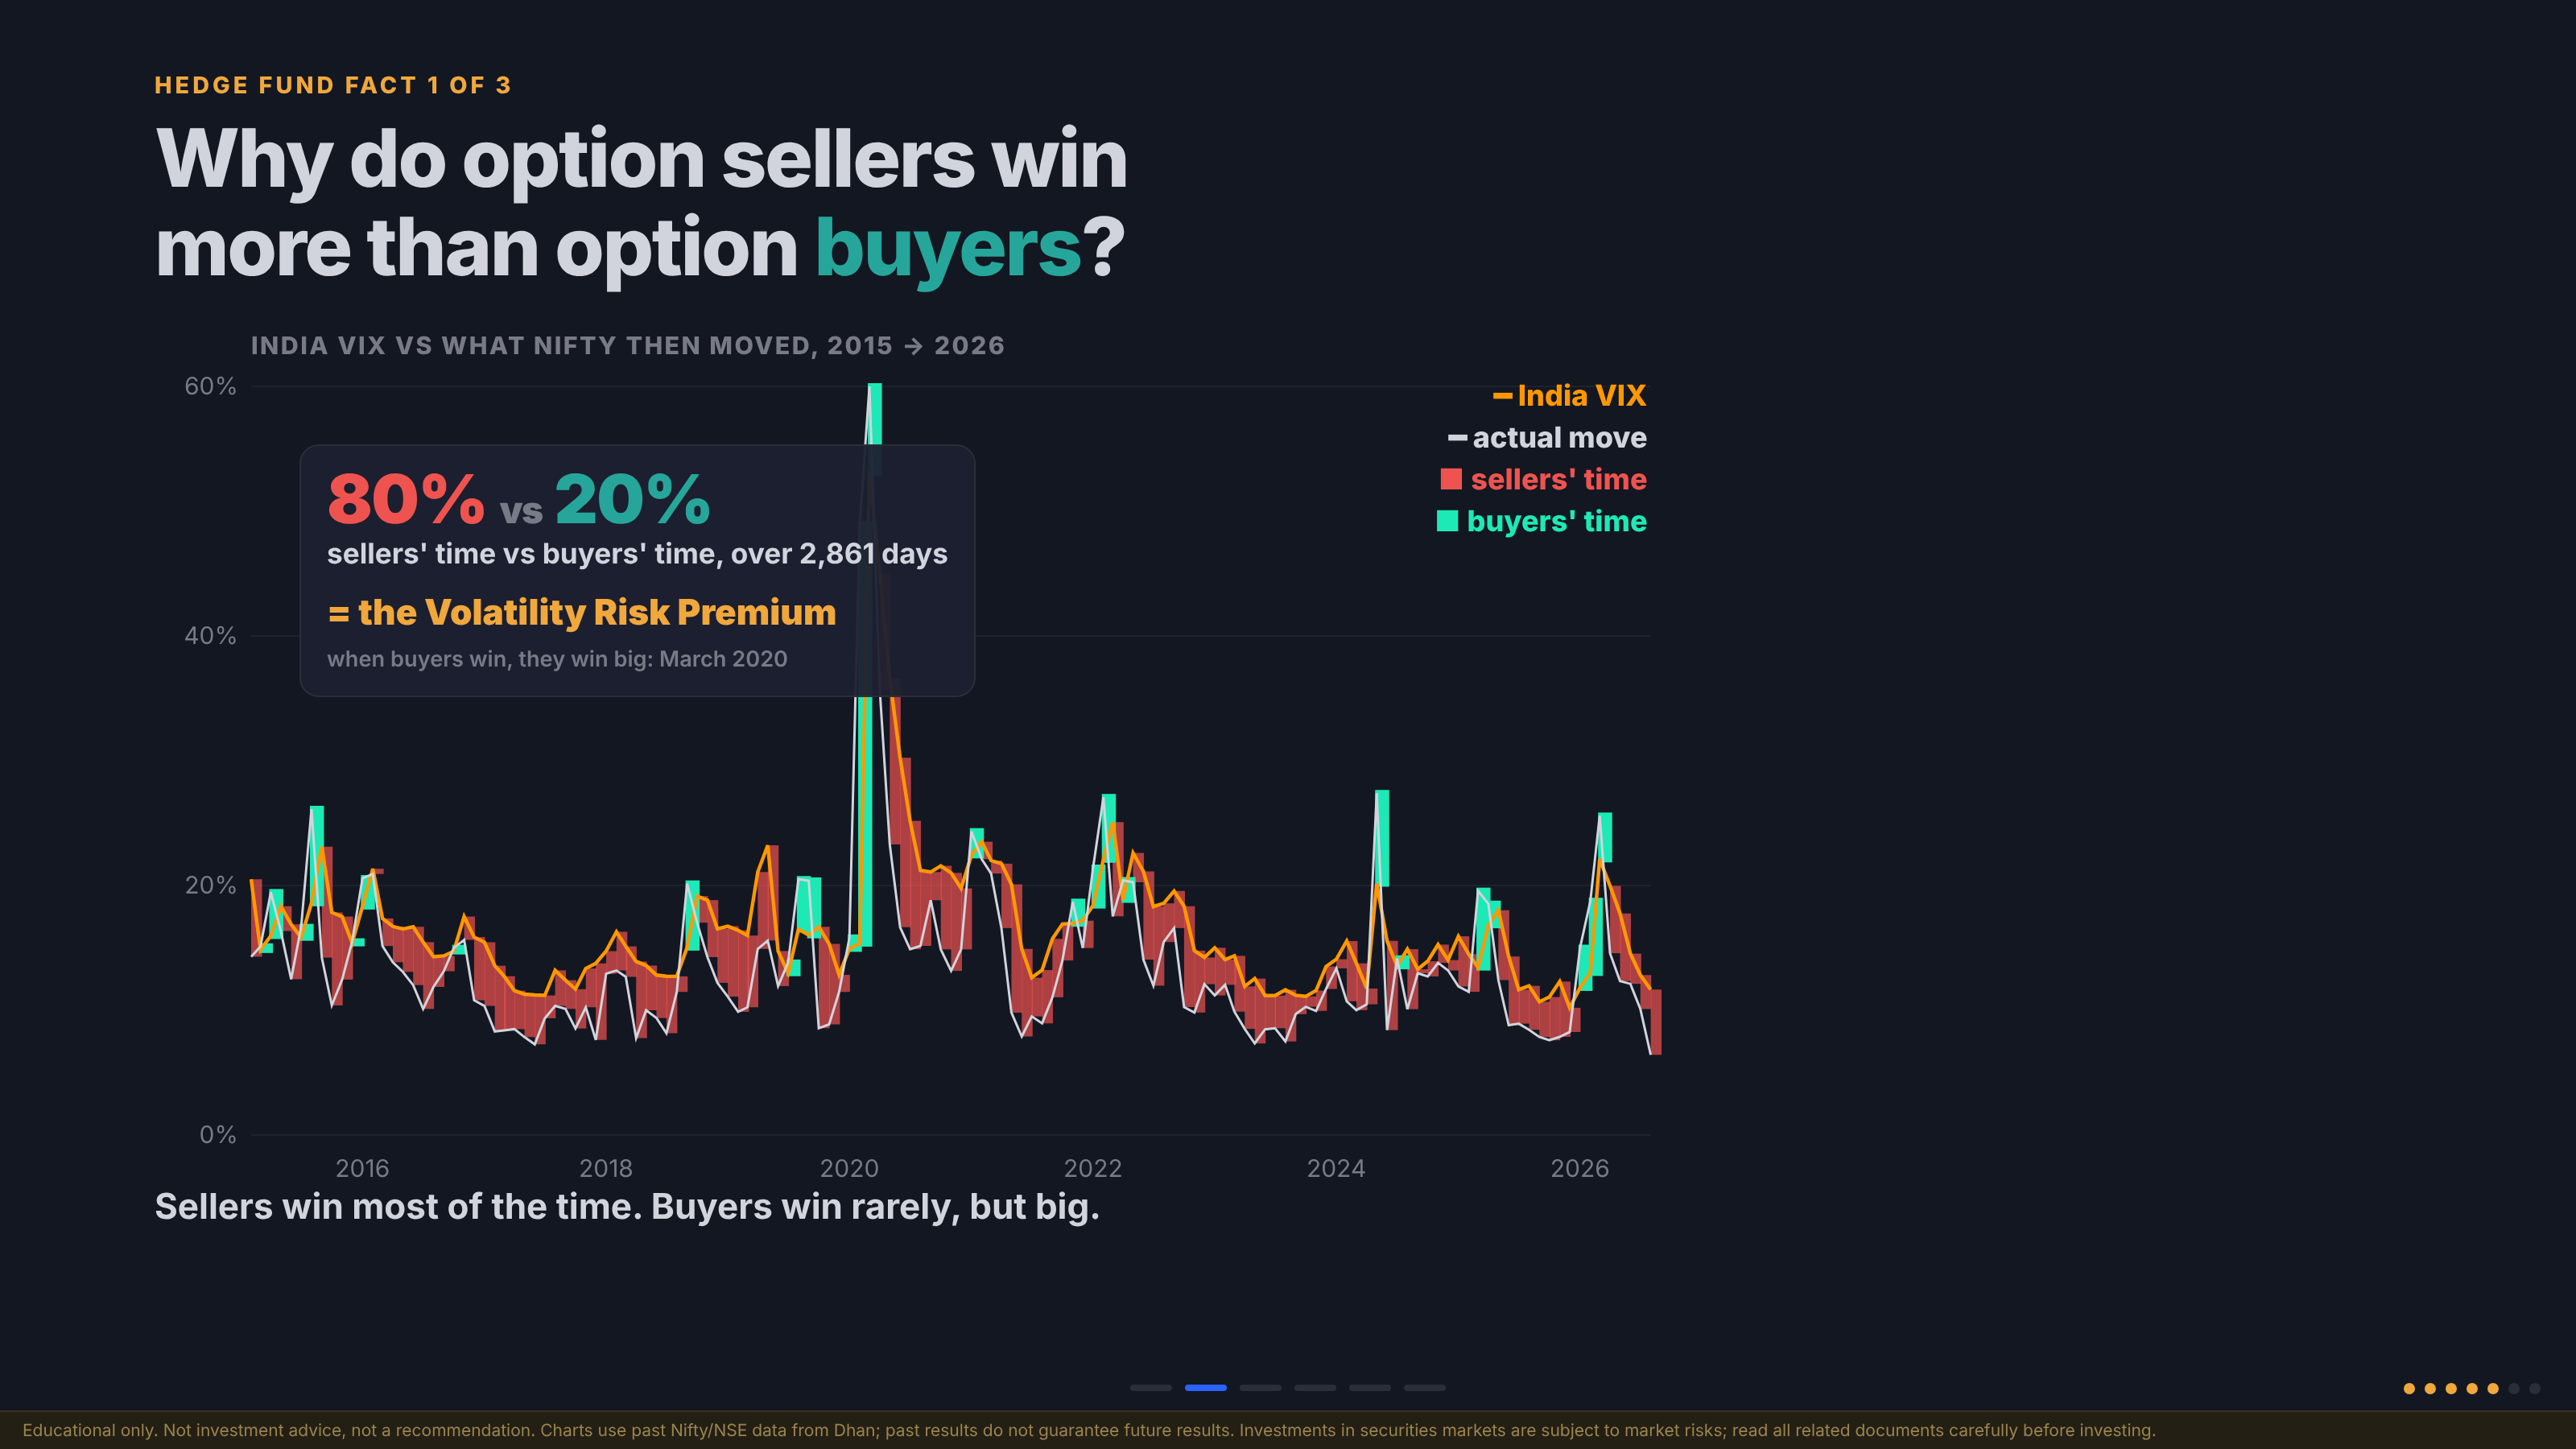
Slide 2: The video deck’s version of the same study, with the 80% vs 20% split called out as the Volatility Risk Premium.
| Period type | Share of days | What it means |
|---|---|---|
| Sellers’ time | ~80% | Implied volatility (VIX) was above the realised move |
| Buyers’ time | ~20% | The market moved more than priced in |
On average, India VIX stood at about 16.6%, while Nifty’s realised volatility averaged about 14.0%.
Warning: Sellers win more often, but not always, and when buyers win, they win big. In March 2020, Nifty’s realised volatility spiked to nearly 90% while VIX had priced in around 26%. Selling options without risk control means accepting rare but very large losses.
Step 3: See the premium in today’s option prices
What we do: Take a live snapshot of next month’s at-the-money (ATM) Nifty options and compare their price with what history says that move is worth.
The snapshot (Dhan option chain, 24 Sep 2026, 12:10):
| Item | Value |
|---|---|
| Nifty spot | 23,207.95 |
| ATM strike | 23,200 |
| Expiry | 27 Oct 2026 (33 days) |
| ATM call | Rs 362.10 |
| ATM put | Rs 251.65 |
| ATM straddle (call + put) | Rs 613.75 (a +/- 2.6% move) |
How it works: The straddle price is what a buyer pays for the market’s expected move. History says a move of that size is worth about Rs 520.
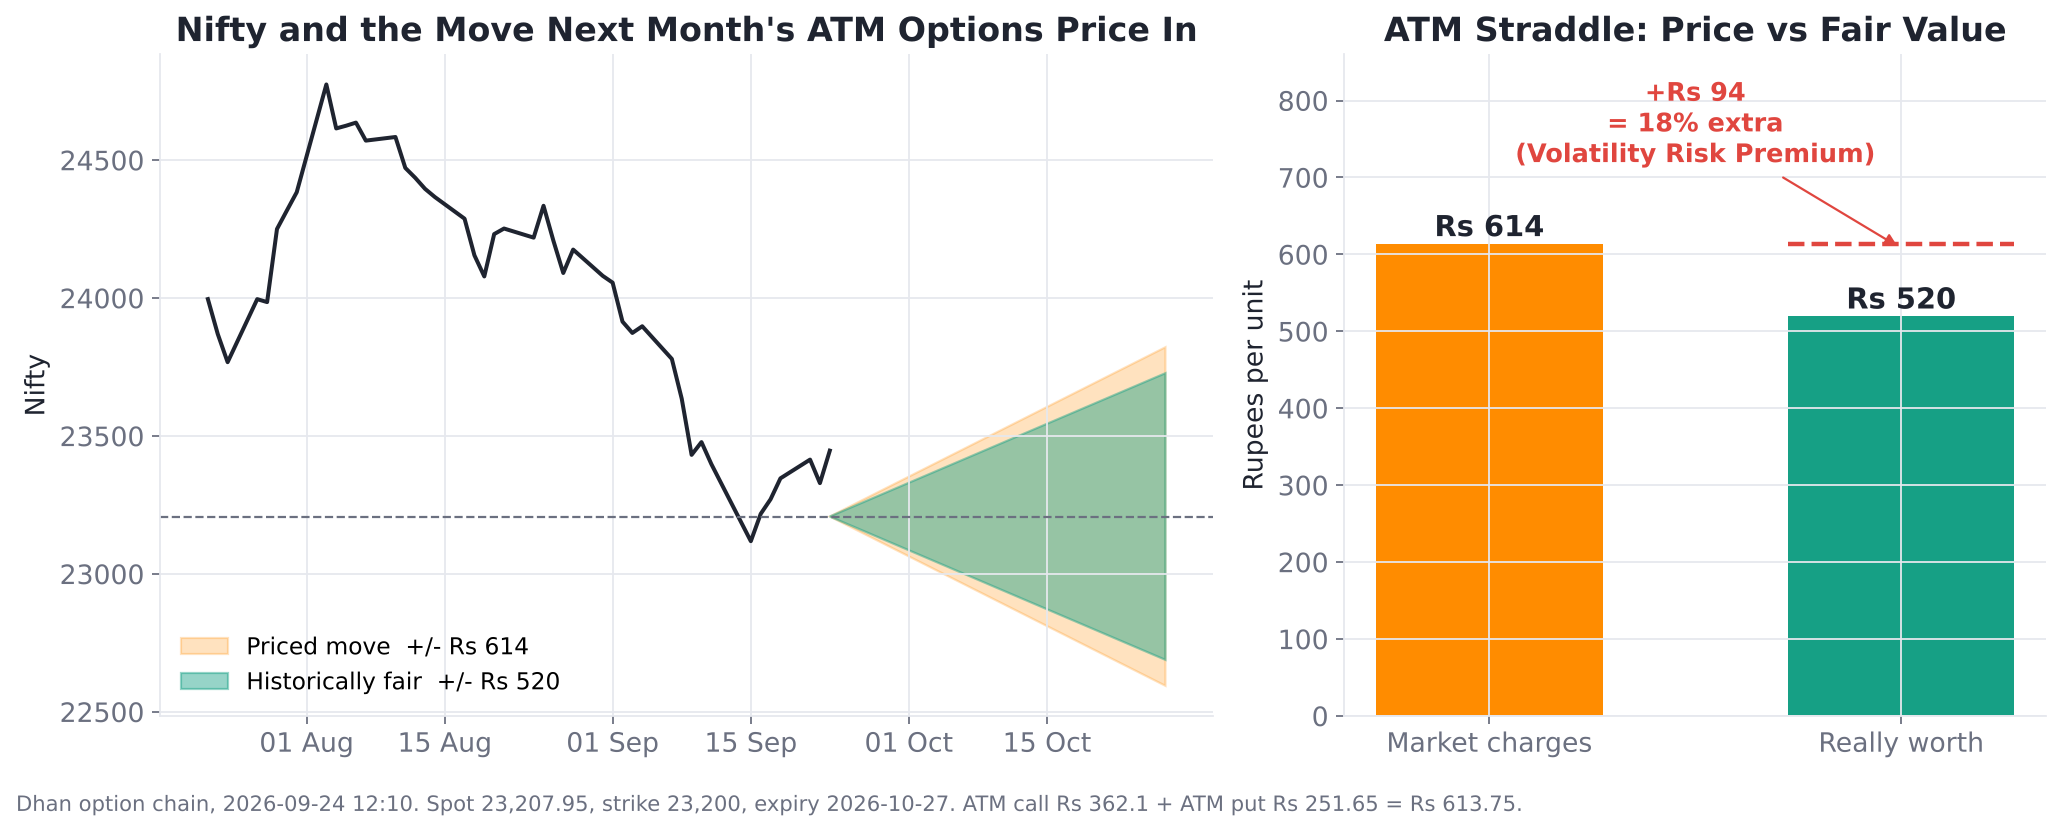
Figure 5: Left, the move priced into next month’s ATM options (orange) vs the historically fair move (green). Right, the market charges about Rs 614 for a move worth about Rs 520.
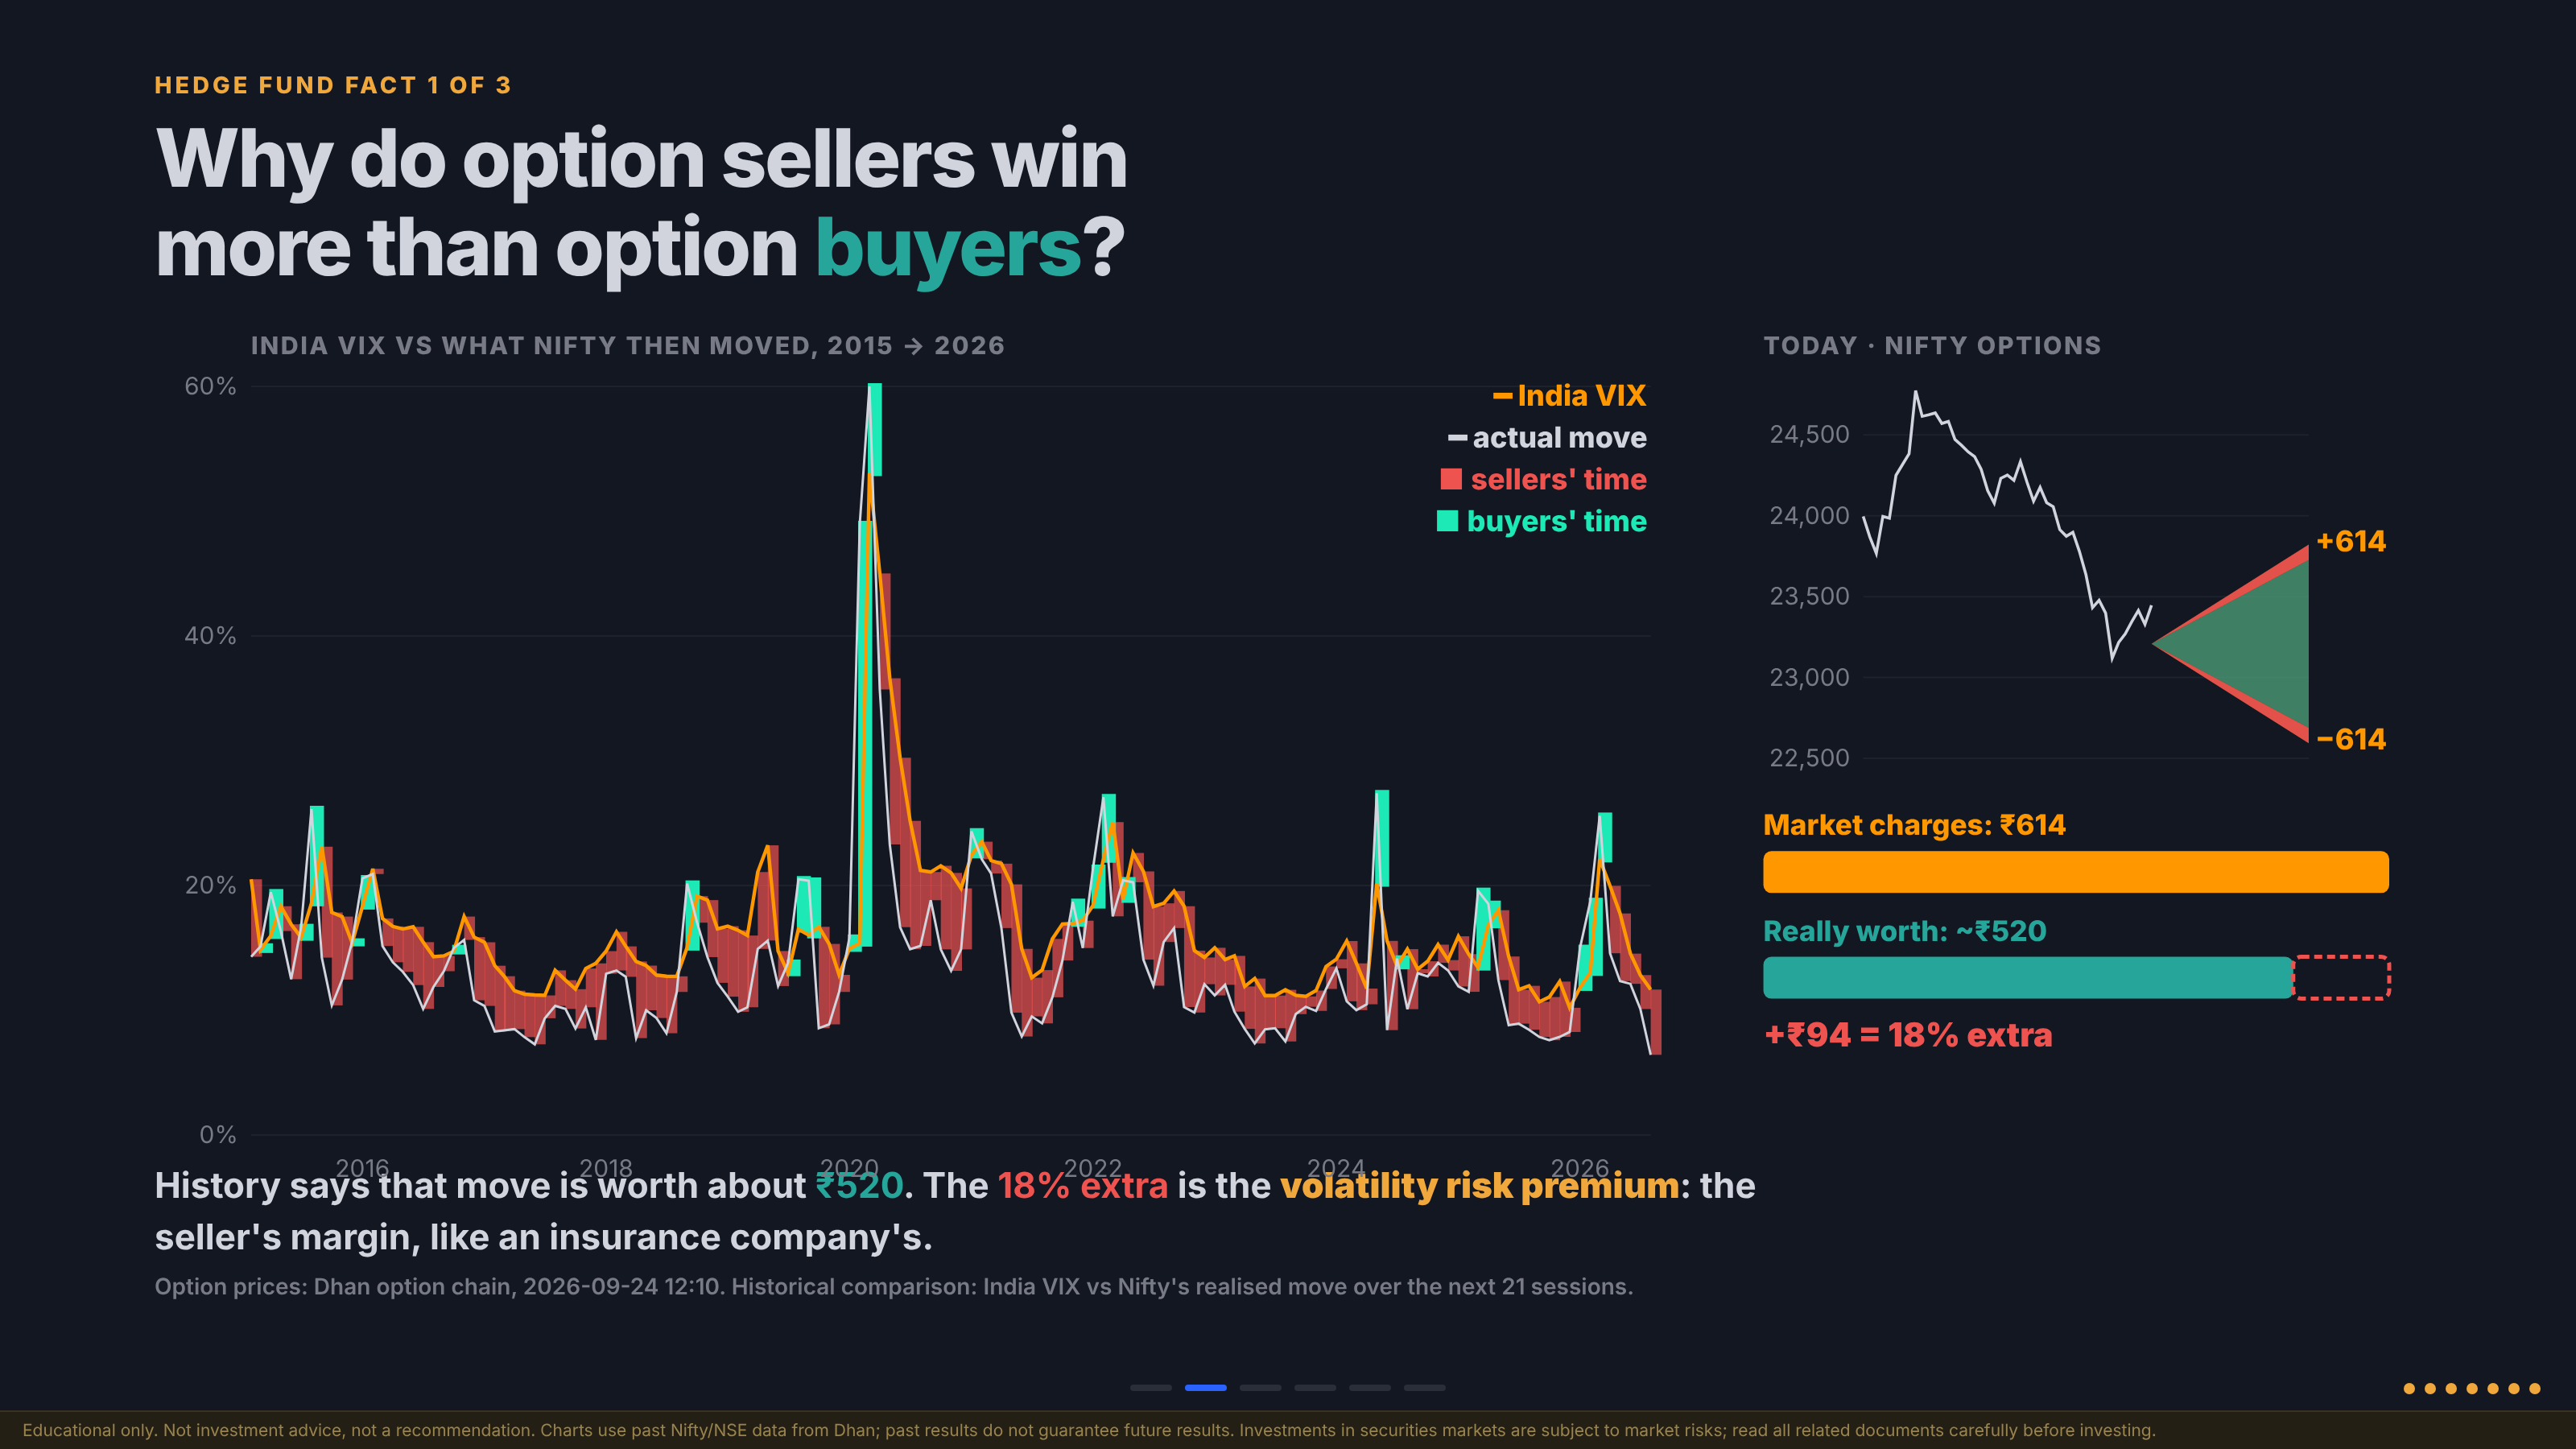
Slide 3: The complete Fact 1 slide. History on the left, today’s Nifty options on the right: Rs 614 charged vs about Rs 520 really worth, a gap of Rs 94 (18% extra).
Expected result: The gap of about Rs 94, roughly 18% extra, is the Volatility Risk Premium: the seller’s margin, just like an insurance company’s.
Key takeaway: The volatility risk premium is known to every hedge fund and every bank desk. Knowing it helps you understand when the odds favour sellers and when they favour buyers.
Fact 2: How to Find Which Rules in Your Strategy Really Work (PCA)
The problem
Suppose your strategy has four rules:
- Breakout: price breaks above the high of the previous three candles.
- Volume: a volume condition for entry.
- Trend: a multi-timeframe trend filter.
- Price action: a price action condition.
Looking at it from a distance, it is natural to assume each rule is equally responsible for the strategy’s behaviour, 25% each. Hedge funds don’t assume that. They measure it, using Principal Component Analysis (PCA).
How PCA works, step by step
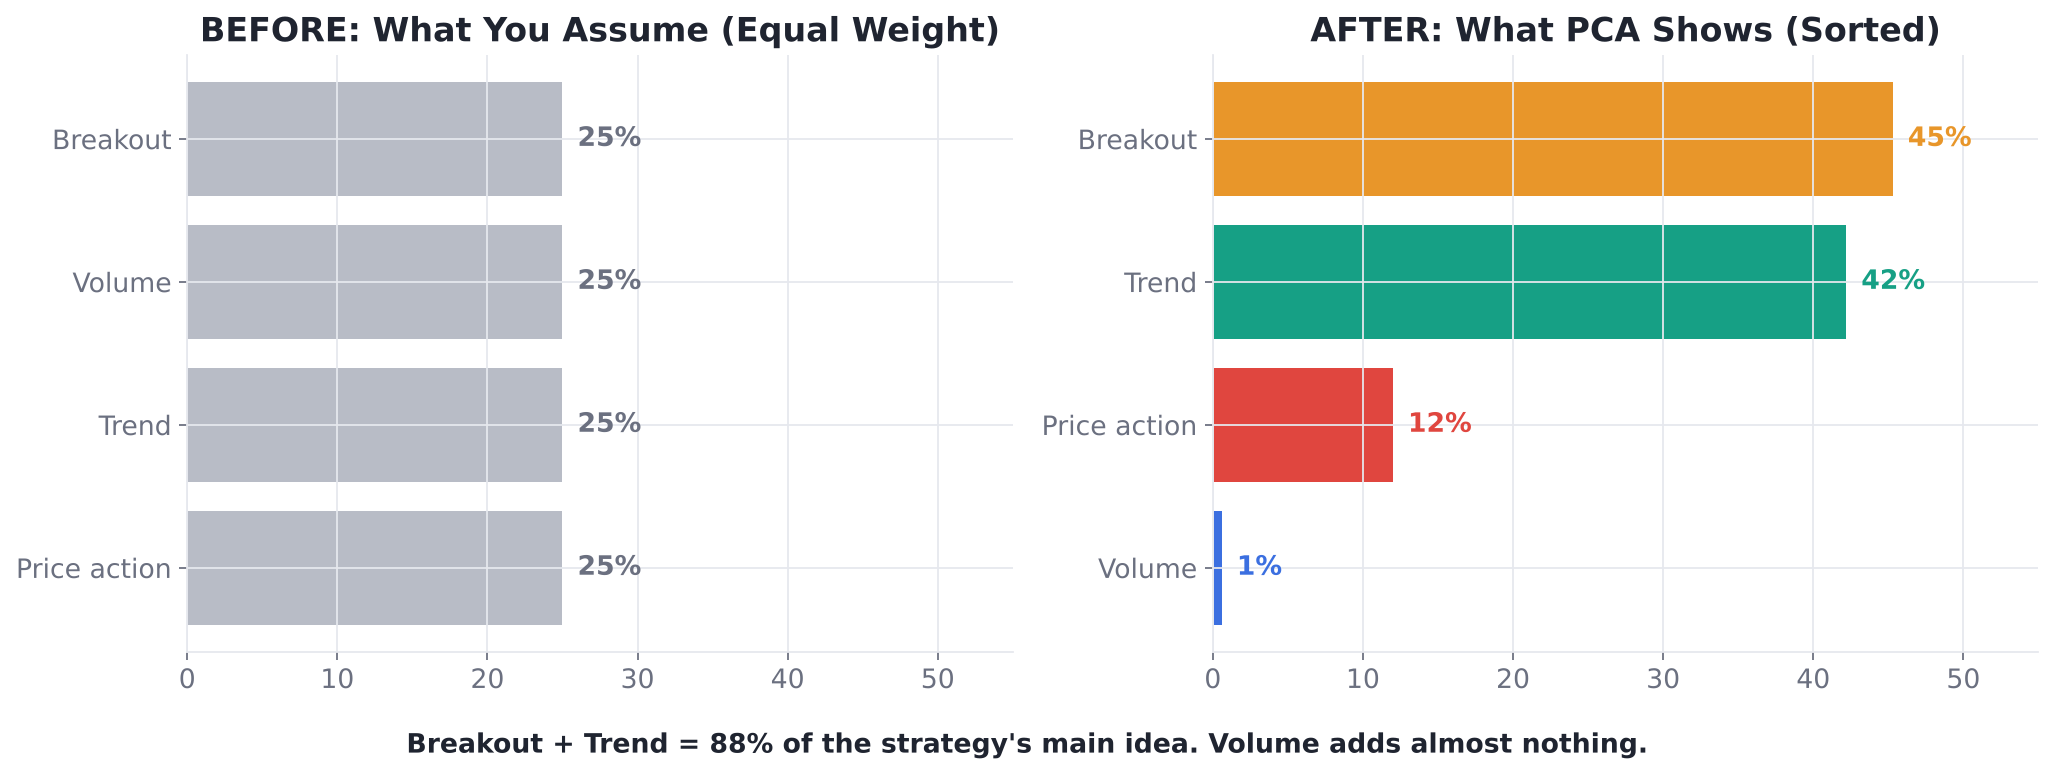
Figure 6: The four steps of a PCA study on a set of strategy rules.
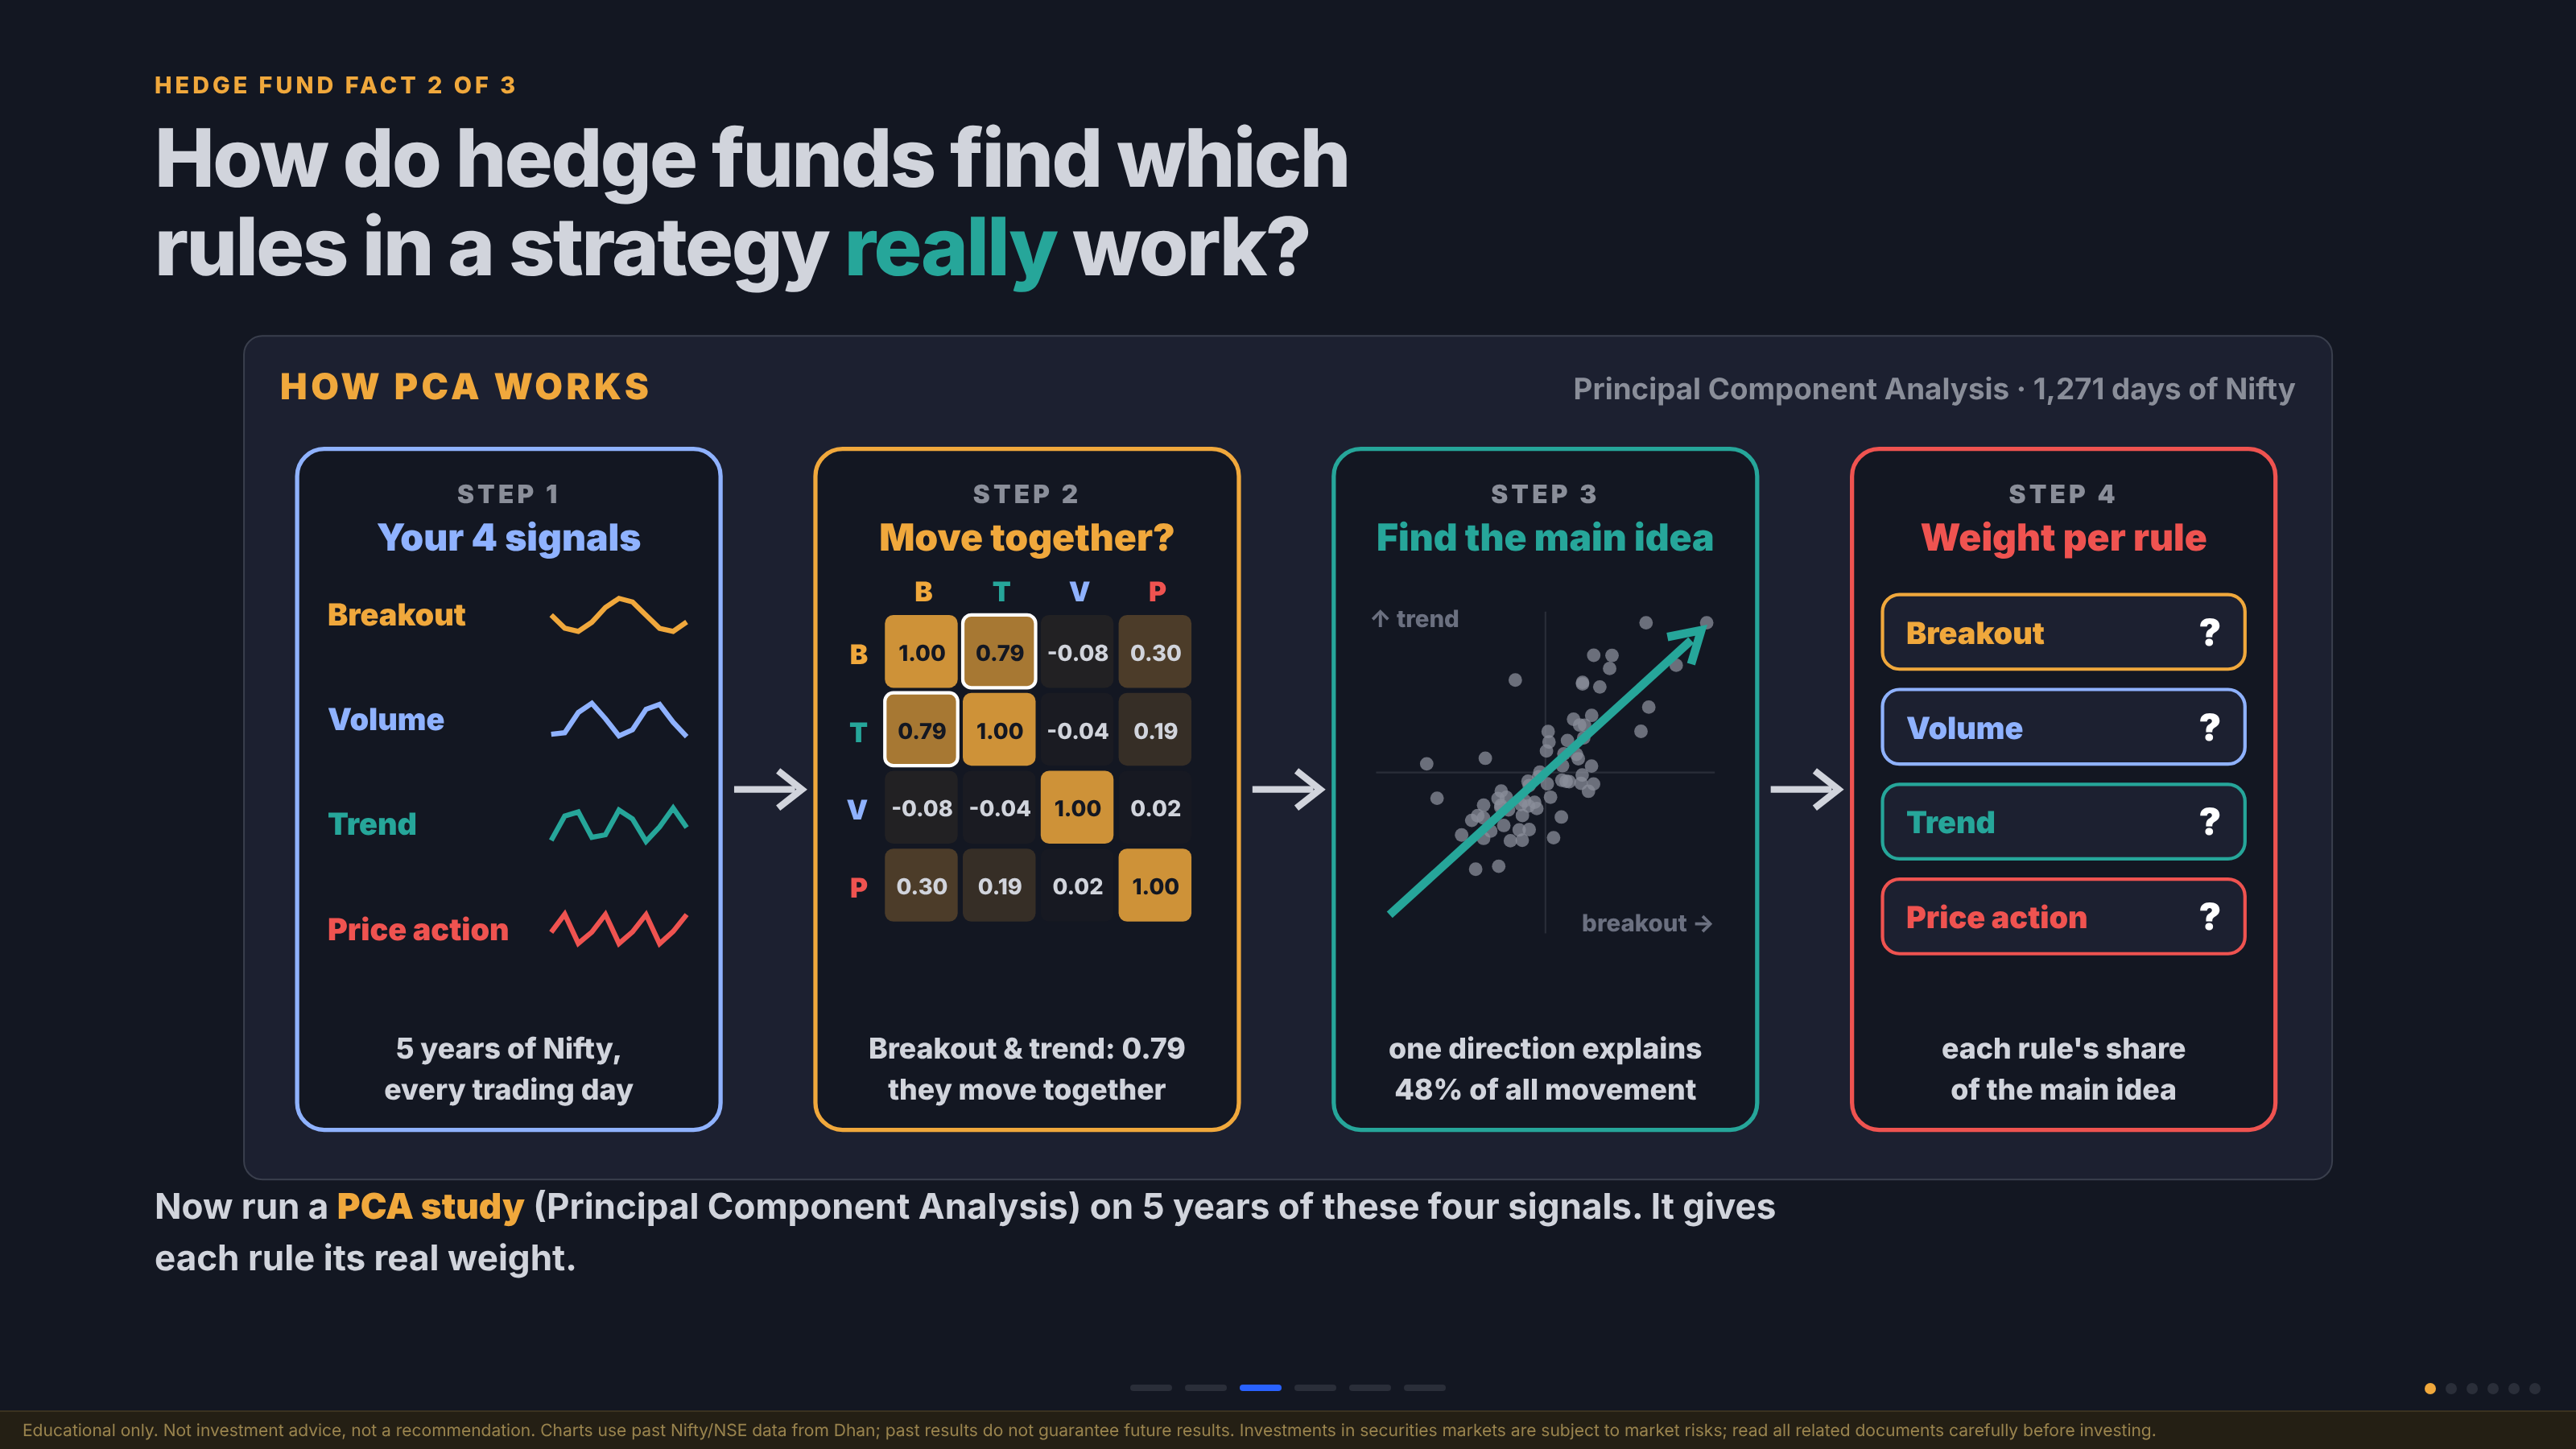
Slide 4: “How PCA works” from the video deck, with the real signal correlations (Breakout and Trend at 0.79) and the main idea explaining 48% of all movement.
Step 1: Collect the signals
What: Record each rule’s signal every trading day. Here we use about five years of Nifty (Aug 2021 to Sep 2026, 1,271 days).
Why: PCA works on data, not opinions. It needs each rule’s actual behaviour over time.
Step 2: Find which signals move together
What: Measure the correlation between every pair of signals.
Why: If two rules almost always fire together, they are really saying the same thing. Counting them as two separate sources of edge is double counting.
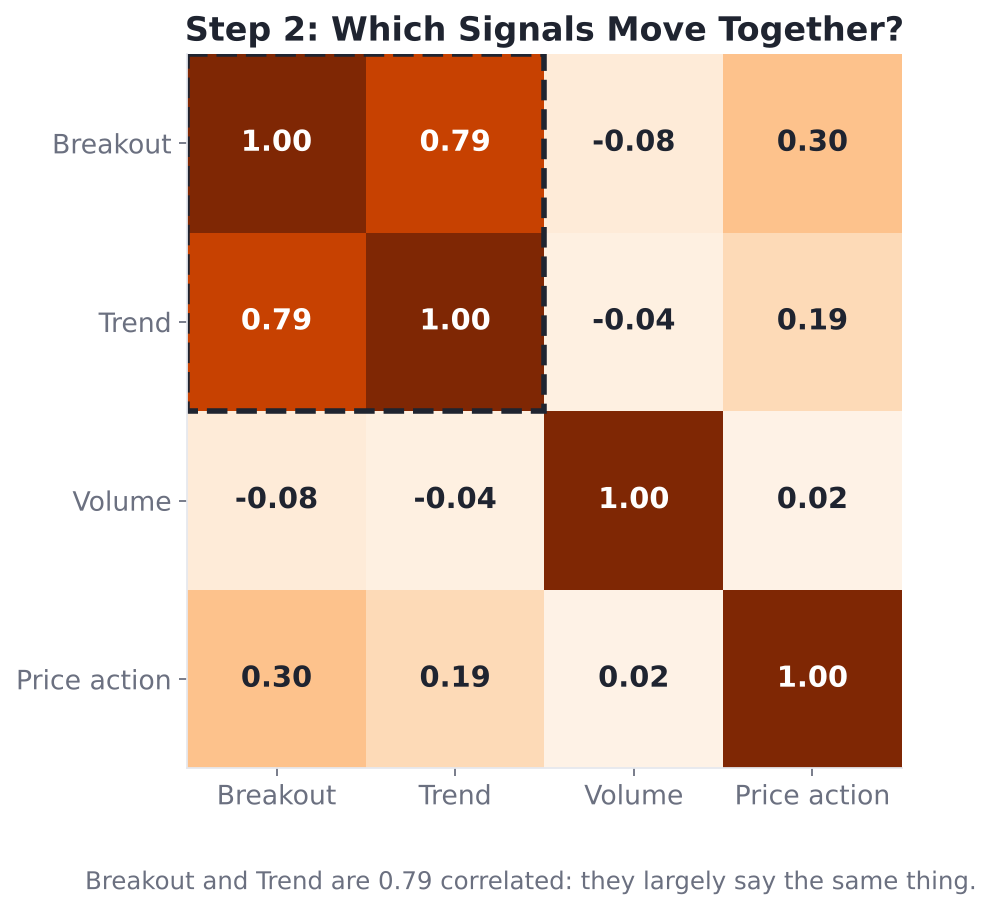
Figure 7: Breakout and Trend are 0.79 correlated; they largely say the same thing. Volume is almost unrelated to the others.
Result: Breakout and Trend are 79% correlated. Volume barely relates to anything.
Step 3: Find the main idea
What: PCA finds the single direction, called the first principal component, that explains the most of the combined movement of all four signals.
Result: In this example, the first component explains about 48% of all movement across the four signals. This is the strategy’s “main idea”.
Step 4: Read each rule’s weight
What: Check how much each rule contributes to that main idea, then sort.
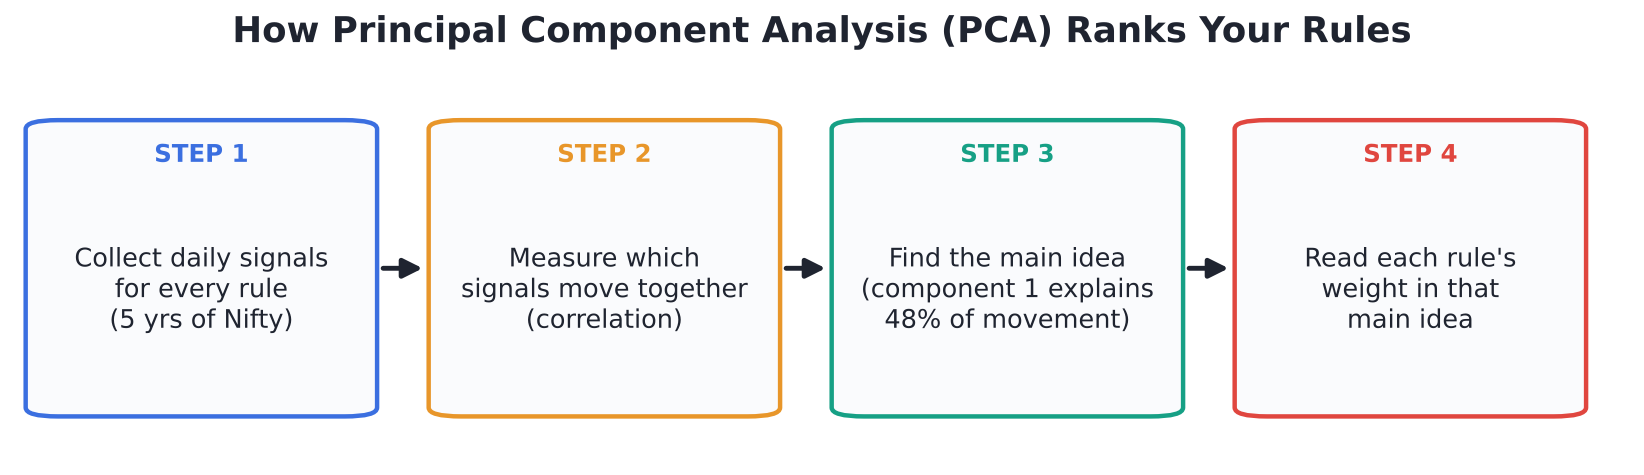
Figure 8: Before, you assume 25% each. After PCA, the real weights are very uneven.
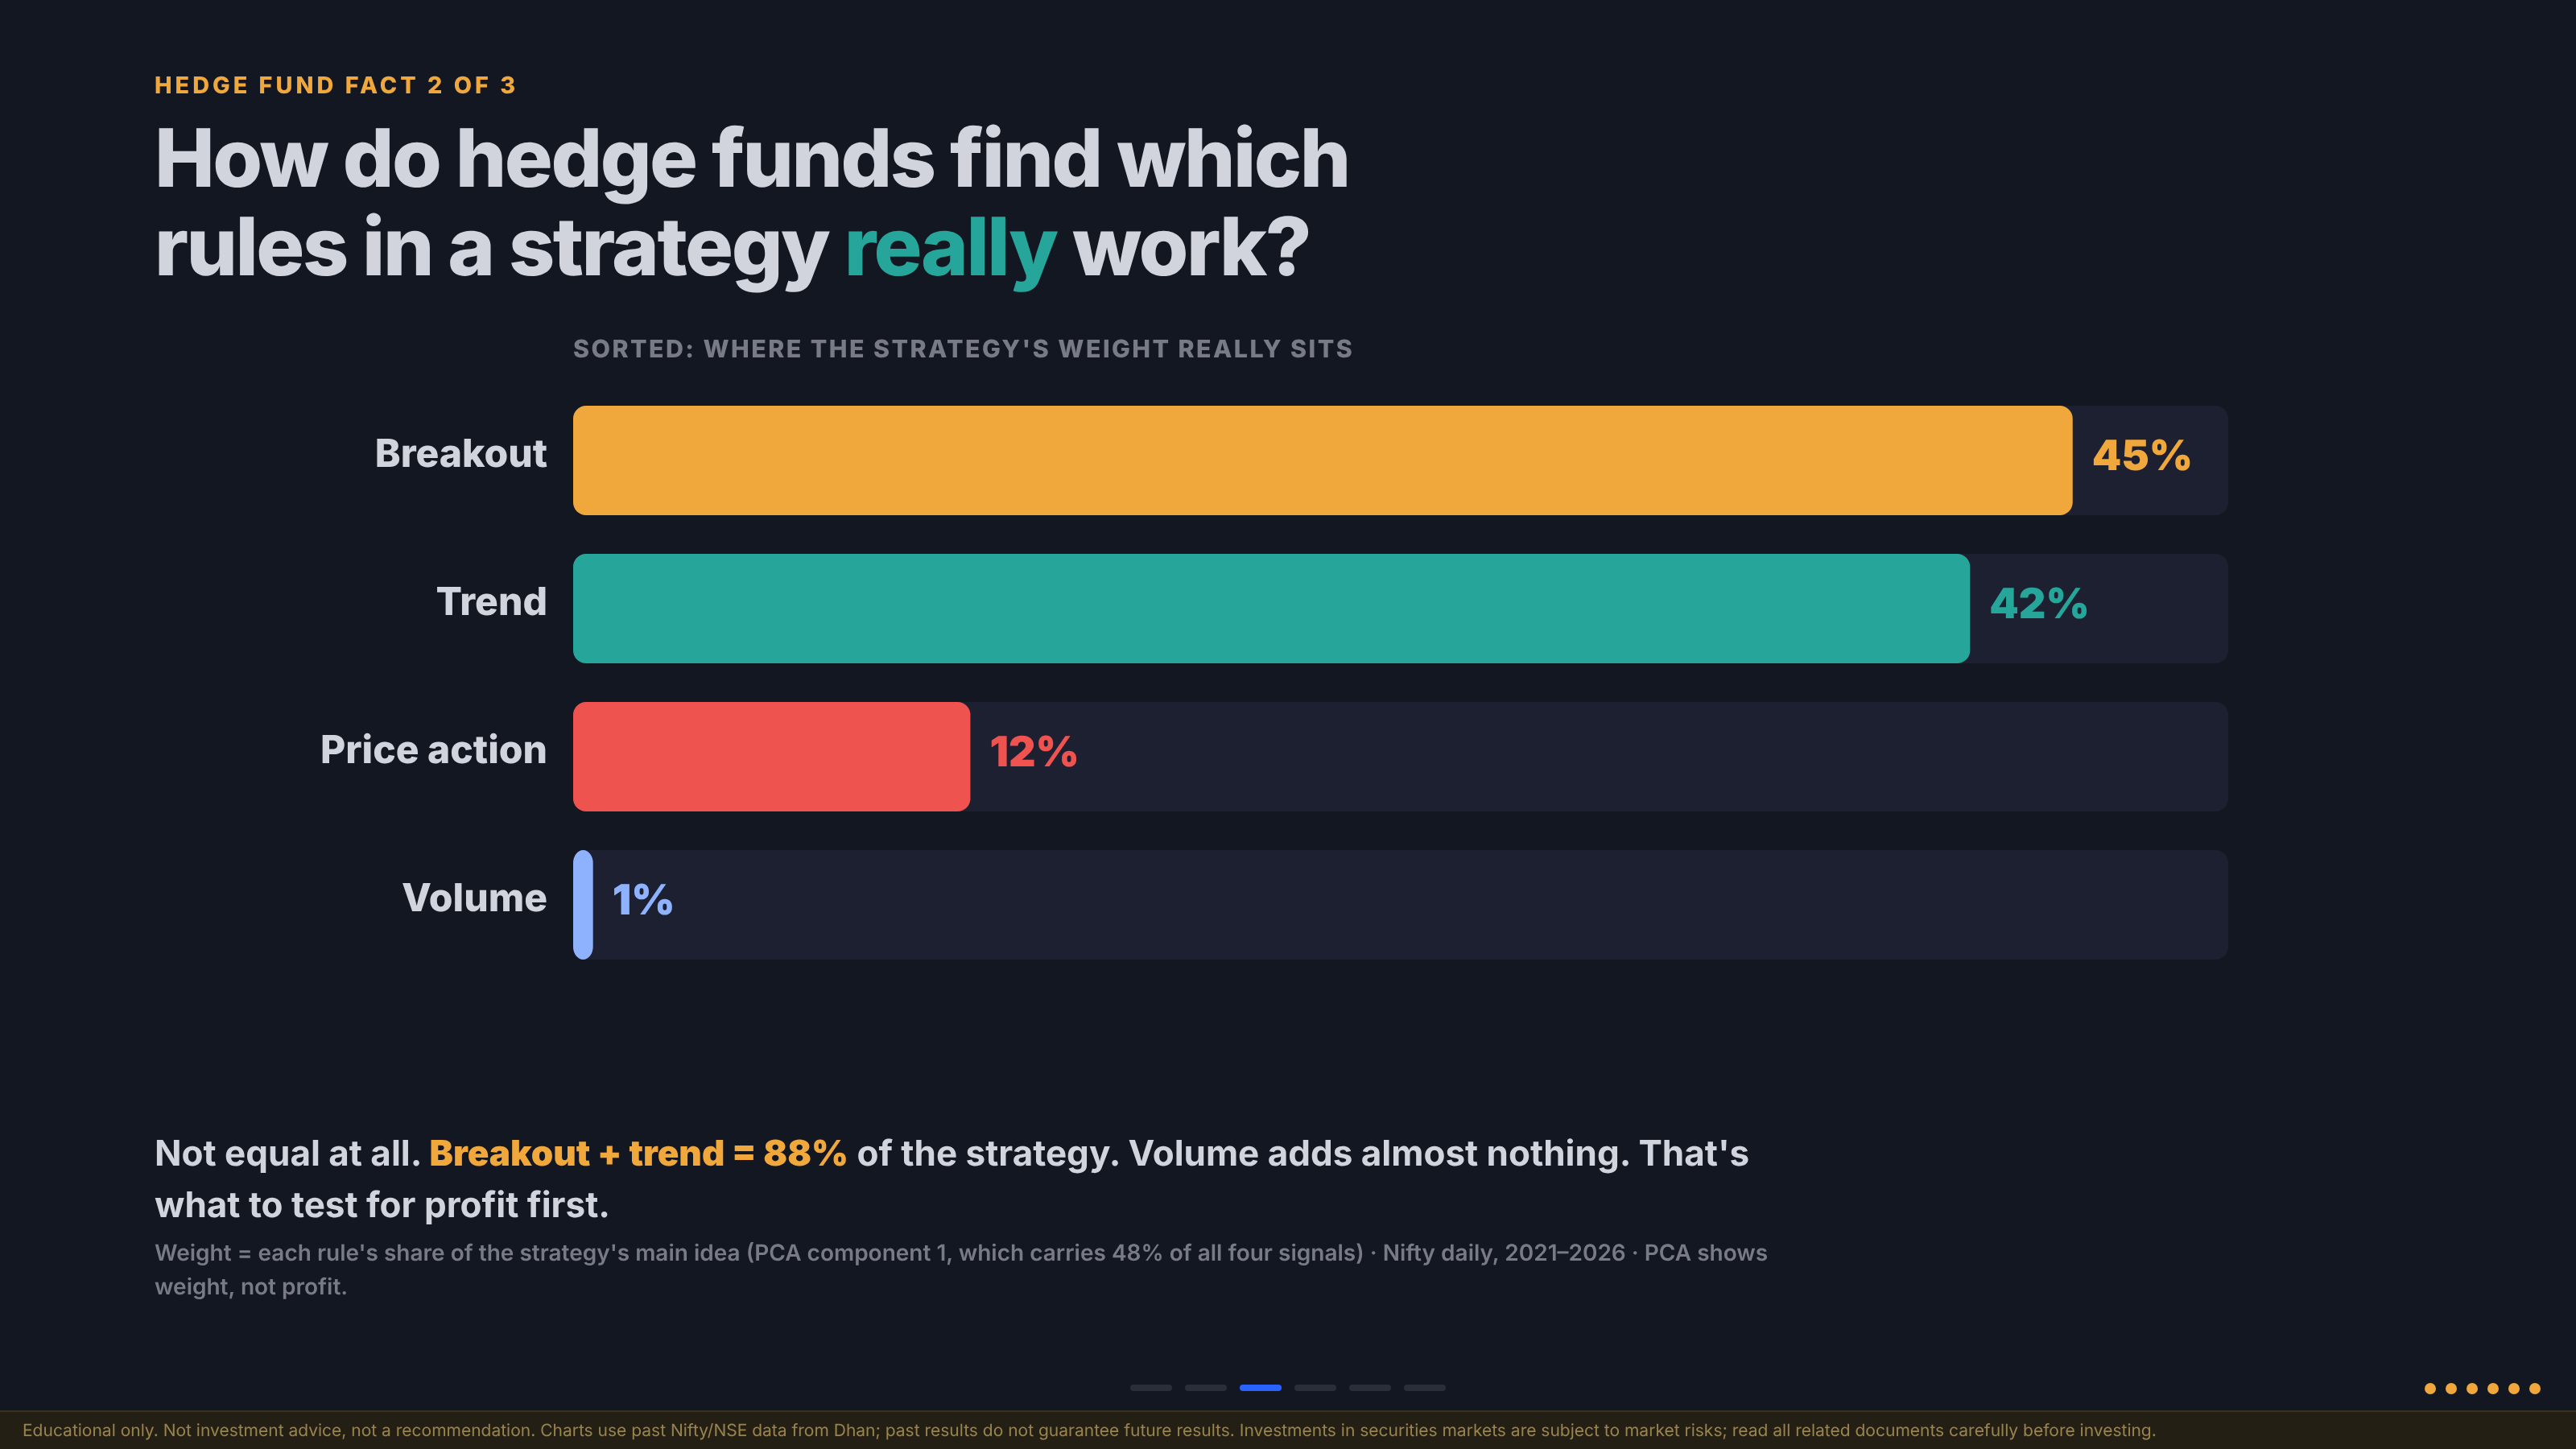
Slide 5: The sorted PCA weights from the video. Breakout and Trend carry 88% of the strategy; Volume carries about 1%.
| Rule | Assumed weight | PCA weight | Verdict |
|---|---|---|---|
| Breakout | 25% | ~45% | Core driver |
| Trend | 25% | ~42% | Core driver |
| Price action | 25% | ~12% | Minor contributor |
| Volume | 25% | ~1% | Adds almost nothing |
Expected result: Breakout and Trend together explain about 88% of the strategy. Price action adds a little, and Volume is effectively a useless rule in this set. That tells you where to focus, and what to test for profit first.
Note: This is an illustrative example. PCA shows weight, not profit. A rule with a large weight is the one driving the strategy’s behaviour; you still need to backtest whether that behaviour makes money.
How to use PCA on your own strategy (with AI)
You do not need to code the maths yourself. The skill that matters is knowing the concept exists and understanding how it works. AI can handle the rest.
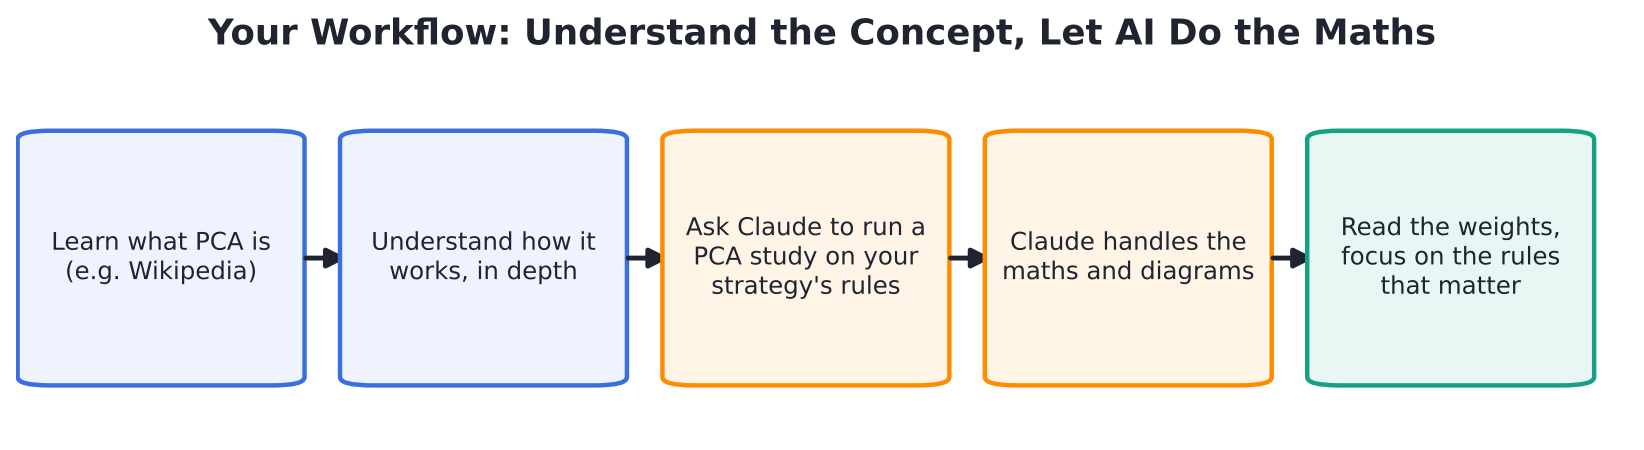
Figure 9: Learn the concept, then let an AI assistant such as Claude run the analysis.
-
Learn what PCA is. A quick read of the PCA page on Wikipedia explains that it is widely used in machine learning and data mining.
-
Understand how it works, in depth. You should know what correlation, components and weights mean so you can read the output.
-
Ask Claude to run the study. For example:
My strategy has four rules: breakout, volume, trend and price action. Run a Principal Component Analysis study on these rules and tell me which rules are actually responsible for running my strategy. -
Let Claude handle the maths and diagrams.
-
Read the weights and focus your testing on the rules that matter.
Tip: This is a rare moment for traders. You can now study how hedge funds build good strategies and have AI do the heavy lifting. Over the next few years, traders who use these tools will be far more advanced, so start slowly, study a little every day, and treat it as a long-term skill. Staying in the market is a game of years.
Fact 3: How Hedge Funds Tell the Market’s Mood (Hidden Markov Model)
The idea
The market has moods. It can stay calm for long stretches, and then it can turn volatile. A trader needs a mood detector, and hedge funds use a mathematical model called a Hidden Markov Model (HMM) for exactly this.
It is called “hidden” because we never directly observe the mood. We only see the daily price moves, and the model infers which mood most likely produced them.
Step 1: Feed the model five years of Nifty
What: Give the HMM every daily Nifty candle for five years (1,321 trading days, May 2021 to Sep 2026).
Why: The model learns two things from the data: what each mood looks like, and the odds of switching from one mood to another. These odds are called transition probabilities.
Step 2: Read the transition probabilities
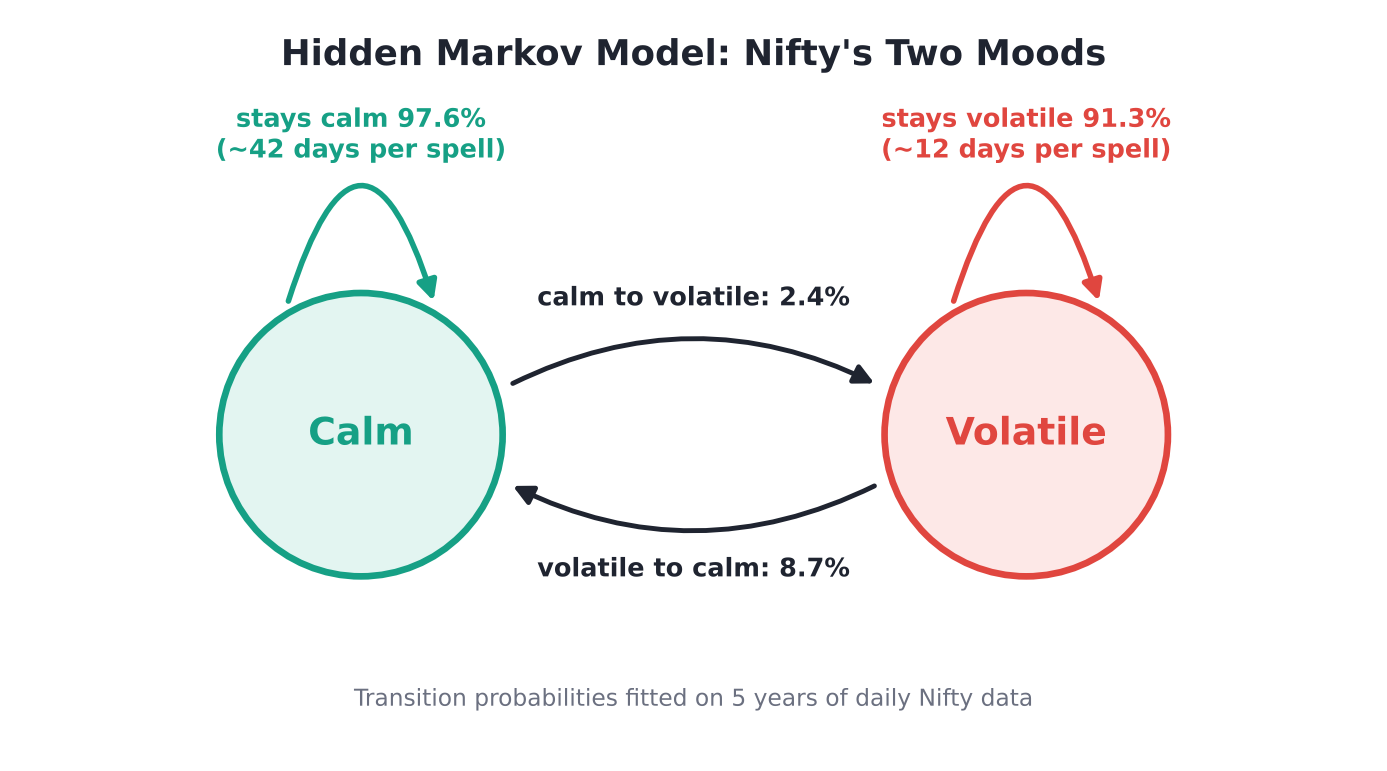
Figure 10: The two moods the HMM found on Nifty and the probability of staying or switching each day.
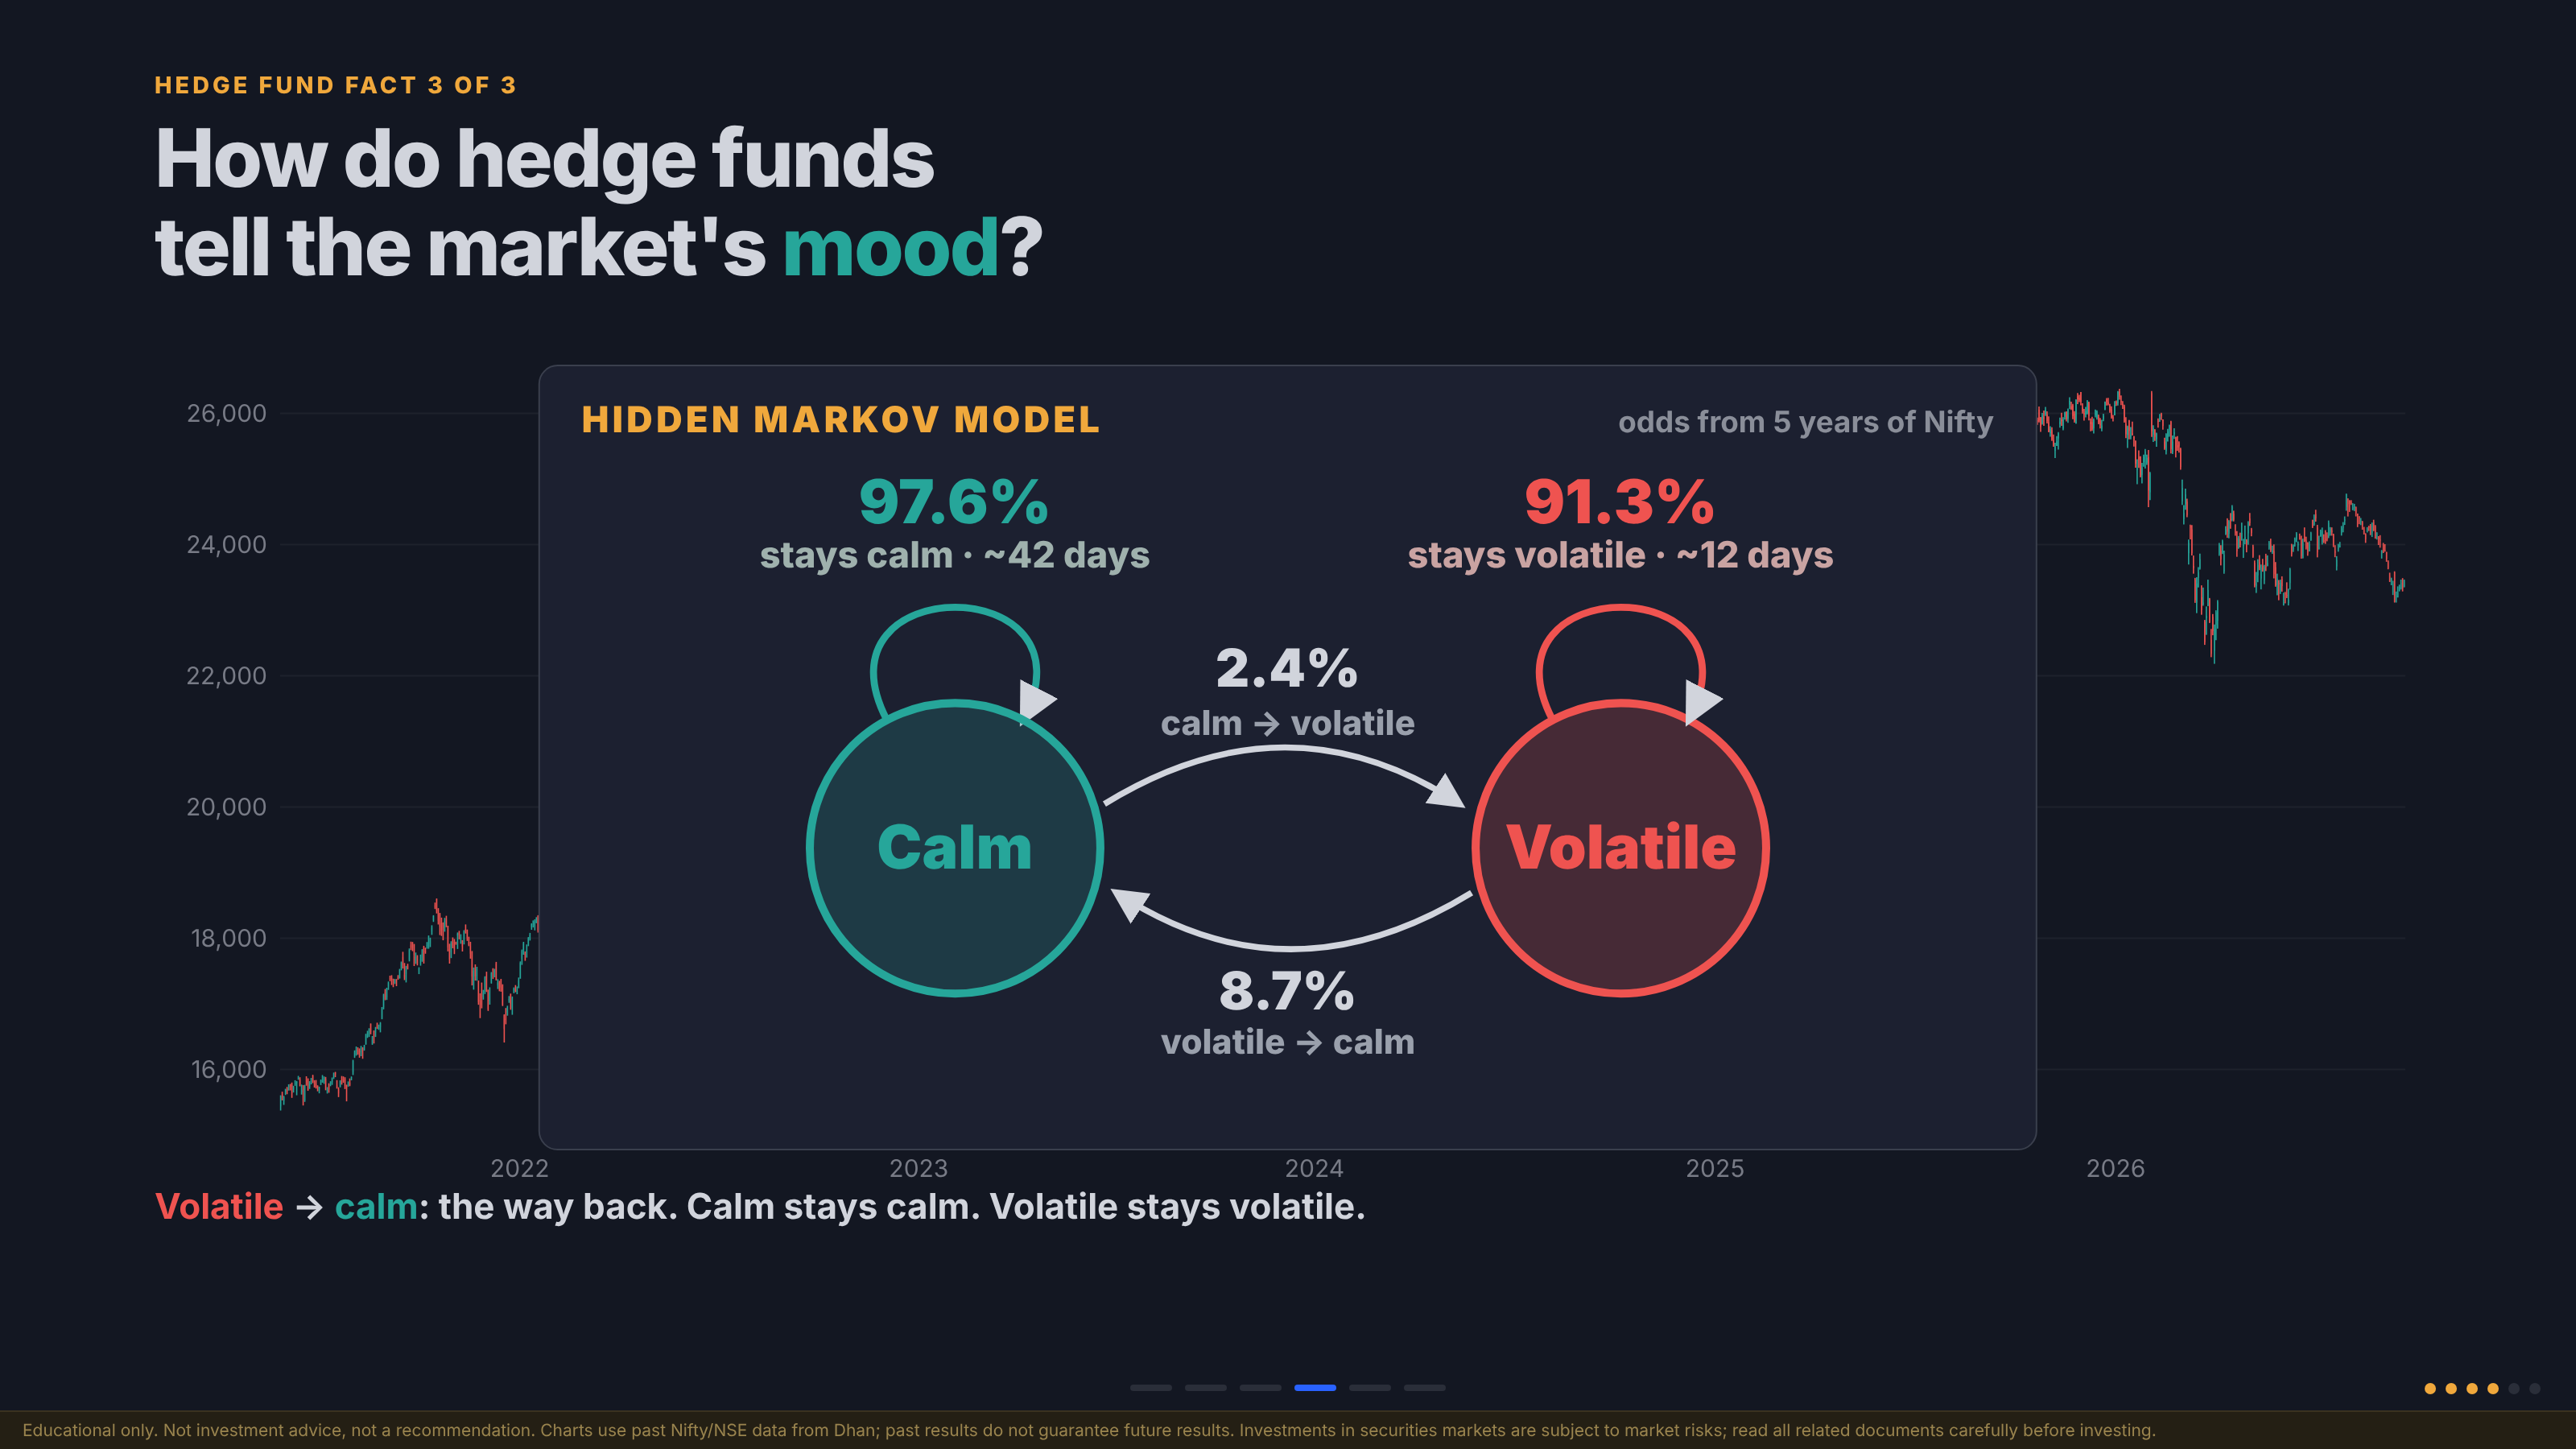
Slide 6: The Hidden Markov Model card from the video deck, built from five years of Nifty.
| If the market is… | Stays the same tomorrow | Switches tomorrow | Average spell length |
|---|---|---|---|
| Calm | 97.6% | 2.4% (to volatile) | ~42 days |
| Volatile | 91.3% | 8.7% (to calm) | ~12 days |
How to read it:
- If the market is calm today, there is about a 97.6% chance it is calm tomorrow, and a calm spell lasts about 42 days on average.
- The chance of jumping from calm to volatile on any given day is only about 2.4%.
- If the market is volatile today, there is about a 91% chance it stays volatile. Once Nifty turns volatile, it tends to stay that way for about 12 days. This is the well-known effect called volatility clustering.
- The chance of switching back from volatile to calm is about 9%.
Key insight: Calm stays calm, and volatile stays volatile. Moods are persistent, which is exactly what makes them useful for planning trades.
Step 3: See the moods on the chart
What: Using these probabilities, the HMM labels each day with its most likely mood.
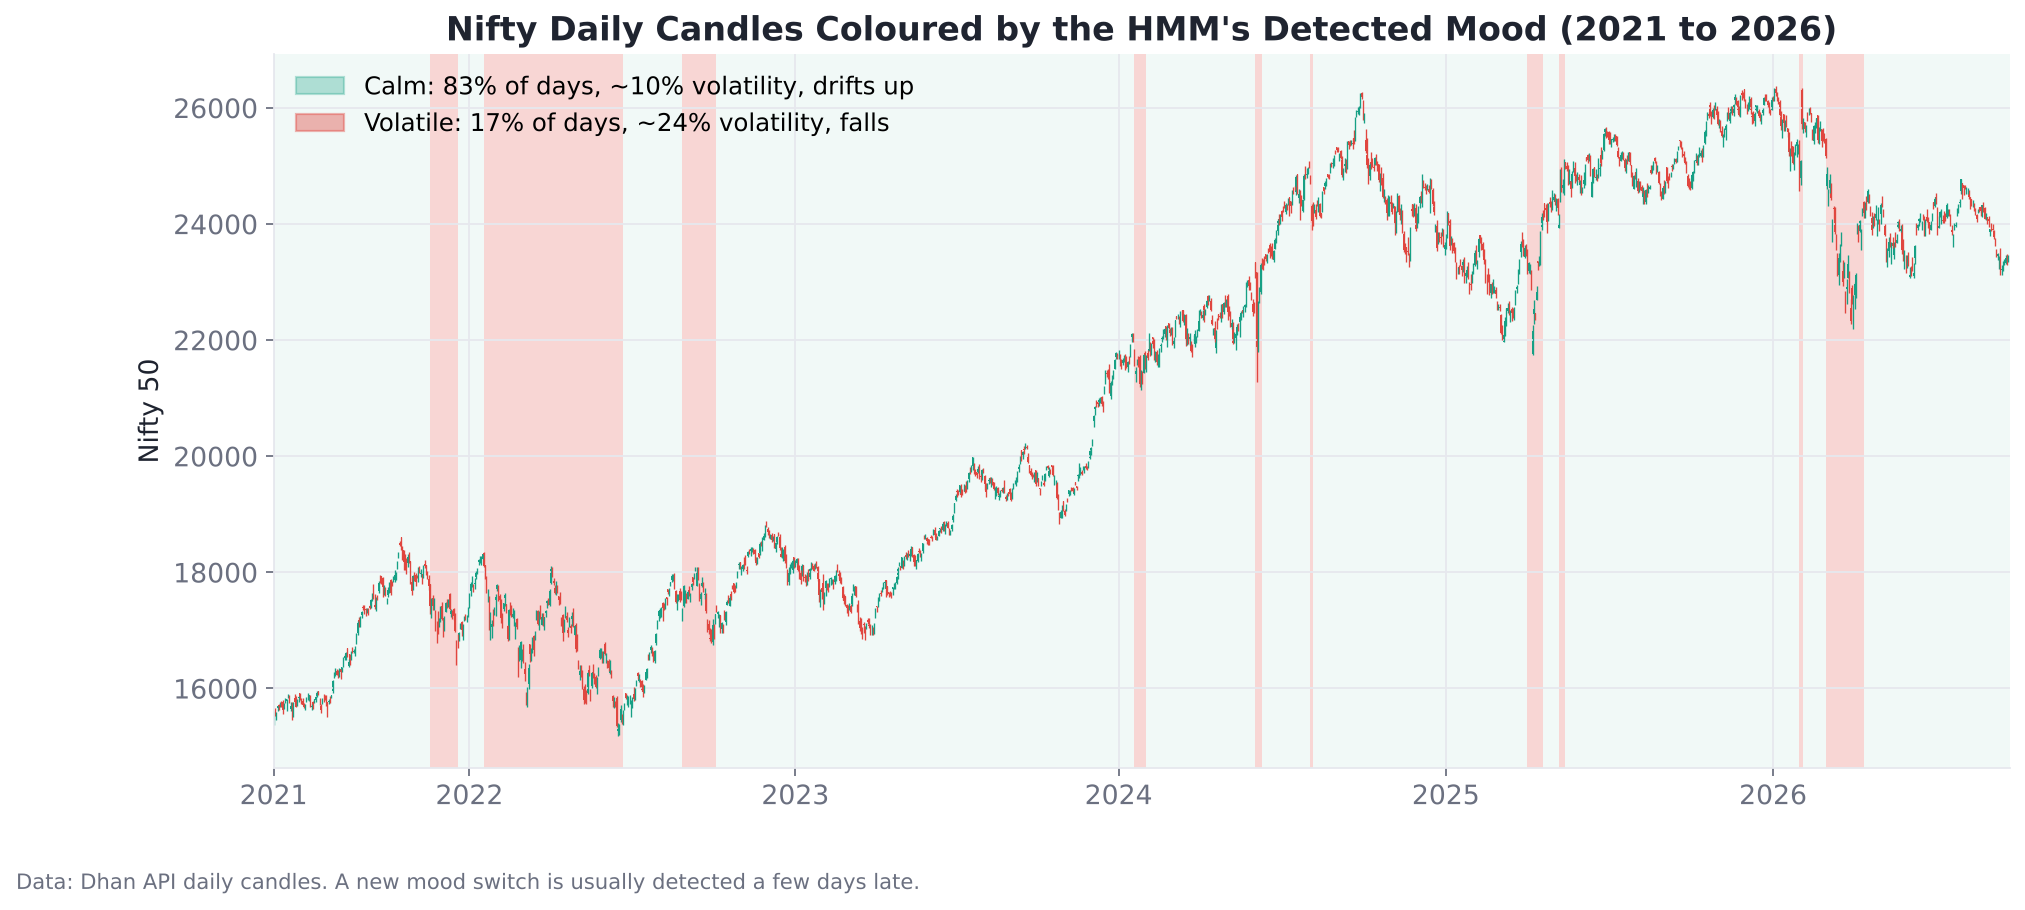
Figure 11: Nifty daily candles with calm periods (green) and volatile periods (red) as detected by the HMM.
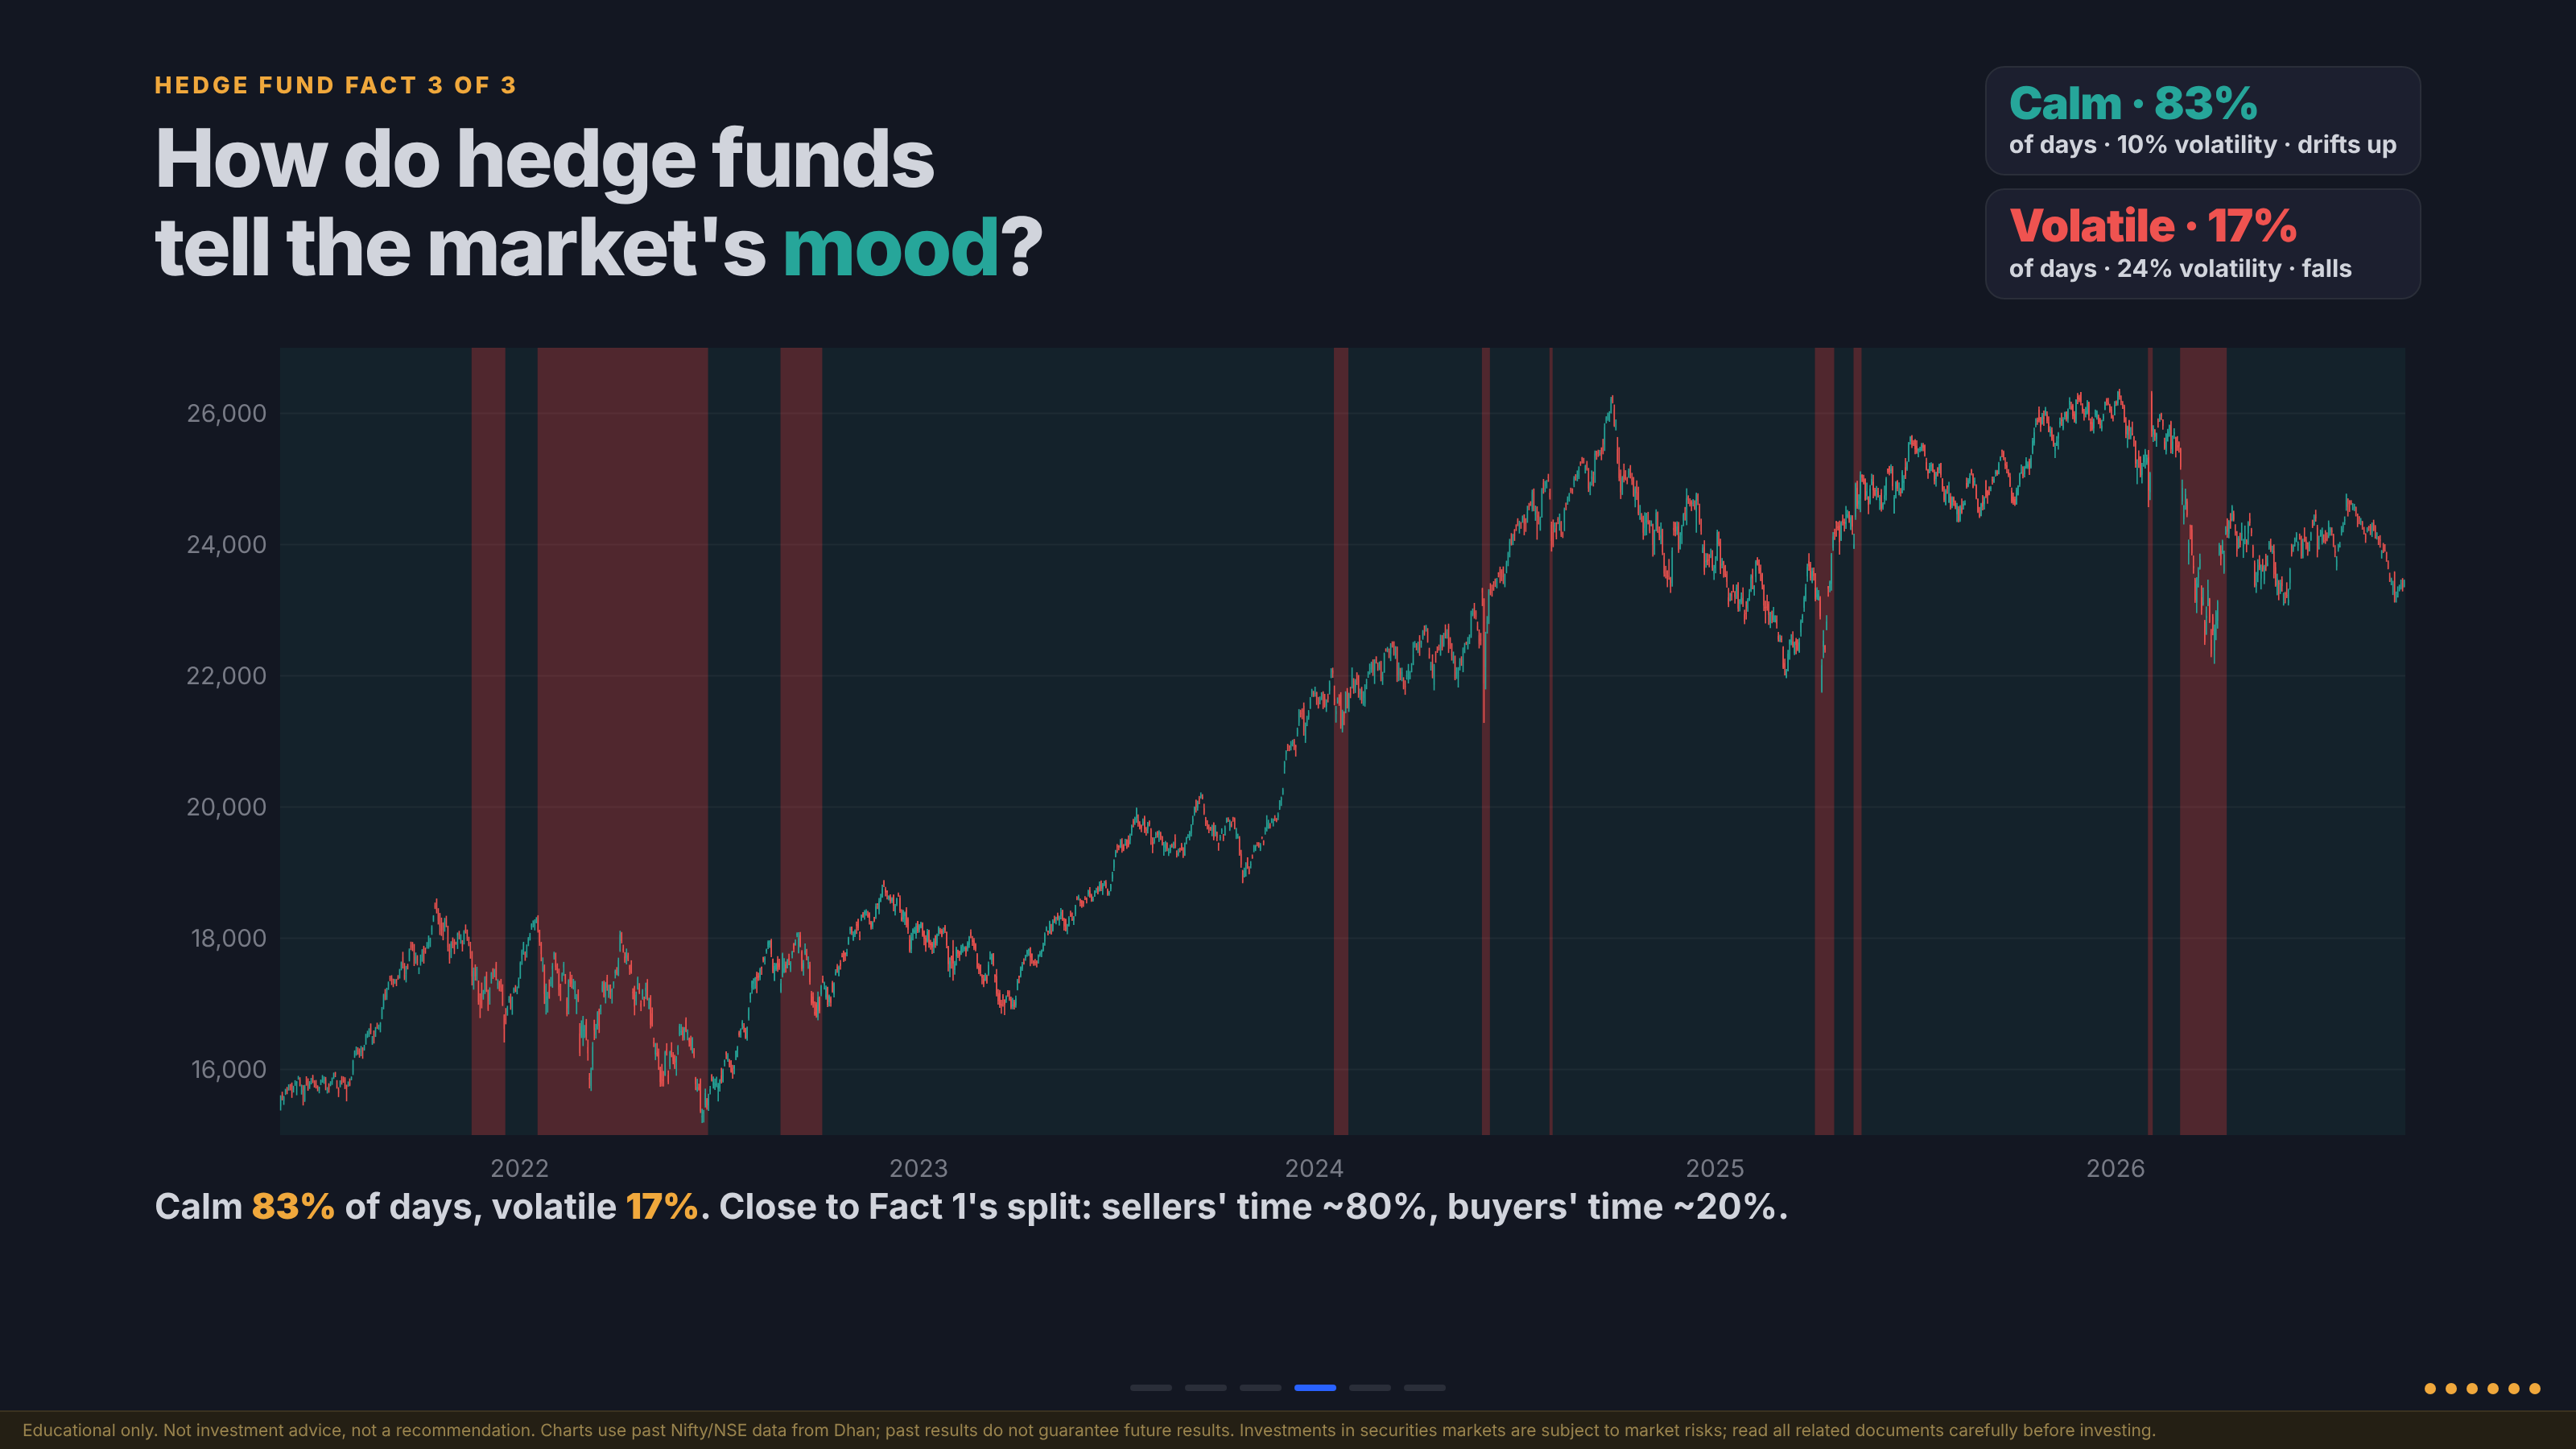
Slide 7: The moods the HMM finds on Nifty, as shown in the video: calm on 83% of days, volatile on 17%.
| Mood | Share of days | Annualised volatility | Typical direction |
|---|---|---|---|
| Calm | ~83% | ~10% | Drifts up |
| Volatile | ~17% | ~24% | Falls |
Expected result: The red zones line up with the market’s stressful stretches, such as early 2022 and March 2026, while most of the time Nifty sits in its calm state.
Warning: The HMM tells you the most likely current mood, not the future price. A fresh switch from calm to volatile usually shows up a few days late, so treat the model as context, not as a trade trigger.
Connecting the facts: The calm/volatile split (~83% / ~17%) is close to Fact 1’s split between sellers’ time (~80%) and buyers’ time (~20%). Calm markets tend to favour option sellers; volatile markets are where buyers have their chance.
How These Charts Were Built
Every chart in this guide uses real data from the Dhan API: Nifty daily candles, India VIX and the Nifty option chain, pulled with DhanHQ Skills. The analysis and charts were produced with Claude. There is no software to download here; these are concepts you can apply to your own trading.
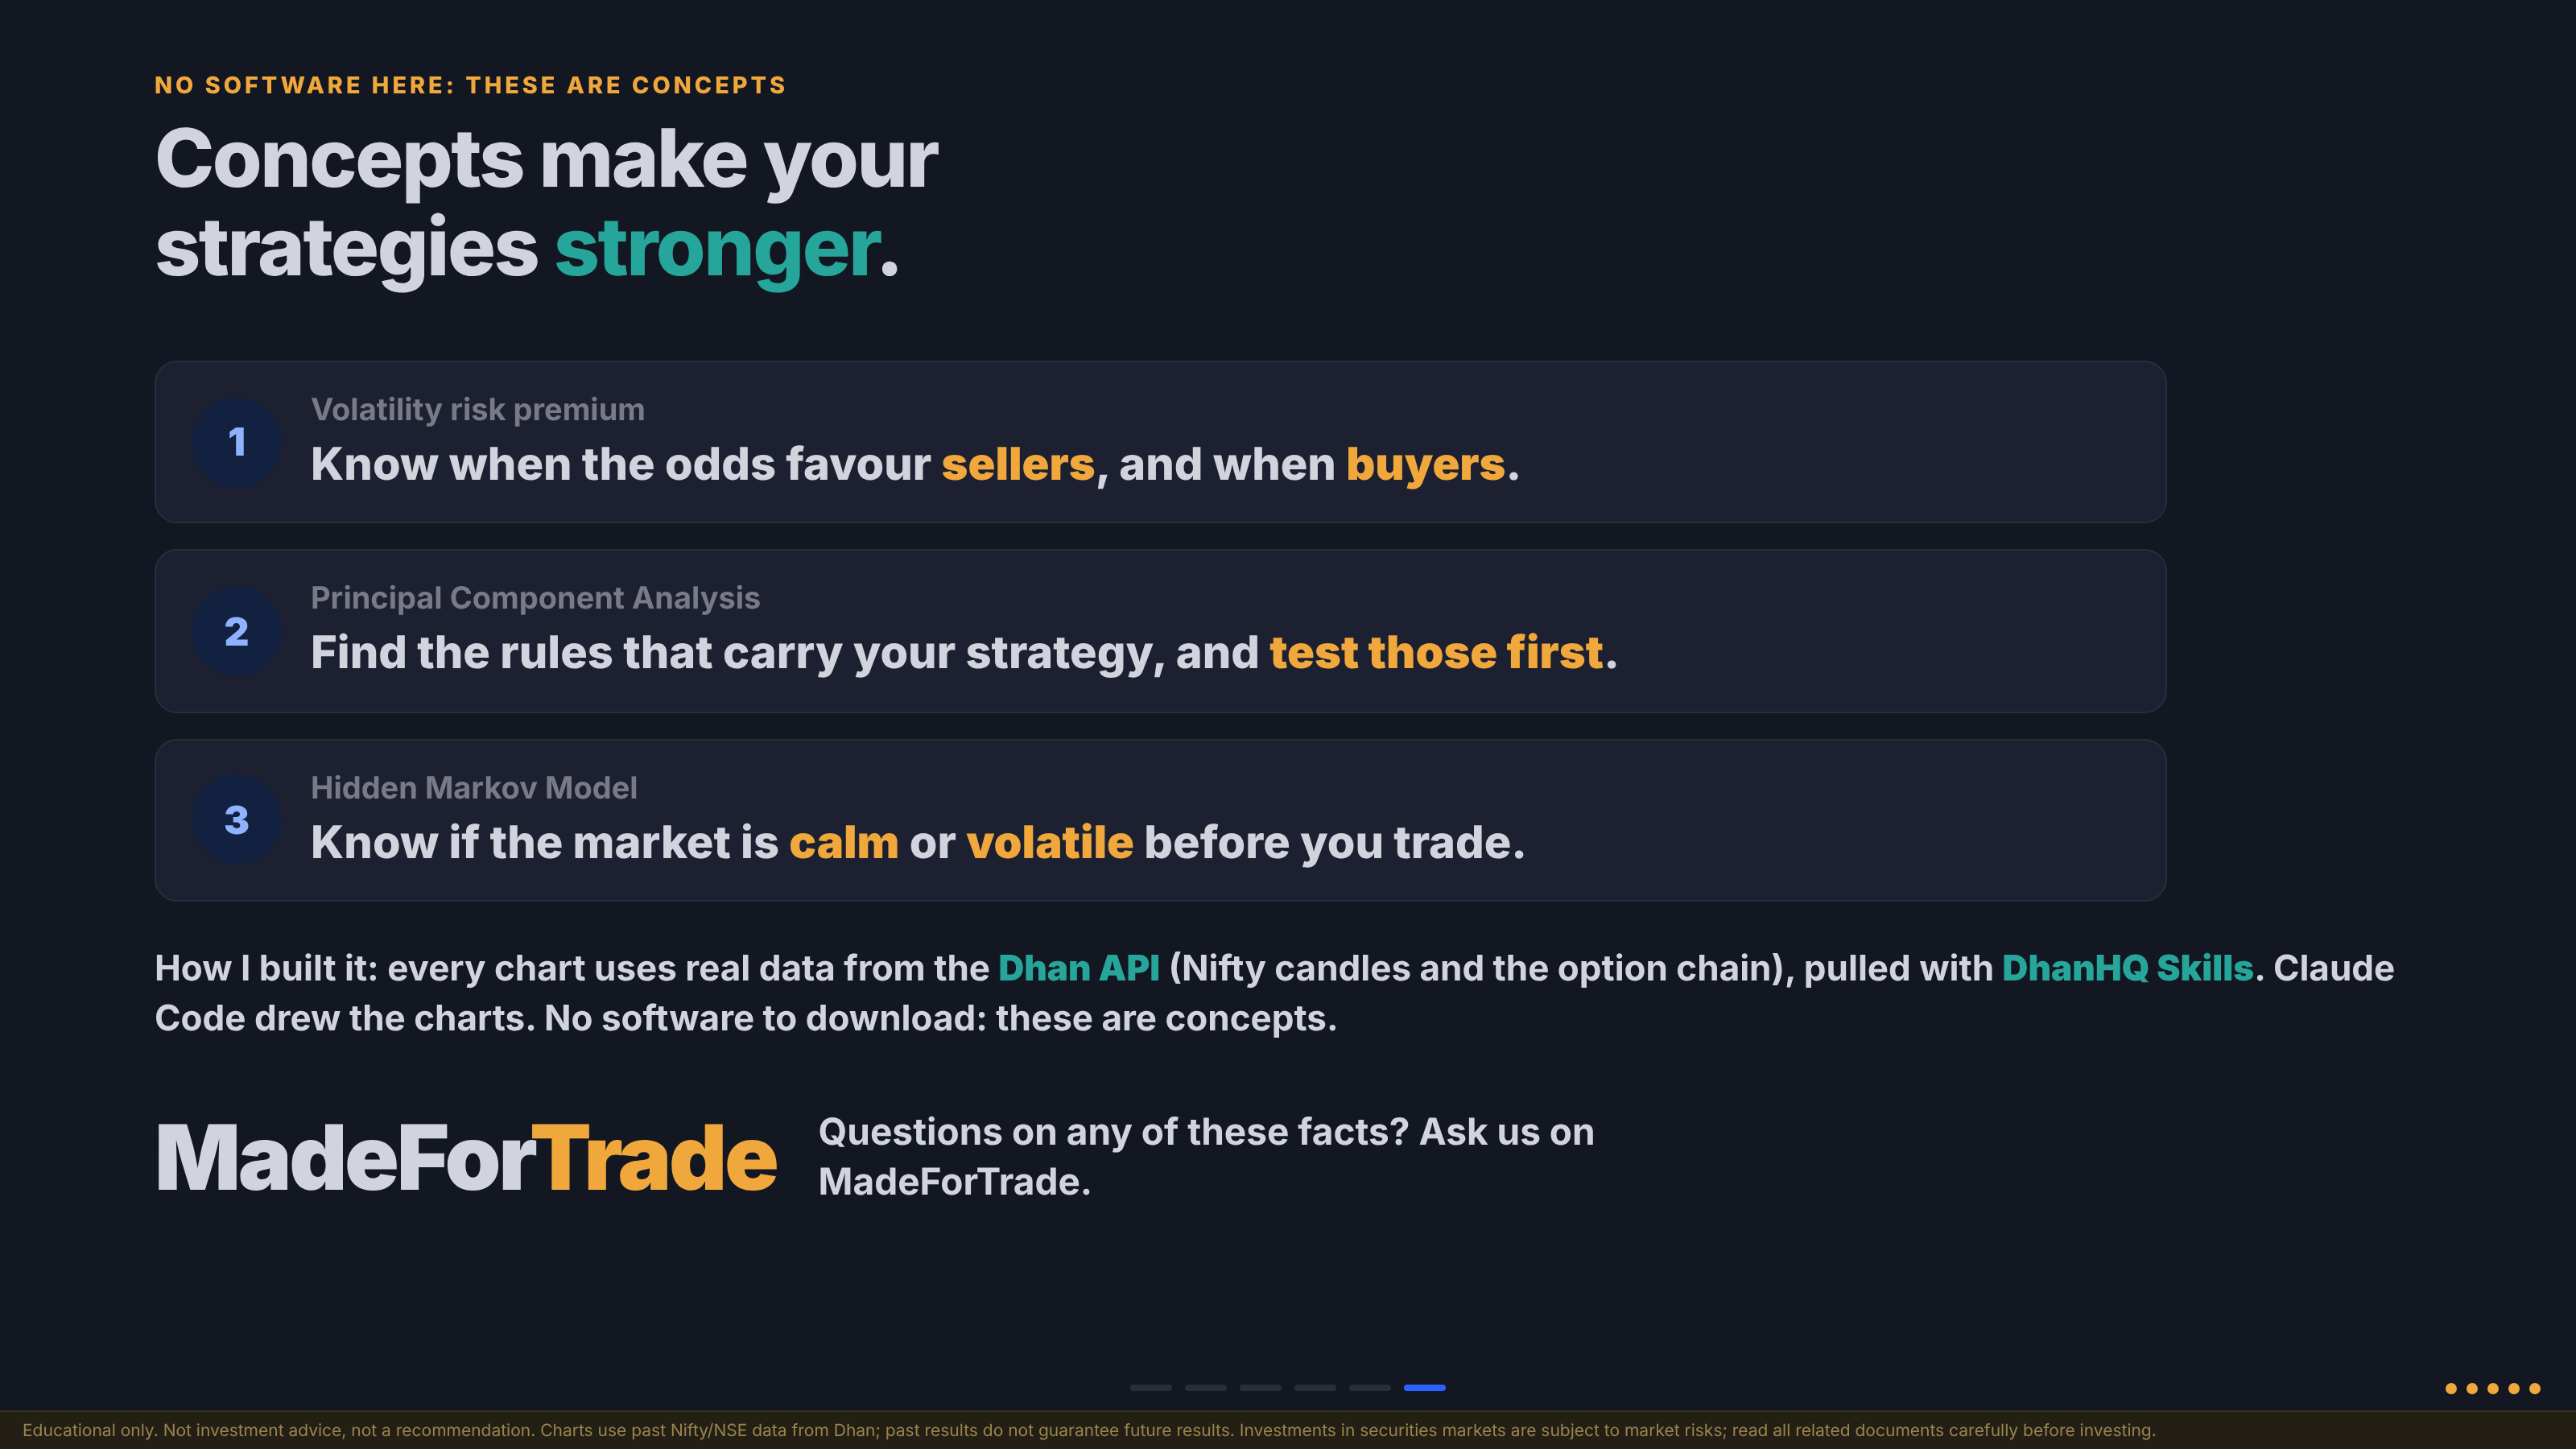
Slide 9: Concepts make your strategies stronger, and how the deck was built.
Summary
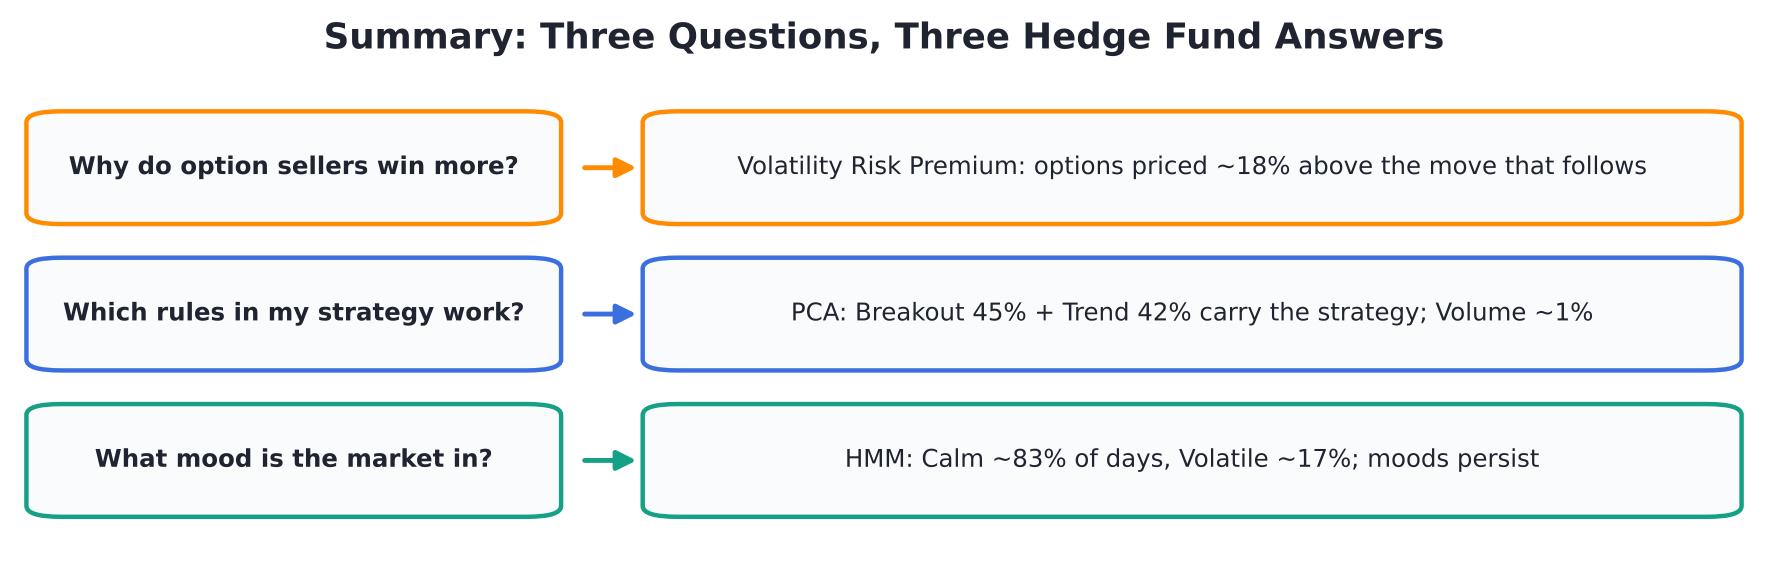
Figure 12: Three questions, three hedge fund answers.
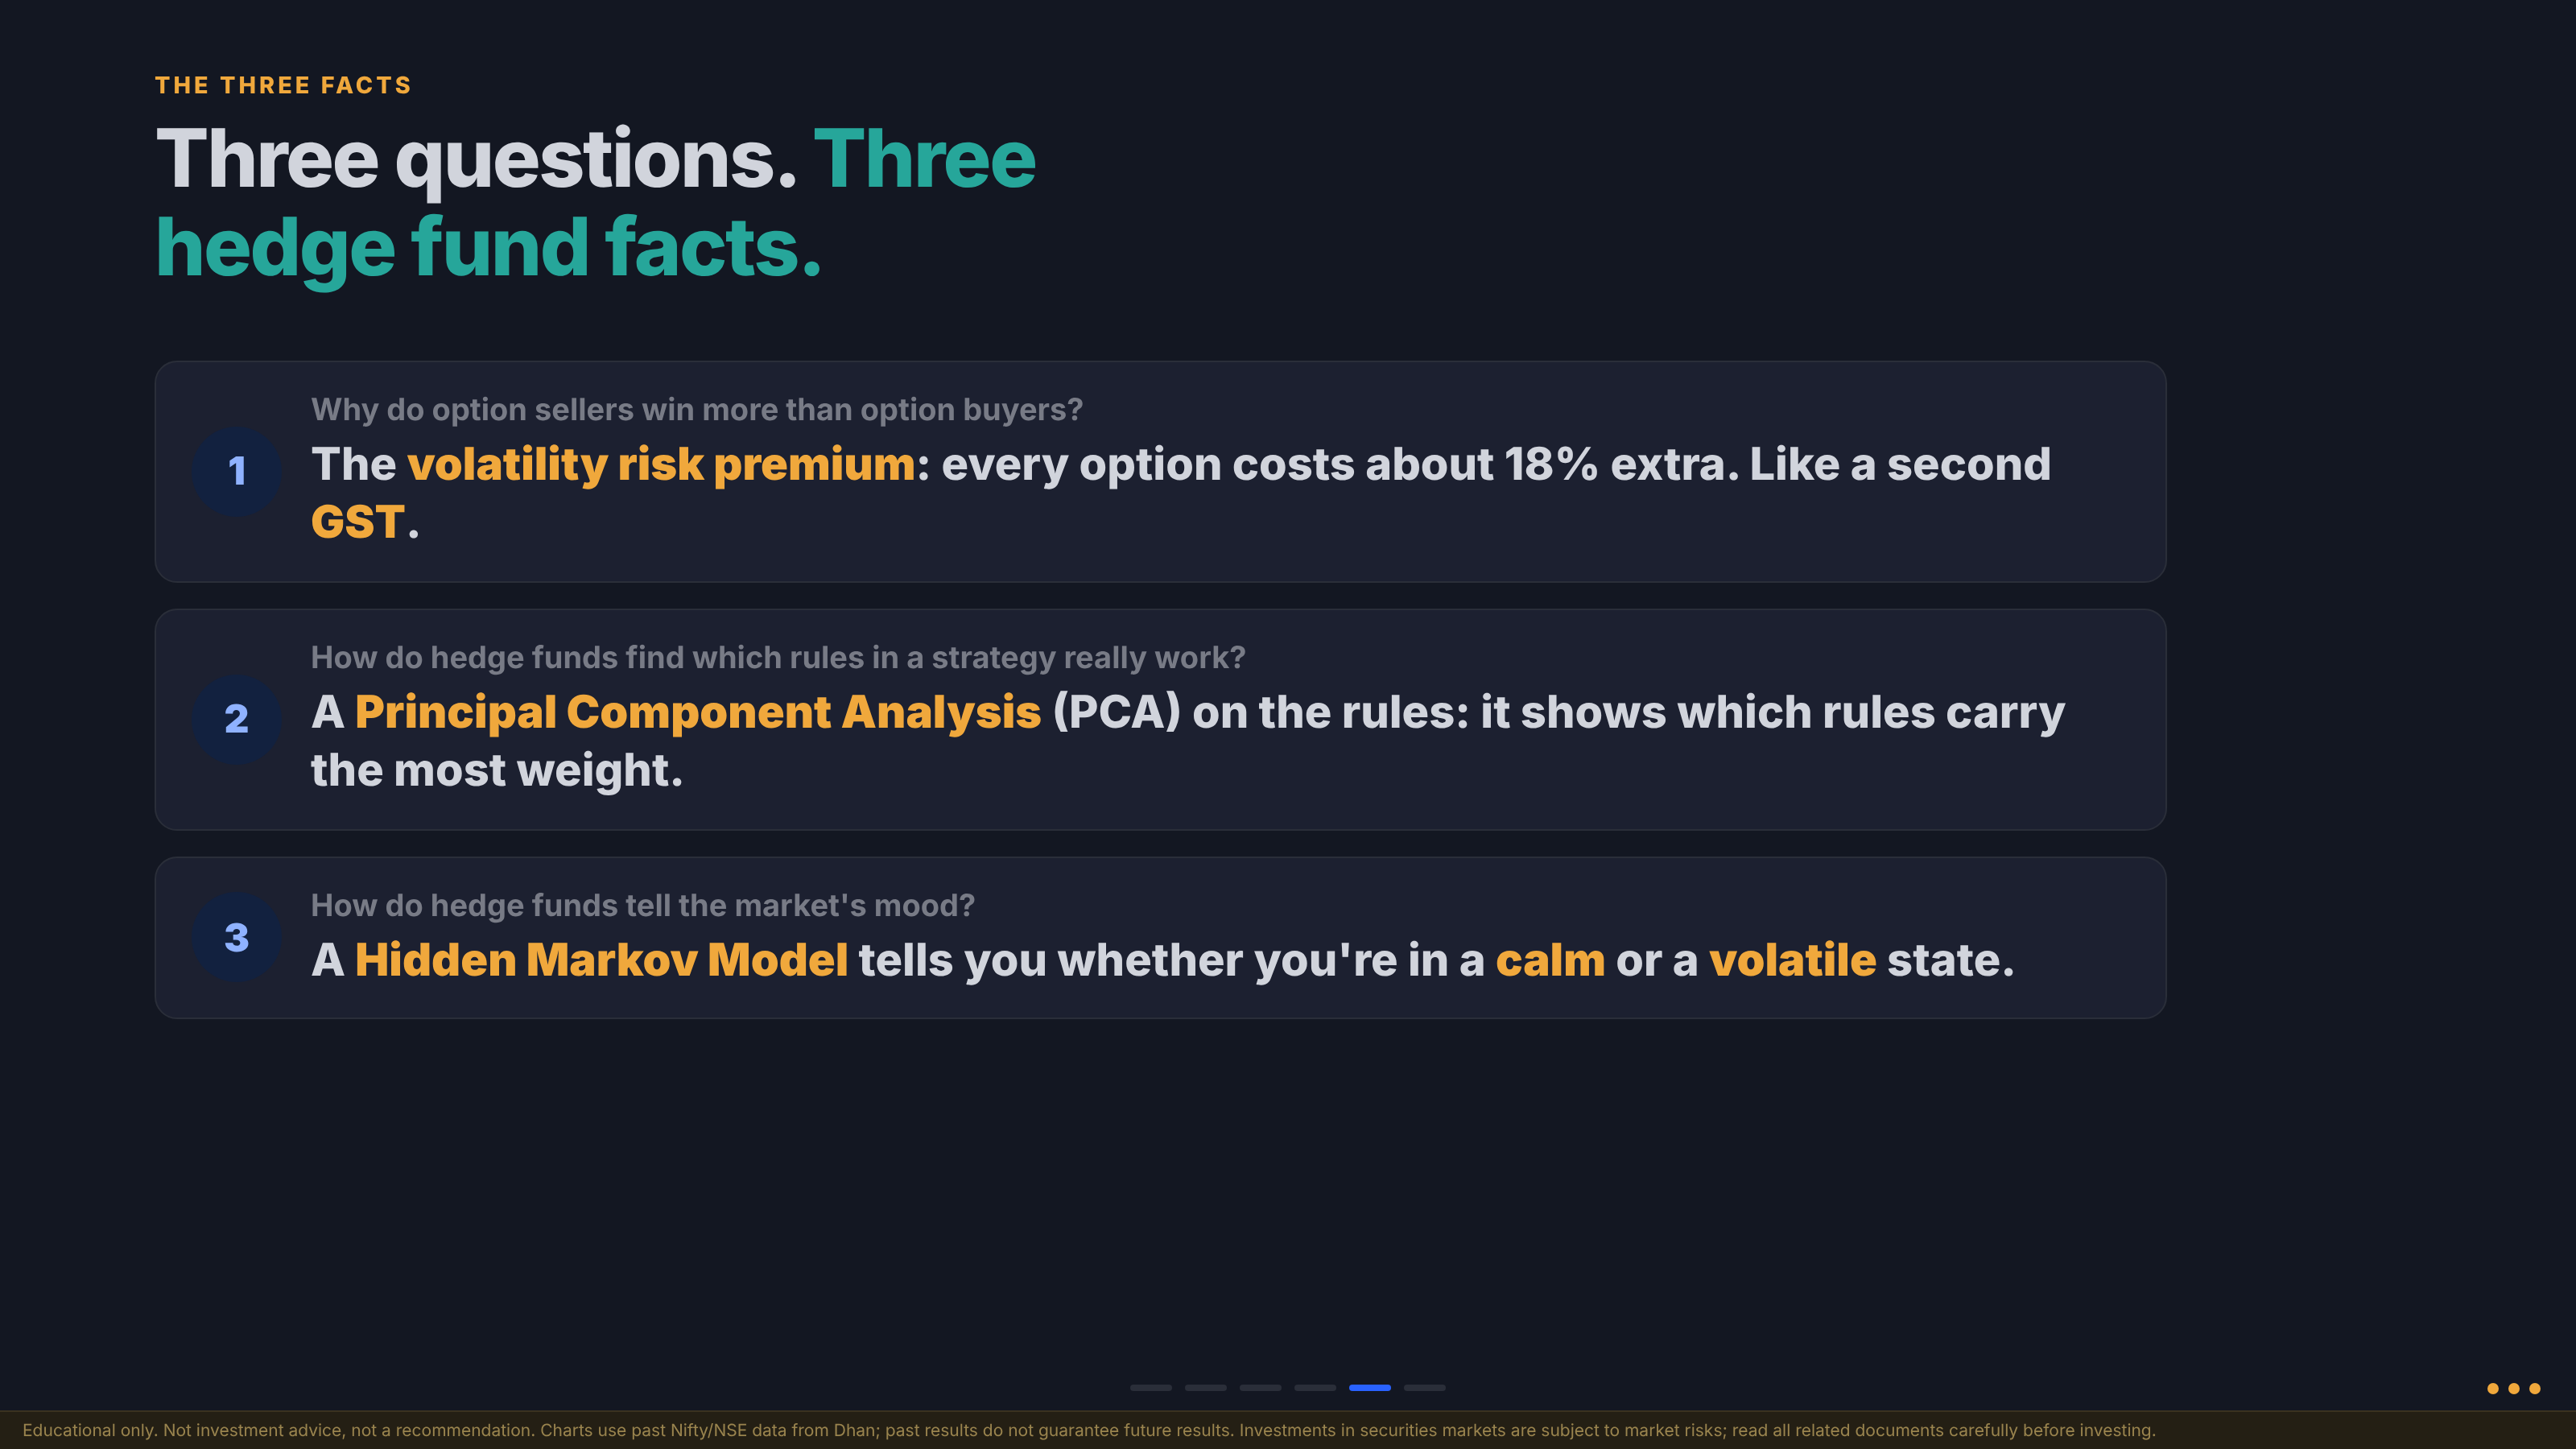
Slide 8: The recap slide from the video: three questions, three hedge fund answers.
- Fact 1, Volatility Risk Premium: Options are usually priced above the move that follows. On Nifty, sellers’ time was about 80% of days, and today’s ATM straddle was about 18% above its historically fair value. Sellers win often; buyers win rarely but big.
- Fact 2, Principal Component Analysis: Strategy rules are rarely equal. In our example, Breakout (~45%) and Trend (~42%) carried the strategy, while Volume added almost nothing. Know the concept, and let AI run the maths.
- Fact 3, Hidden Markov Model: The market switches between a calm mood (~83% of days) and a volatile mood (~17%), and each mood tends to persist. Knowing the current mood helps you decide when to trade calmly and when to be careful.
Concepts make your strategies stronger. If you have questions on any of these facts, you can ask the team on MadeForTrade.
Disclaimer: Educational only. Not investment advice, not a recommendation. Charts use past Nifty/NSE data from Dhan; past results do not guarantee future results. Investments in securities markets are subject to market risks; read all related documents carefully before investing.
Resources
- YouTube video: https://youtu.be/huezgWr2QeI?si=kJ90V-zKohcvQ7bV