@Imram sir,
I am using 5 min green/red candle, RSI pattern for call/put buying with sym as a F&O stock symbol.
# ---------- ENTRY ----------
for _, row in df.iterrows():
if not is_entry_window() or len(positions) >= MAX_TRADES:
break
sym = row["Symbol"]
print(f"\nChecking {sym}")
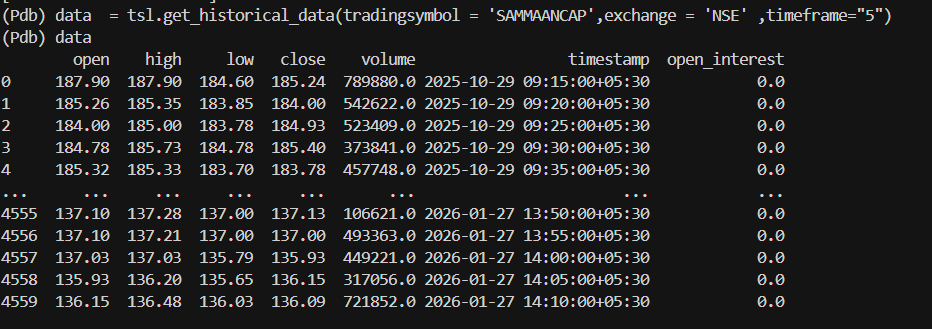
chart = tsl.get_historical_data(tradingsymbol=sym,exchange="NSE",timeframe="5")
chart['rsi'] = talib.RSI(chart['close'], timeperiod=14)
sqn_lib.sqn(df=chart, period=21)
chart['market_type'] = chart['sqn'].apply(sqn_lib.market_type)
chart['atr'] = talib.ATR(chart['high'], chart['low'], chart['close'], timeperiod=14)
pc = chart.iloc[-1]
cc = chart.iloc[-2]
uptrend = cc['rsi'] > 60
downtrend = cc['rsi'] < 59
bc2 = len(positions) is None
bc3 = True # cc['market_type'] != "neutral"
bc4 = MAX_TRADES < 8
green_candle=cc['close'] > cc['open']
red_candle=cc['close'] < cc['open']
# upper_break = pc['low'] > cc['low']
# down_break = pc['low'] < cc['low']
if uptrend and bc2 and bc3 and bc4 and green_candle :
print("call-buy ", sym, "\t")
ce_name, pe_name, ce_otm_strike, pe_otm_strike = tsl.OTM_Strike_Selection(Underlying=sym, Expiry=1, OTM_count=1)
# ce_name, pe_name, strike = tsl.ATM_Strike_Selection(Underlying=sym, Expiry=0)
options_chart = tsl.get_historical_data(tradingsymbol=ce_name,exchange='NFO',timeframe="5")
options_chart['atr'] = talib.ATR(options_chart['high'], options_chart['low'], options_chart['close'], timeperiod=14)
lot_size = tsl.get_lot_size(tradingsymbol=ce_name)
qty = lot_size * MAX_LOTS
rc_options = options_chart.iloc[-1]
pty=qty/2
ltp = tsl.get_ltp_data(names=[ce_name])[ce_name]
base_sl = rc_options['atr'] * atr_multipler
target = round(ltp * 2.40,1)
entry_order=tsl.order_placement(tradingsymbol=ce_name,exchange="NFO",quantity=qty,price=0,trigger_price=0,order_type="MARKET",transaction_type="BUY",trade_type="MIS")
tg(f"BUY {sym}\nQty:{qty}\nSL:{base_sl}\nTarget:{target}")
sl_order = tsl.order_placement(tradingsymbol=ce_name,exchange="NFO",quantity=qty,order_type="STOPMARKET",price=base_sl-0.05,trigger_price=base_sl,transaction_type="SELL",trade_type="MIS")
getting below error : kindly guide with correct code.
Checking SAMMAANCAP
Exception in Getting OHLC data as {‘status’: ‘failure’, ‘remarks’: {‘error_code’: ‘DH-905’, ‘error_type’: ‘Input_Exception’, ‘error_message’: ‘System is unable to fetch data due to incorrect parameters or no data present’}, ‘data’: ‘’}
ERROR: ‘NoneType’ object is not subscriptable
Traceback (most recent call last):
File “D:\my-running-algo\new.py”, line 147, in
options_chart[‘atr’] = talib.ATR(options_chart[‘high’], options_chart[‘low’], options_chart[‘close’], timeperiod=14)
~~~~~~~~~~~~~^^^^^^^^
TypeError: ‘NoneType’ object is not subscriptable