Feature Request: Cyclical Seasonality Screener & Historical Swing Analytics for Dhan Web/App
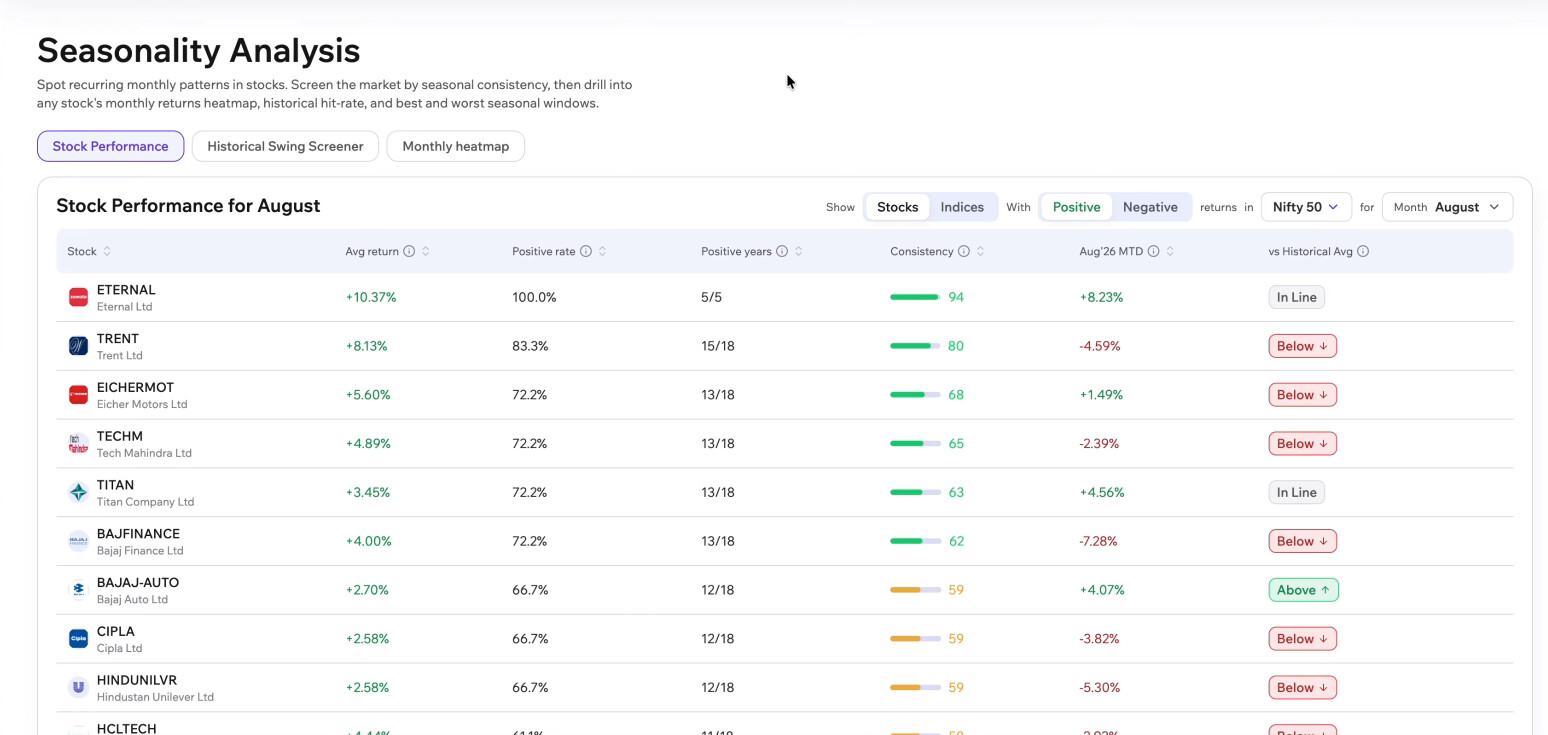
1. Calendar Month Seasonality Screener
- Historical Win-Rate Ratio: Ability to scan indices (Nifty 50, Nifty 500, F&O) and see the ratio of positive vs. negative closing years for any selected calendar month (e.g., TVS Motor delivering positive returns in 17 out of 19 past Septembers).
- Average & Median Returns: Automatically calculate historical average and median ROI percentages for individual months to gauge historical reward potential.
- Directional Filtering: Toggle views to isolate both top bullish performers and historically negative/weak performers for short setups.
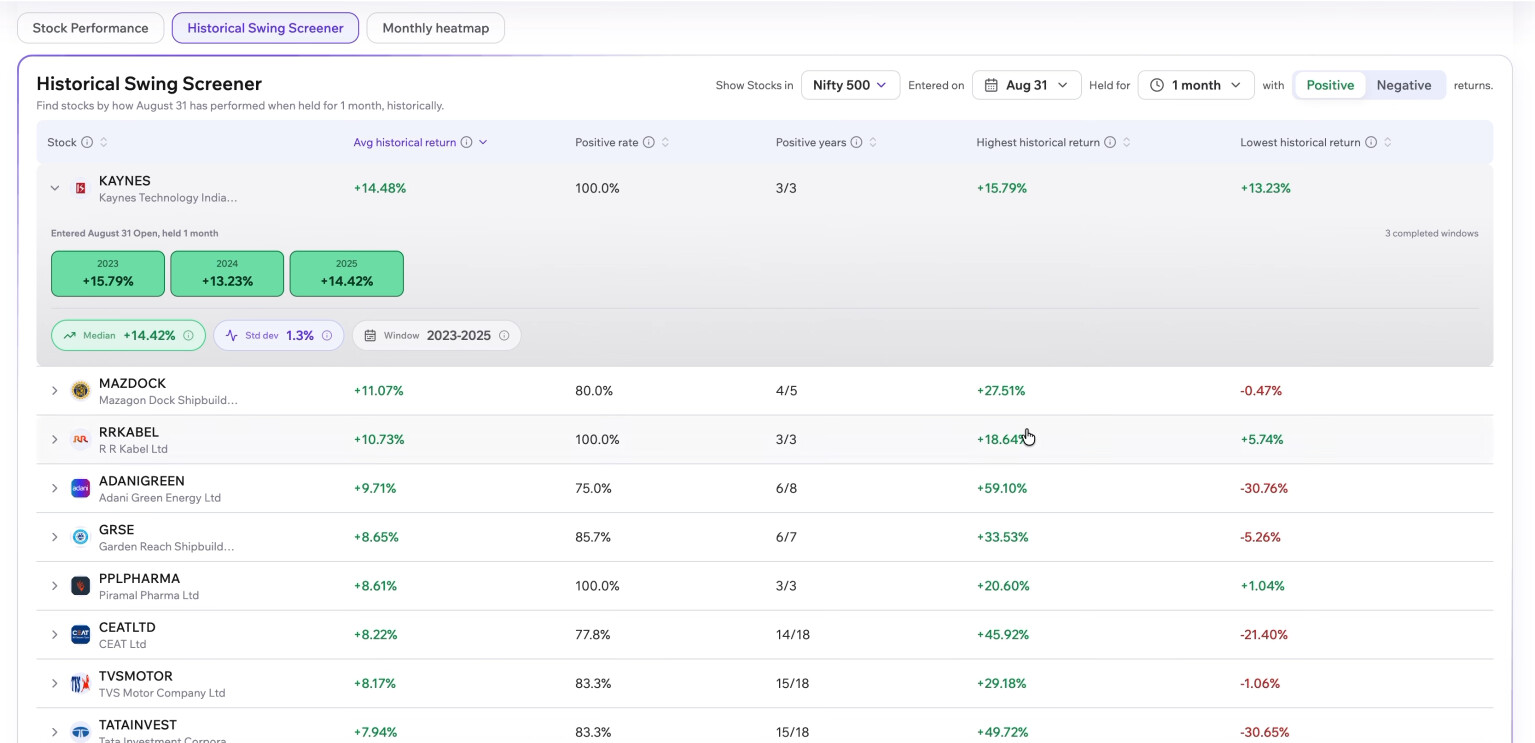
2. Multi-Timeframe Historical Swing Screener
- Custom Start Dates: Capability to select an entry date (e.g., 1st of the month) alongside a custom holding period defined in days, weeks, or months (e.g., 10 days, 3 weeks, or 1 month).
- Historical Holding Probability: Generate shortlists of stocks that achieved the highest probability of positive returns and highest average ROI over that exact holding duration across multi-year data.
3. Multi-Decade Return Heatmaps on Stock Pages
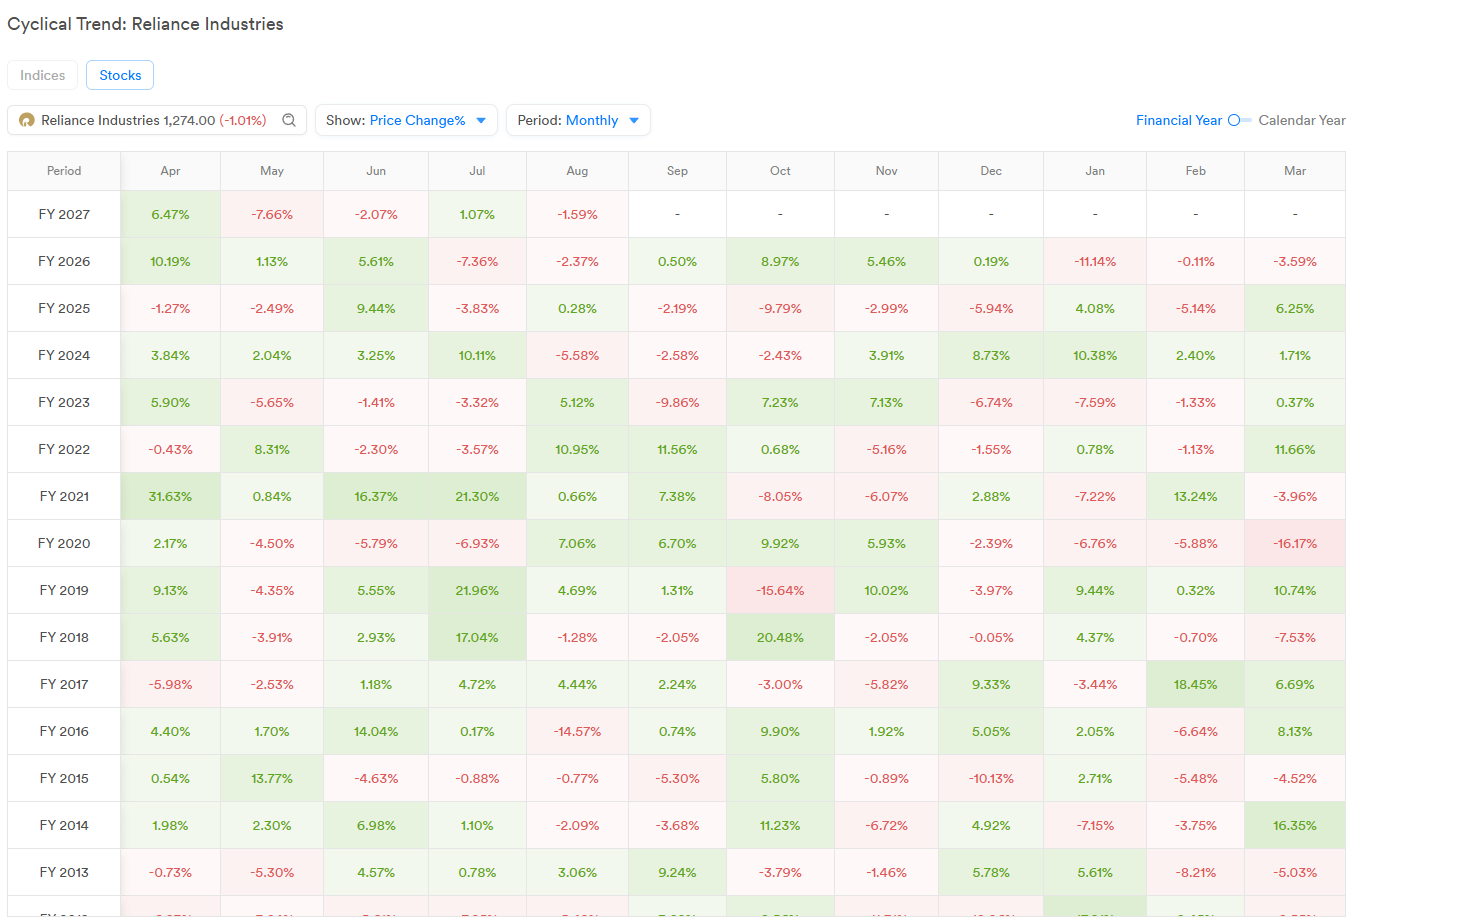
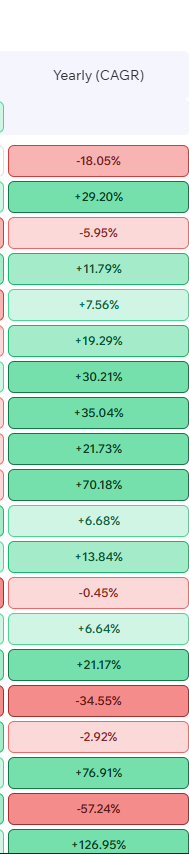
- Historical Monthly Grid: An interactive monthly return matrix displaying month-by-month historical percentage returns dating back to stock listing (e.g., 1994/2003 onwards).
- Best/Worst Month Identifiers: Automatic tagging of a stock’s historically best-performing and worst-performing months directly on the Dhan scrip overview page to assist swing entries alongside technical setups.