Hi @Everyone,
A practical guide to switching between fear-based and calm-based options strategies on Dhan using India VIX — with live PnL Driver analysis
Introduction
Every algo trader eventually hits the same wall: a strategy that worked beautifully for a few weeks or months suddenly stops working. It isn’t that the strategy was “wrong” — it’s that the market’s nature changed, and the strategy never adapted.
Markets move between three broad states — bullish, bearish, and sideways — and more fundamentally, they oscillate between two emotional states:
- Fear rising — uncertainty, panic, and volatility increasing
- Calm and confidence — steady moves, positive news flow, low volatility
A strategy built for calm markets will bleed money in a fear-driven crash, and a strategy built for panic will underperform in a quiet, trending market. The fix isn’t to find one “holy grail” strategy — it’s to build two complementary strategies and switch between them based on what the market is actually telling you.
This guide walks through exactly that: a two-strategy framework built around India VIX, NIFTY price action, and the Supertrend indicator, demonstrated live on Dhan’s Strategy Builder and PnL Driver tools.
Disclaimer: Investments in the securities market are subject to market risk. Please read all related documents carefully before investing. This article is for educational purposes only and is not investment advice.
Why One Strategy Can Never Work Forever
When the market’s character changes — say, from a steady bull run to a sudden volatility spike triggered by global news — the strategy that worked before needs to change with it. Traders who ignore this and expect one system to run “automatically forever” are set up to be run over by the market eventually.
The solution demonstrated here uses India VIX as the master signal that tells you which of the two market states you’re in, and switches the options strategy accordingly.
The Core Signal: Reading NIFTY Together With India VIX
India VIX measures the market’s expected volatility over the next 30 days — in plain terms, it’s a fear gauge. When traders expect turbulence, VIX rises. When the market feels safe, VIX falls.
The key habit this strategy asks you to build is simple but easy to skip: never look at the NIFTY chart alone. Always place the NIFTY chart and the India VIX chart side by side and read them together.
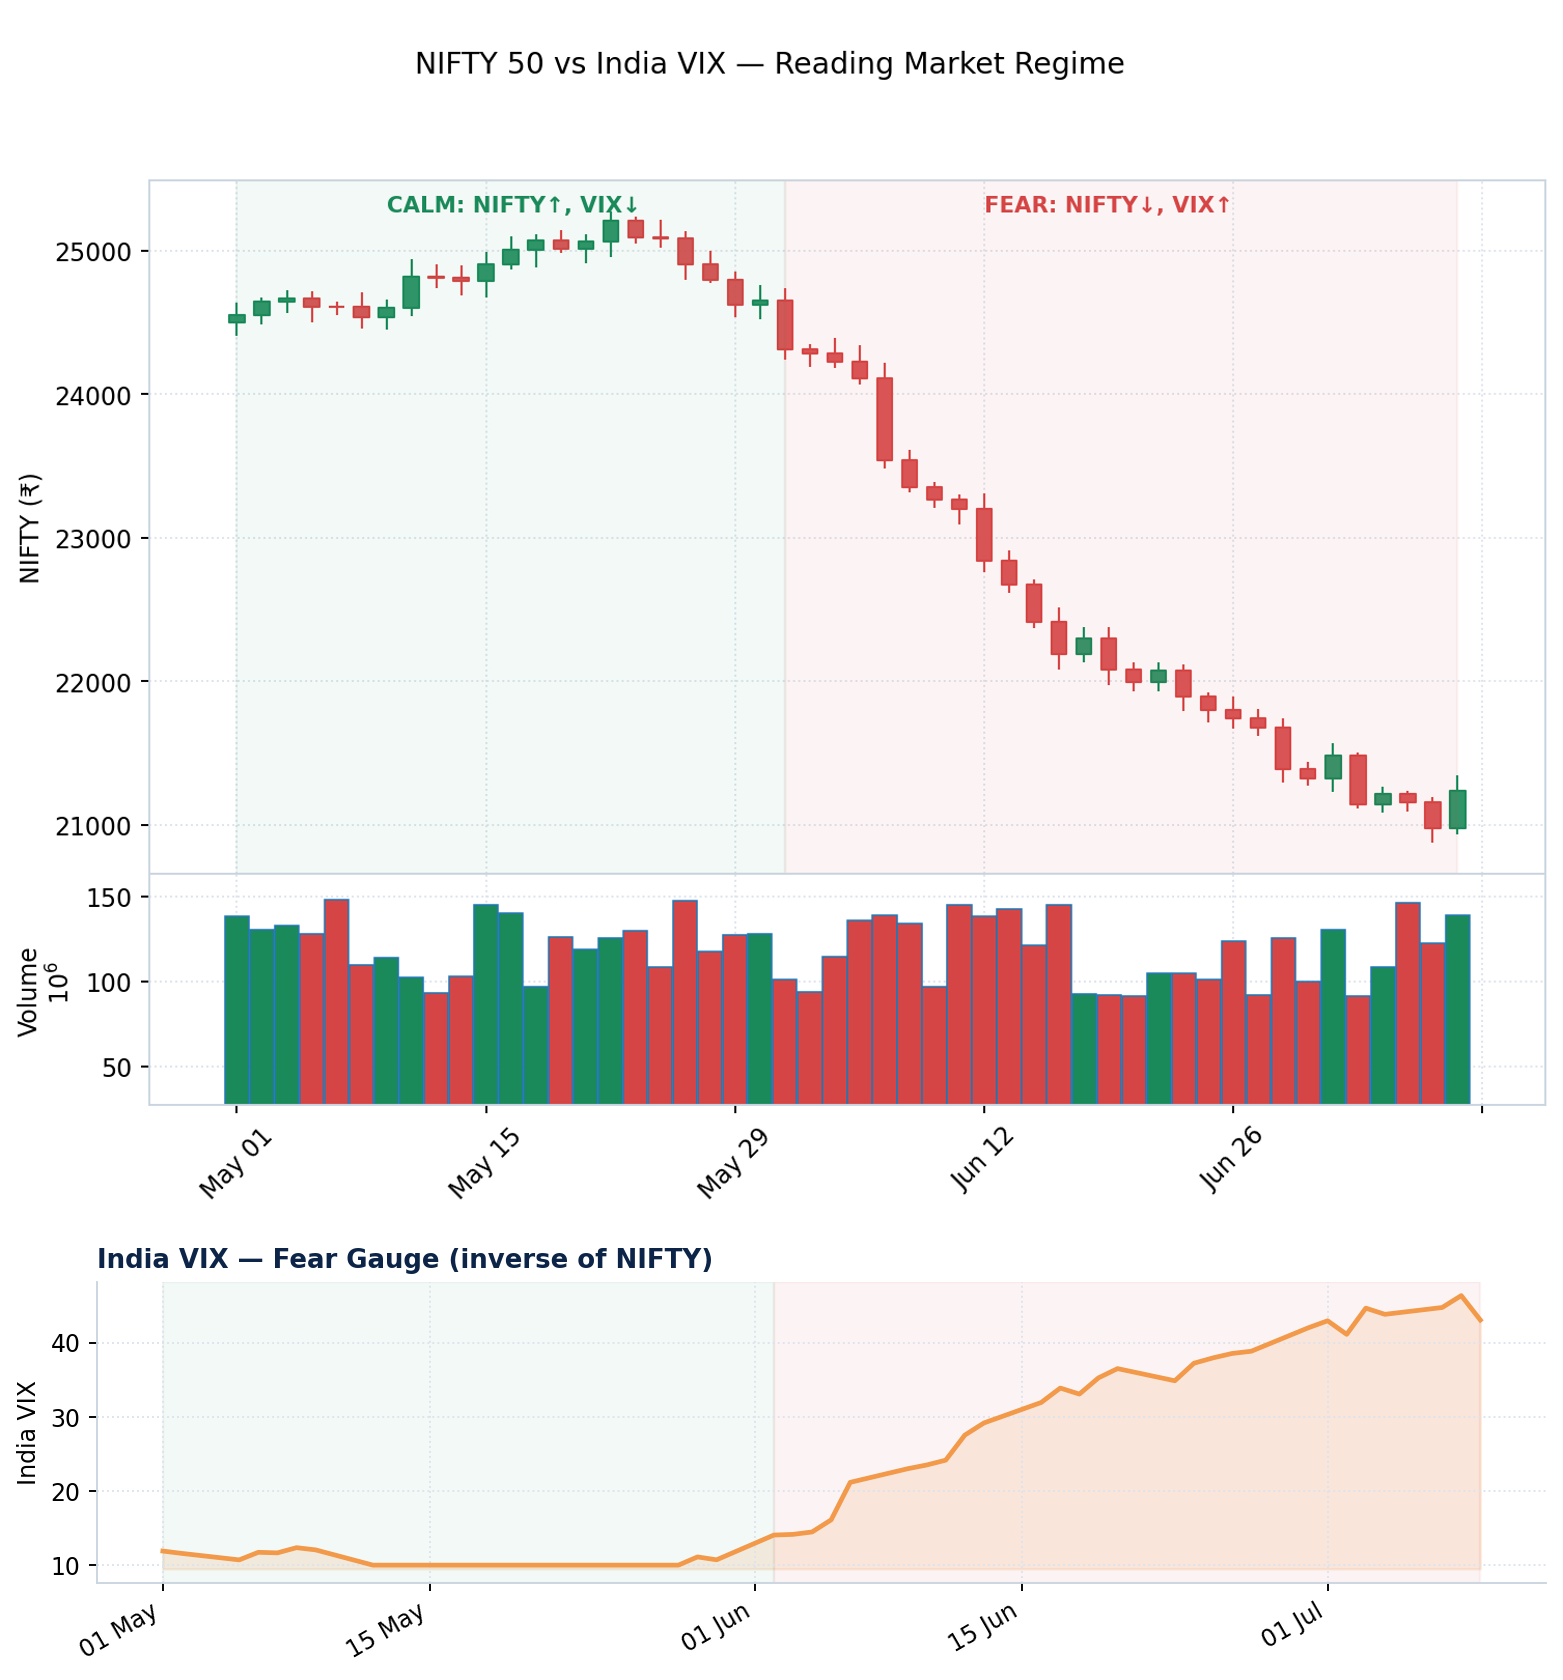
Figure 1: NIFTY and India VIX plotted together. Notice how VIX rises as NIFTY falls (fear) and falls as NIFTY rises (calm) — this inverse relationship is the entire basis of the regime signal.
There are only two combinations that matter for this framework:
| NIFTY Direction | India VIX Direction | Market Regime | What It Means |
|---|---|---|---|
| Falling | Rising | Fear | People are scared; uncertainty is priced in |
| Rising | Falling | Calm | People are confident; volatility is being sold off |
Once you can label the current regime, the strategy choice becomes mechanical.
Strategy 1: Trading the Fear Regime with ATM Put Buying
What Signals a Fear Regime
You’re in a fear regime when:
- NIFTY candles are red / trending down, and
- India VIX is climbing
This combination confirms that the fall in NIFTY isn’t just noise — the market is genuinely pricing in more risk.
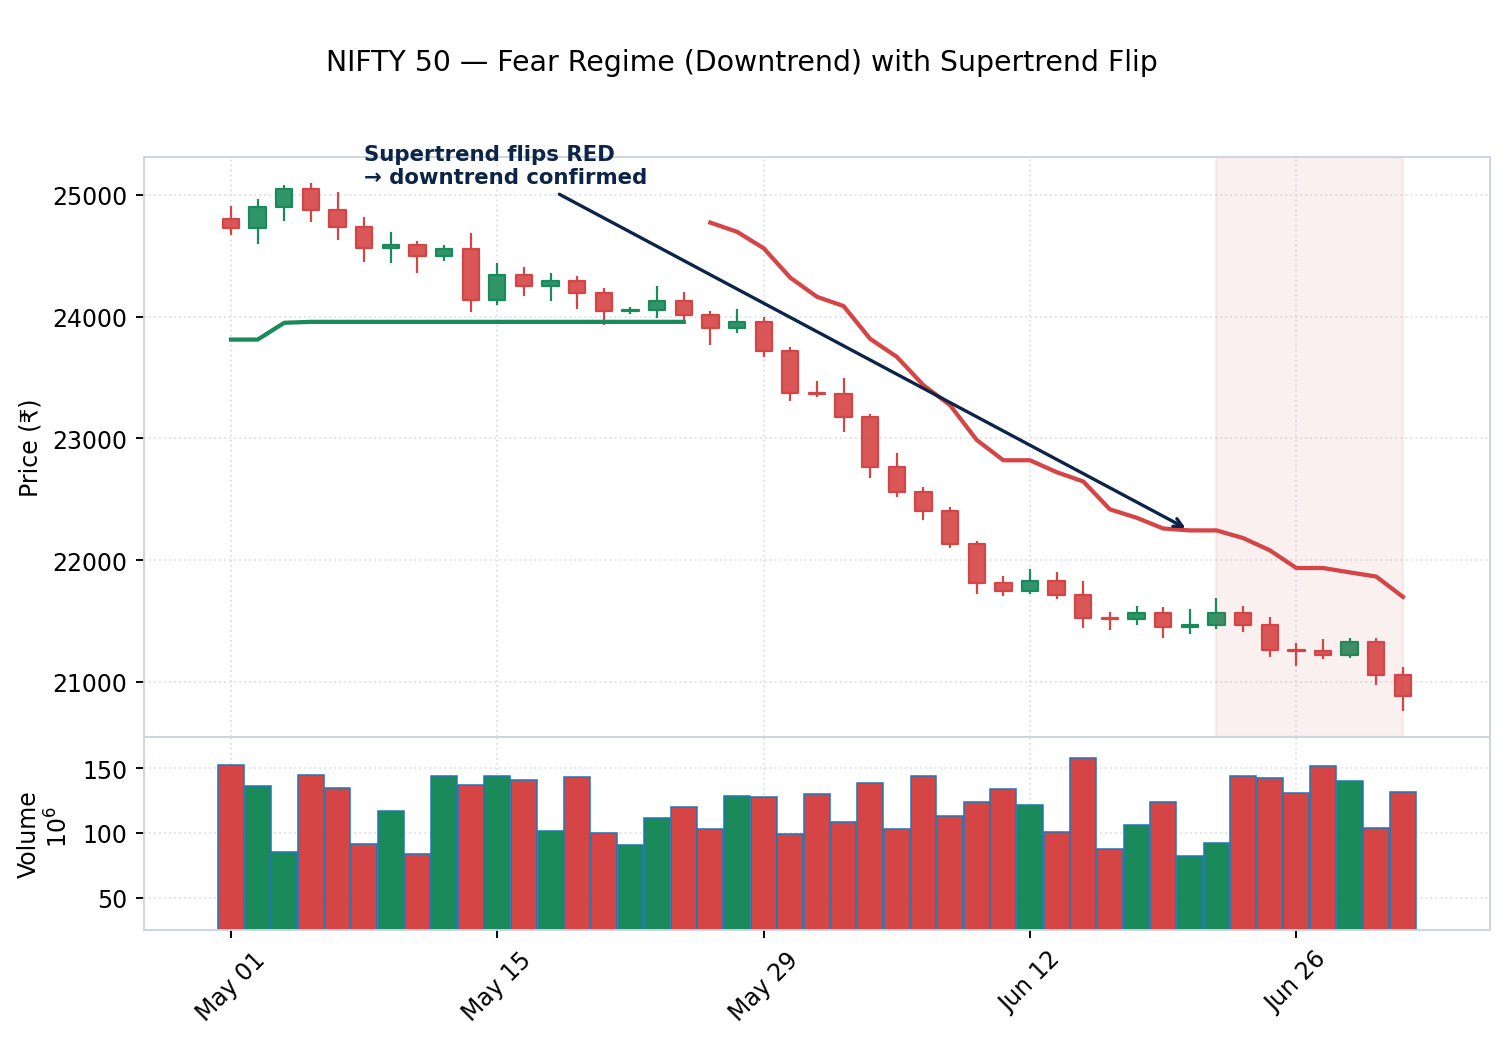
Figure 2: A textbook fear-regime candlestick chart. Price makes a sustained move lower and the Supertrend line flips from green to red, confirming the downtrend that aligns with rising India VIX.
The Trade: At-the-Money (ATM) Put Buying
When fear is building, the strategy is to buy an at-the-money put option. This is deliberately simple — no far strikes, no complex spread — because the goal is to capture two things happening at once:
- Direction — if NIFTY keeps falling, the put gains intrinsic value
- Volatility (Vega) — if India VIX keeps rising, implied volatility (IV) rises with it, and the option’s premium gets an additional boost from Vega — independent of direction
Tip: India VIX is being used here as a live proxy for the IV embedded in NIFTY option premiums. When VIX rises, IV on your option typically rises too, which directly benefits a long option position through Vega.
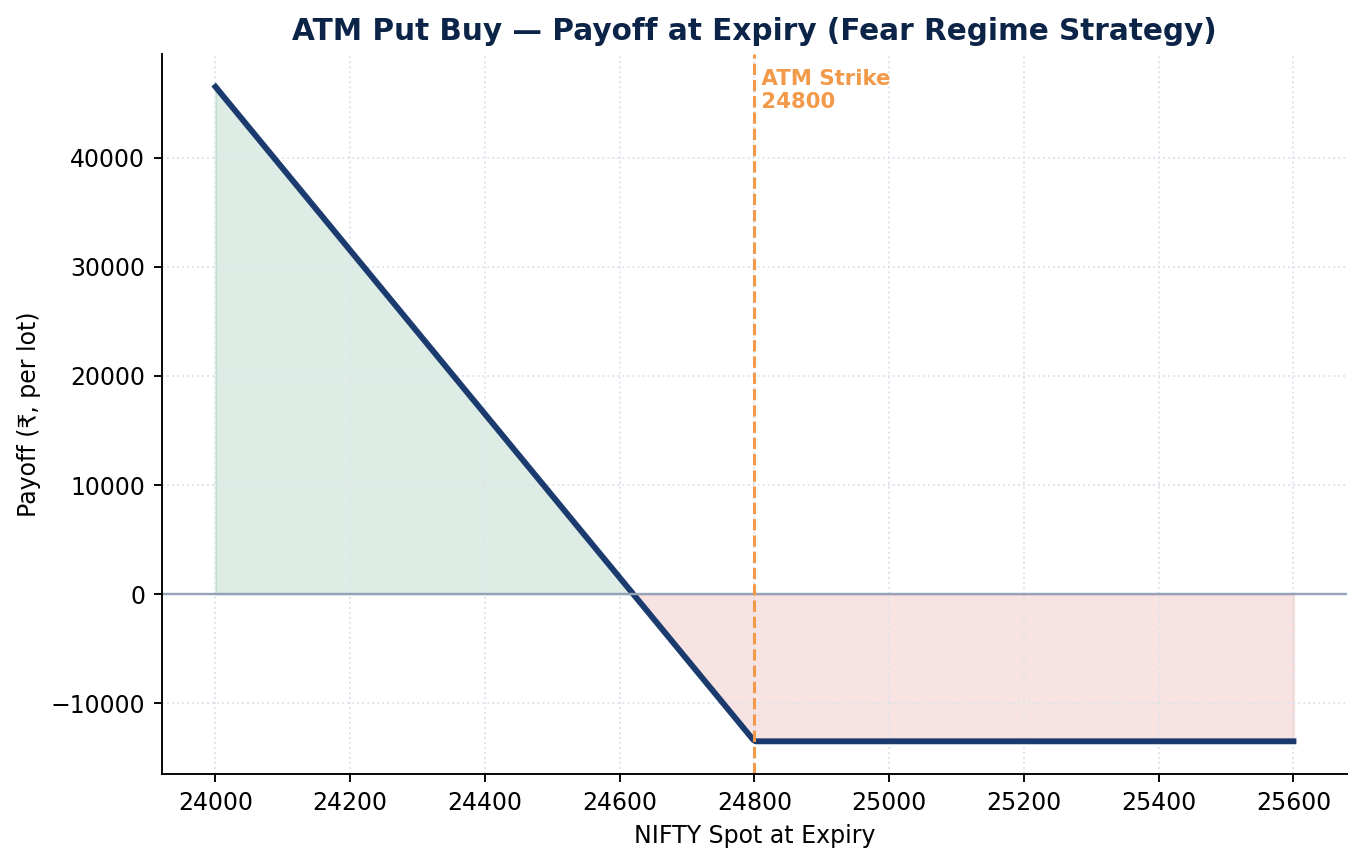
Figure 3: Payoff diagram for the ATM Put Buy. Profit accelerates as NIFTY spot falls further below the strike at expiry; maximum loss is capped at the premium paid.
Reading the Trade with Dhan’s PnL Driver
This is the part of the workflow worth understanding deeply, because it explains why a trade made money — not just that it made money.
In the example walked through on Dhan’s DEX Terminal, an ATM put position showed a total PnL of roughly ₹4,500. Opening the PnL Drivers panel breaks this number down by the underlying option Greeks:
| Greek | Contribution | Why |
|---|---|---|
| Delta | ≈ ₹4,000 | NIFTY moved down as predicted — direction was correct |
| Gamma | ≈ ₹700 | Gamma also reinforces the directional gain as price accelerates |
| Vega | ≈ ₹2,400 | India VIX rose, IV rose with it, adding pure volatility profit |
| Theta | ≈ −₹550 | Time decay worked against the long option, as expected |
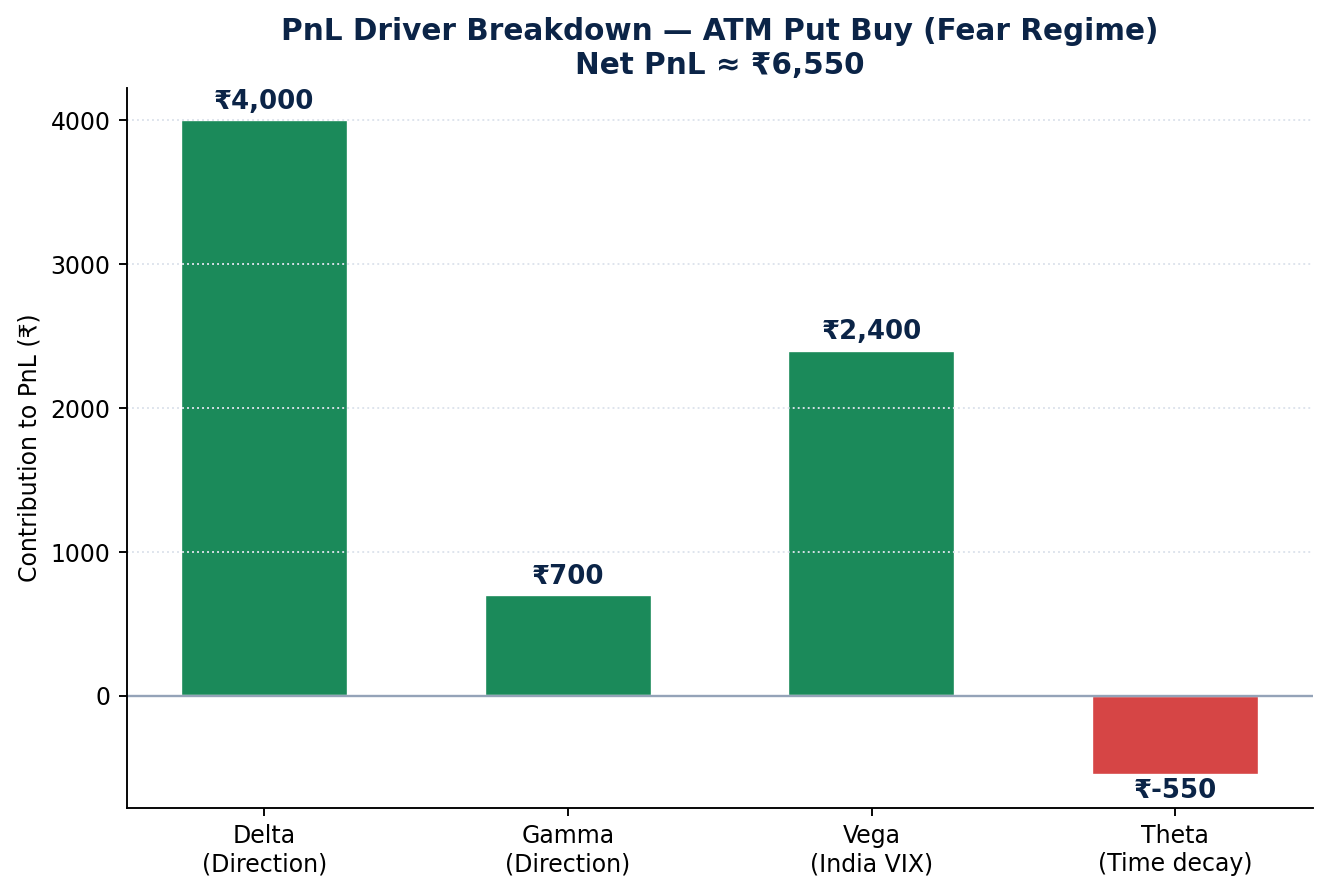
Figure 4: PnL Driver breakdown for the fear-regime ATM Put Buy. Direction (Delta + Gamma) and volatility (Vega) both contributed positively, while Theta was the only drag — exactly what you’d expect from a long option in a rising-VIX environment.
Note: Gamma and Vega are more advanced option Greeks. This guide intentionally keeps the explanation at a practical level — if there’s demand to go deeper into option Greeks and how they interact in strategy design, that deserves its own dedicated article.
This is the core insight: in a fear regime, a long put doesn’t just profit from direction — it profits twice, once from the price move and once from the volatility expansion. That’s why this is the preferred structure when VIX is climbing.
If you’re an option seller rather than a buyer, the equivalent fear-regime trade is selling an ATM call, which benefits from the same downward directional bias.
Strategy 2: Trading the Calm Regime with a Bull Put Spread
What Signals a Calm Regime
The moment the “fear” starts fading — NIFTY turns green, news flow turns positive, portfolios across the board are in profit — is the moment to switch strategies entirely. Running a fear-regime strategy into a calm market is exactly the mistake that causes previously-profitable systems to stop working.
You’re in a calm regime when:
- NIFTY candles are green / trending up, and
- India VIX is falling
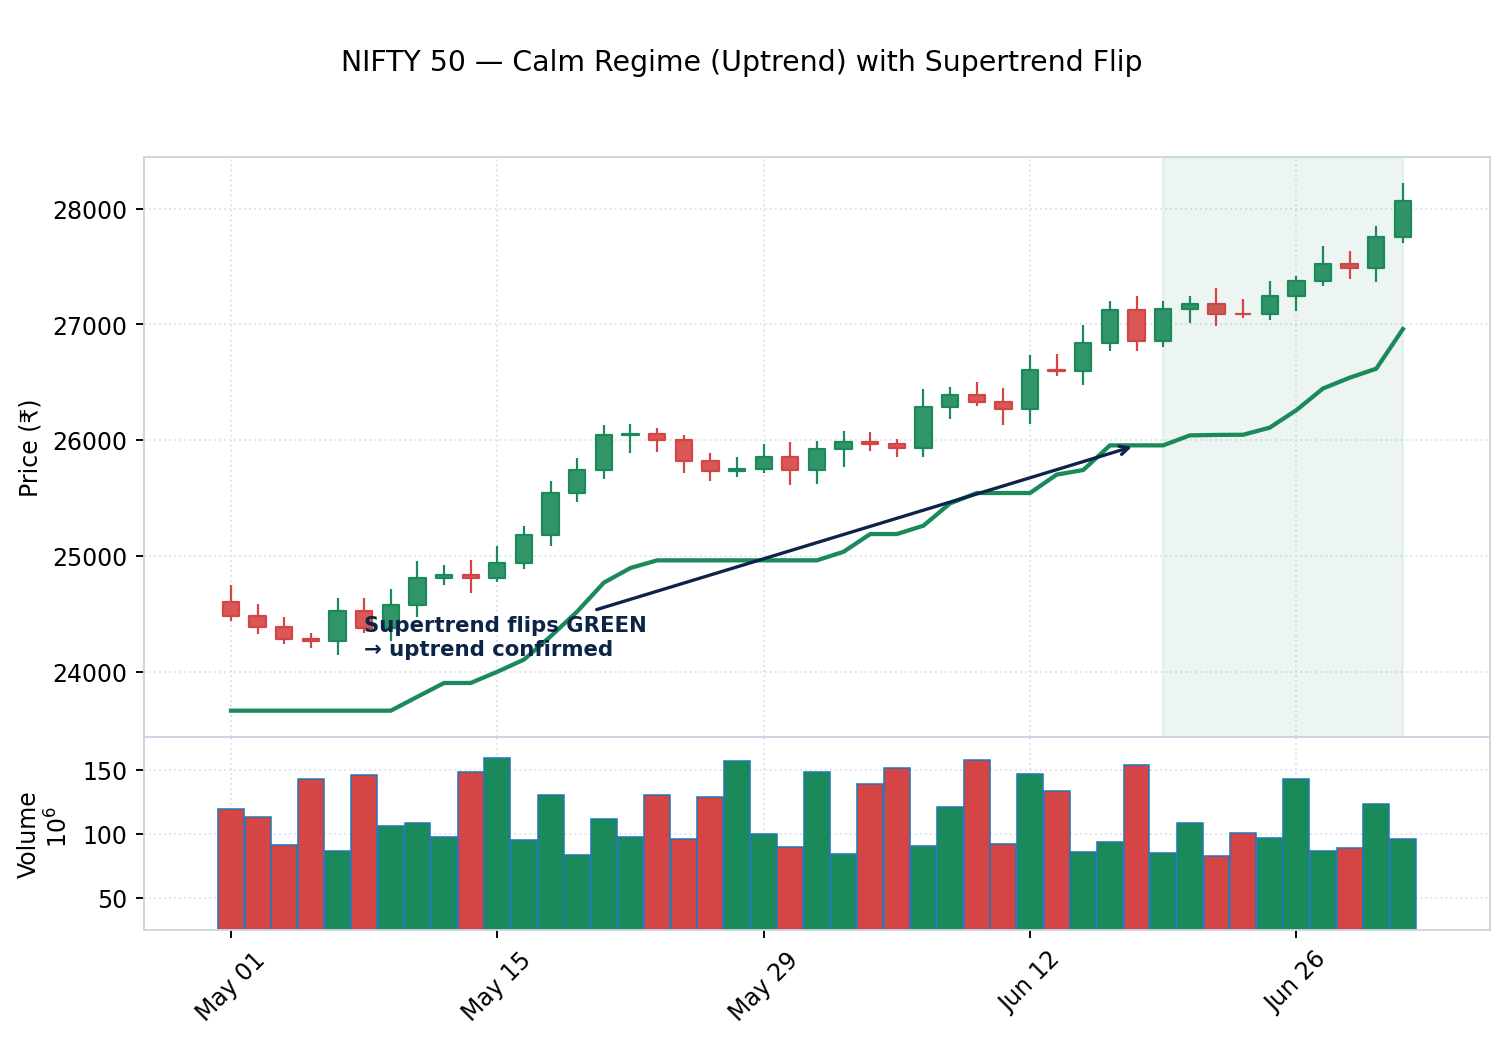
Figure 5: A calm-regime candlestick chart. Price grinds higher and Supertrend flips from red to green, confirming the uptrend that aligns with falling India VIX.
The Trade: Bull Put Spread
In this regime, the strategy shifts to a bull put spread — structurally, this is the same underlying concept as the put-buying trade above (a put-based structure), just adapted for a market where volatility is contracting rather than expanding.
The specific construction demonstrated:
- Sell a put around 0.10 delta — this strike is chosen because it corresponds to roughly an 80%+ probability of profit, since delta approximates the likelihood of the option expiring in the money
- Buy a put around 0.07 delta as a hedge, further out-of-the-money than the sold leg
- Position size shown: 10 lots
Expiry selection:
- Intraday trades: use the current week’s expiry
- Positional / swing trades expected to run for about a month: use an expiry roughly 60 days out
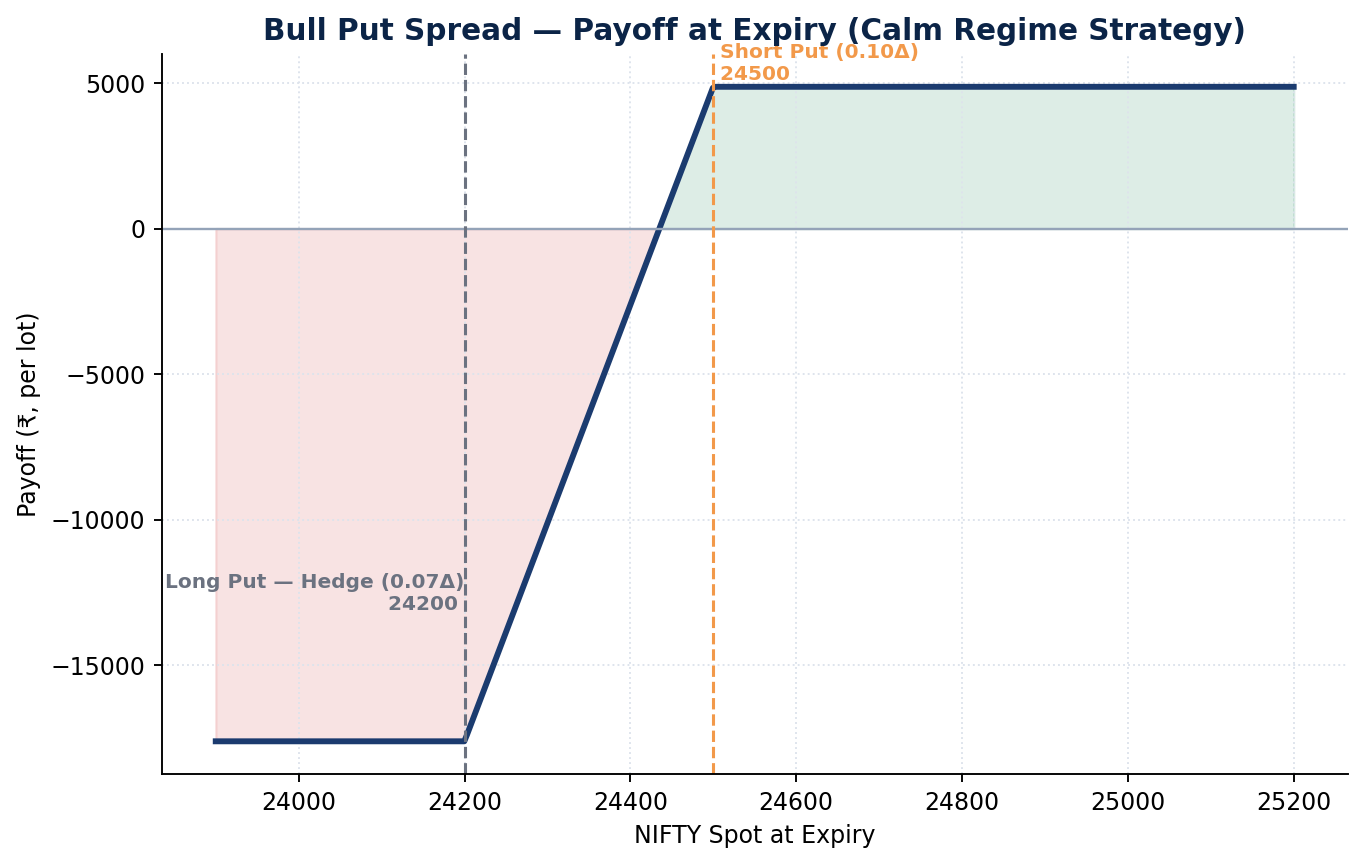
Figure 6: Payoff diagram for the Bull Put Spread. Maximum profit is the credit received if NIFTY stays above the short strike (0.10 delta); maximum loss is capped by the long put hedge (0.07 delta).
Reading the Trade with PnL Driver — Calm Regime
As NIFTY moved higher and India VIX moved lower, the position’s PnL Driver breakdown looked like this:
| Greek | Contribution | Why |
|---|---|---|
| Delta | ≈ ₹1,700 | NIFTY moved up as predicted — direction was correct |
| Vega | ≈ ₹2,600 | India VIX fell, IV contracted, which benefits a net-short-premium spread |
| Theta (over ~2 days) | ≈ ₹900 | Time decay now works in favour of the position, since it’s a net credit spread |
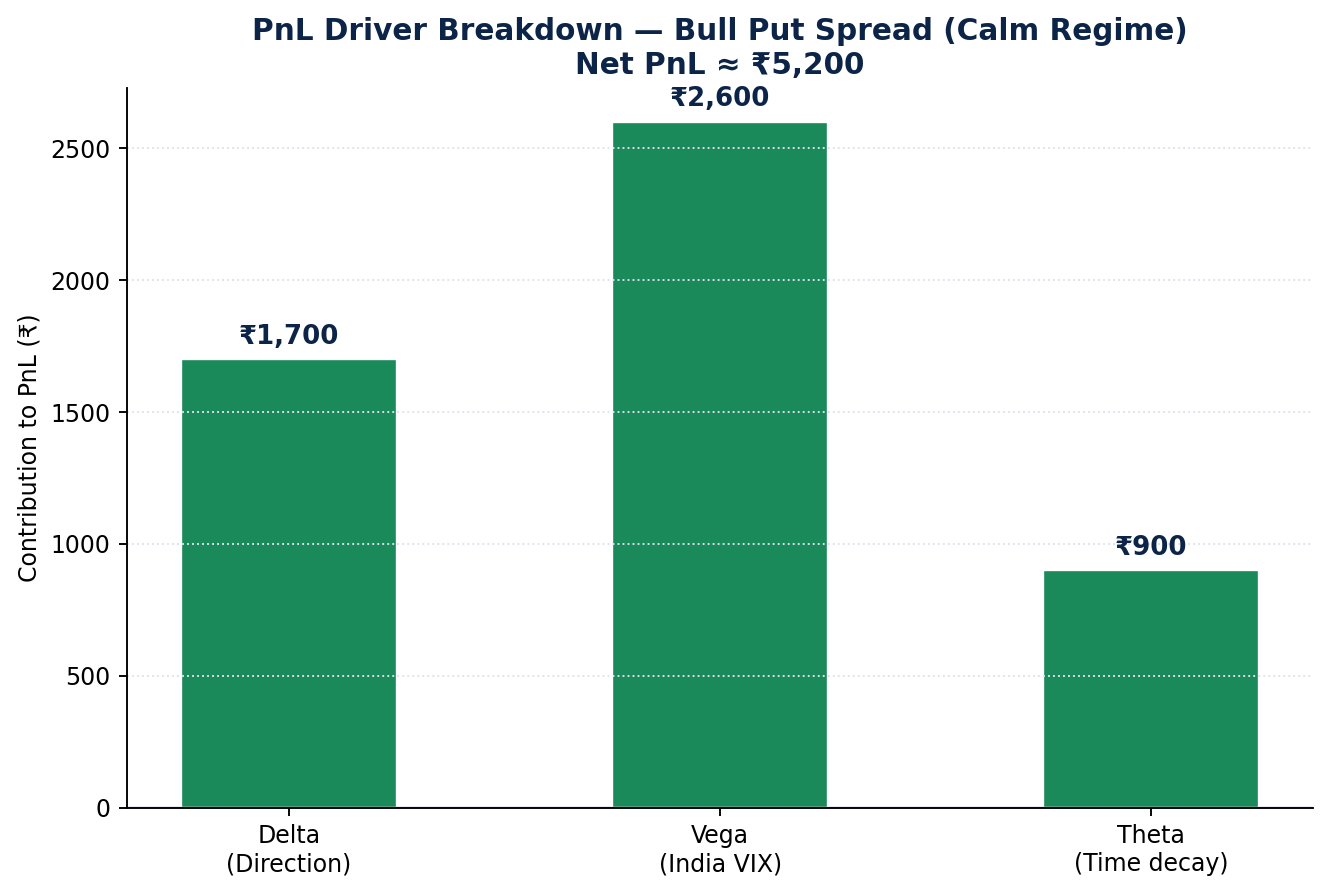
Figure 7: PnL Driver breakdown for the calm-regime Bull Put Spread. Unlike the fear-regime trade, Theta here is a source of profit rather than a drag — because this structure is a net premium seller.
Notice the mirror image: in the fear trade, Theta worked against the position and Vega worked with direction to double the gain. In the calm trade, both Theta and the fall in India VIX (Vega) work in the trader’s favour alongside direction — a structure built specifically to profit from a volatility-contraction environment.
Why the PnL Driver Matters More Than the PnL Number Itself
A raw PnL figure only tells you whether you made money. The PnL Driver breakdown tells you why — and that distinction is what separates traders who can consistently refine a system from traders who are just watching a number go up and down.
Once you understand which Greek is responsible for a win or a loss, you gain two things:
- Confidence in the strategy logic — you can confirm the trade made money for the reasons you designed it to, not by accident
- A feedback loop for improvement — if a trade lost money, the PnL Driver tells you precisely whether it was a directional miss, a volatility miss, or time decay, so you know exactly what to fix
Warning: It’s entirely possible to be net profitable on a trade for the “wrong” reason (for example, a lucky Vega swing masking a bad directional call). Always check the driver breakdown before concluding a strategy is working as designed.
This entire framework works regardless of which trend-following indicator you personally use. The video and this guide use Supertrend, but the same logic applies whether you’re using pivot points, Fibonacci levels, or breakout systems. What matters isn’t the specific indicator — it’s building the discipline to:
- Track volatility (India VIX), not just price
- Understand why a trade won or lost, not just whether it did
Putting It All Together: The Complete Switching Framework
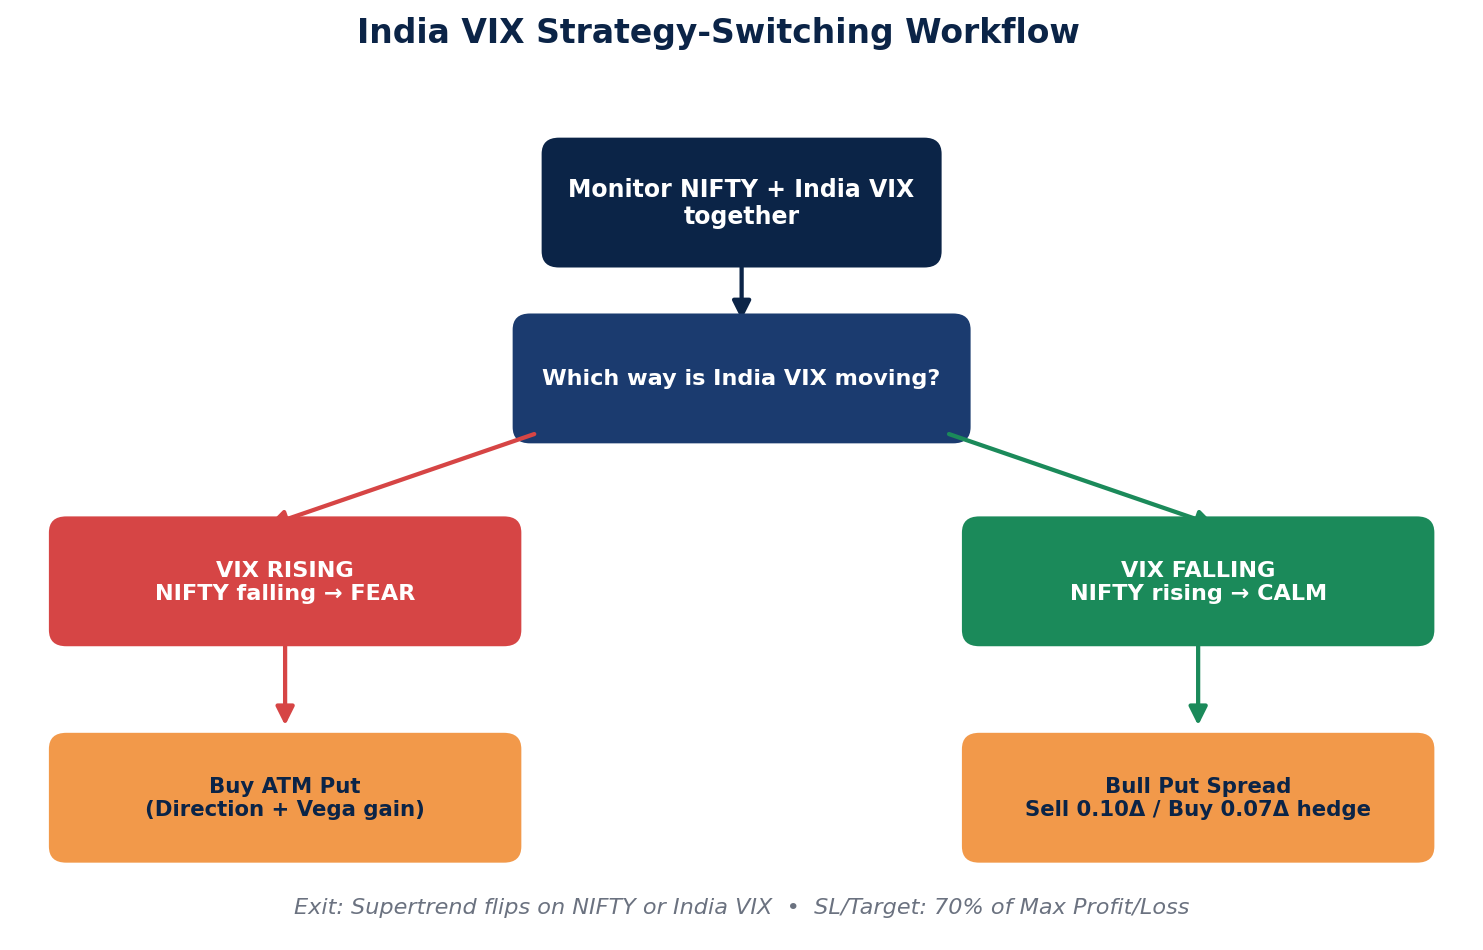
Figure 8: The complete decision framework — monitor both charts, identify the regime, and deploy the matching strategy with its exit rule.
Quick Reference Table
| Fear Regime | Calm Regime | |
|---|---|---|
| Signal | NIFTY red, India VIX rising | NIFTY green, India VIX falling |
| Strategy | Buy ATM Put (or sell ATM Call, if you’re a seller) | Bull Put Spread — sell 0.10Δ put, hedge with 0.07Δ put |
| Why it works | Direction + Vega both add to PnL | Direction + falling Vega + Theta all add to PnL |
| Expiry (intraday) | Nearest / current week | Current week |
| Expiry (positional) | Further-out expiry | ~60 days out |
| Exit trigger | Supertrend flips on NIFTY or India VIX | Supertrend flips on NIFTY or India VIX |
| Stop-loss / Target | 70% of max possible loss / profit | 70% of max possible loss / profit |
Exit Rules (Apply to Both Strategies)
- Trend-based exit: Exit the position the moment the Supertrend indicator changes colour on either NIFTY or India VIX — whichever flips first signals the regime may be changing.
- PnL-based stop-loss and target: For the option-selling structure (Bull Put Spread), set both stop-loss and target at 70% of the maximum possible profit. In the example shown, a maximum profit of ₹5,500 translates to cutting the position at roughly ₹3,600 profit or ₹3,600 loss — whichever comes first.
Summary
Markets don’t stay in one mood forever, and neither should your strategy. This framework gives you a simple, repeatable way to stay aligned with the market’s current character:
- Always chart NIFTY and India VIX together — never look at price in isolation.
- When fear is rising (NIFTY down, VIX up), buy an ATM put to capture both direction and volatility expansion.
- When calm returns (NIFTY up, VIX down), switch to a bull put spread to capture direction, volatility contraction, and time decay together.
- Use the PnL Driver on every trade to understand why you made or lost money — not just the final number.
- Exit on a Supertrend flip on either chart, and manage risk with a 70%-of-max-profit stop-loss/target rule.
The specific trend indicator, strike selection method, or platform you use can vary — but the underlying discipline of reading volatility alongside price, and adapting your structure to match the regime, is what allows a trading approach to survive across market cycles rather than expiring after a few good weeks.