Hi @Everyone ,
A step-by-step guide to finding the optimal RSI period for scalping through systematic backtesting and train-test optimisation.
Introduction
If you trade using momentum indicators, you’ve probably asked yourself this question at least once: “Which RSI value actually works best for scalping?” Should you use RSI 7, RSI 14, RSI 21, or something else entirely? Most traders end up guessing, or worse, copying a number they saw in someone else’s strategy without ever testing it on their own data.
This blog walks through a simple, repeatable process for answering that question with data instead of assumptions. Using the Dhan API and a Python-based backtesting framework, we test multiple RSI periods on five years of Nifty 5-minute data, train and test each one, and compare their performance using an efficiency score. The same process explained here can be extended to optimise almost any parameter in your trading strategy — not just RSI, but Supertrend settings, EMA values, option expiries, strike selection, stop-loss, targets, and more.
What You’ll Learn
How to backtest multiple RSI values, train and test a strategy properly, calculate an efficiency score to avoid overfitting, and use the same framework to optimise combinations of parameters like RSI and EMA together.
The Problem: Which RSI Value Should You Trust?
When building a scalping strategy, it’s tempting to simply pick an RSI value based on intuition. A common line of thinking goes something like this: “Maybe RSI 7 is better, or maybe RSI 14 is better, or perhaps 21 or 28 would work best.” The problem with this approach is that it relies on guesswork rather than evidence.
The correct way to answer this question is to backtest each candidate value and let the data decide. In this exercise, four RSI periods were shortlisted for comparison:
-
RSI 7
-
RSI 14
-
RSI 21
-
RSI 28
Each of these was backtested on five years of historical Nifty data to determine which one actually delivers the most reliable performance for a scalping strategy.
The Optimisation Approach: Train, Test, and Measure Efficiency
The optimisation process follows a straightforward three-step flow that mirrors how machine learning models are typically evaluated — by splitting the process into training and testing phases, and then measuring how well the results generalise.
-
Train the model: Run the strategy with each RSI value on the training portion of the historical data and record how well it performs.
-
Test the model: Run the same strategy configuration on a separate, unseen portion of the data (the testing set).
-
Calculate efficiency: Compare the testing performance against the training performance to see how consistent the strategy really is.
This train-then-test structure matters because a strategy that performs brilliantly only on the data it was tuned on — but poorly on fresh data — is not a strategy you can trust in live markets. Efficiency is what separates a genuinely robust parameter from one that simply got lucky during training.
Step-by-Step Workflow
Step 1: Train the Strategy on Each RSI Value
The first run trains the strategy separately for each RSI period. The output of this training phase is a System Quality Number (SQN) — a single score that summarises how well the strategy performed. The higher the SQN, the better the strategy performed during that phase.
Running the script produces a set of training SQN values, one for each RSI period being tested, as shown below.
Step 2: Test the Strategy on Unseen Data
Once training is complete, the same parameter values are run again — this time on the testing dataset. This produces a second SQN score for each RSI value, representing how the strategy behaves on data it has not already been tuned against.
Step 3: Calculate the Efficiency Score
Finally, efficiency is calculated as the ratio of the testing SQN to the training SQN for each parameter. This single metric tells you how much of the strategy’s training performance actually carried over to fresh, unseen data:
Efficiency = Testing SQN / Training SQN
The command used to run the full pipeline (training, testing, and efficiency calculation) is shown below. Note that the script is run twice in the terminal — once to generate the training SQN values, and once more to generate the testing SQN values for the same set of RSI periods.
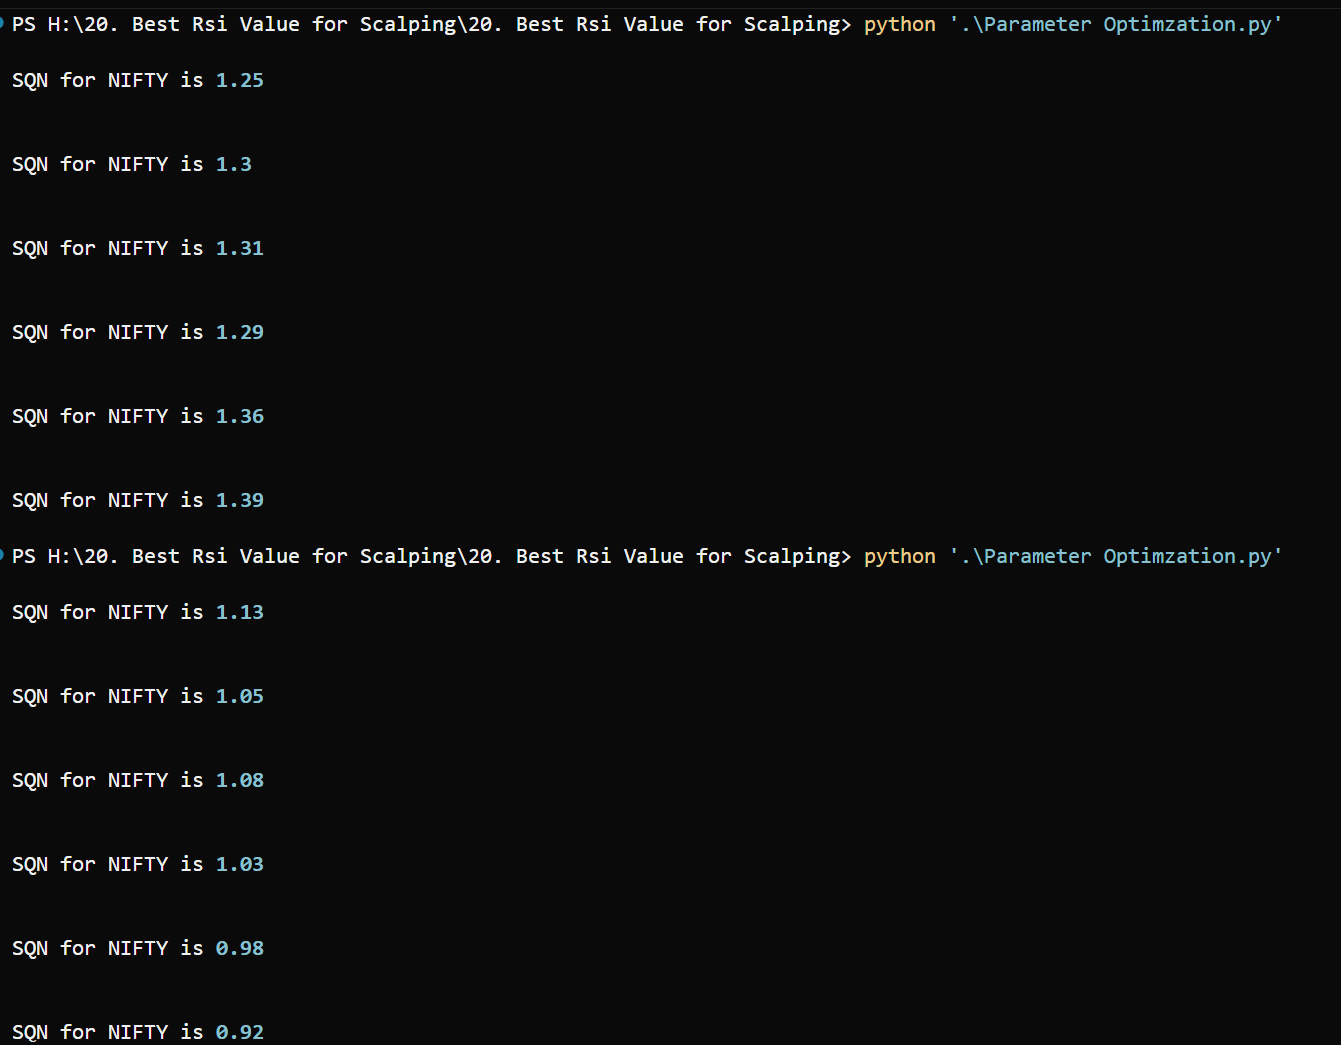
Terminal output showing Training SQN and Testing SQN values generated by running Parameter Optimzation.py
Understanding the Results
Once both the training and testing runs are complete, the results can be compiled into a single table showing the Training SQN, Testing SQN, and the resulting Efficiency score for every RSI value tested.
| RSI Period | Training SQN | Testing SQN | Efficiency (Test / Train) |
|---|---|---|---|
| RSI_7 | 1.25 | 1.13 | 0.90 |
| RSI_14 | 1.30 | 1.05 | 0.81 |
| RSI_21 | 1.31 | 1.08 | 0.82 |
| RSI_28 | 1.29 | 1.03 | 0.80 |
| RSI_35 | 1.36 | 0.98 | 0.72 |
| RSI_42 | 1.39 | 0.92 | 0.66 |
Table: RSI period vs. Training SQN, Testing SQN, and Efficiency (Test / Train). RSI_7 delivers the highest efficiency at 0.90.
The spreadsheet output, along with its accompanying efficiency chart, is shown below. The bar chart makes the trend immediately visible — efficiency is highest for the shortest RSI period and steadily declines as the RSI period increases.
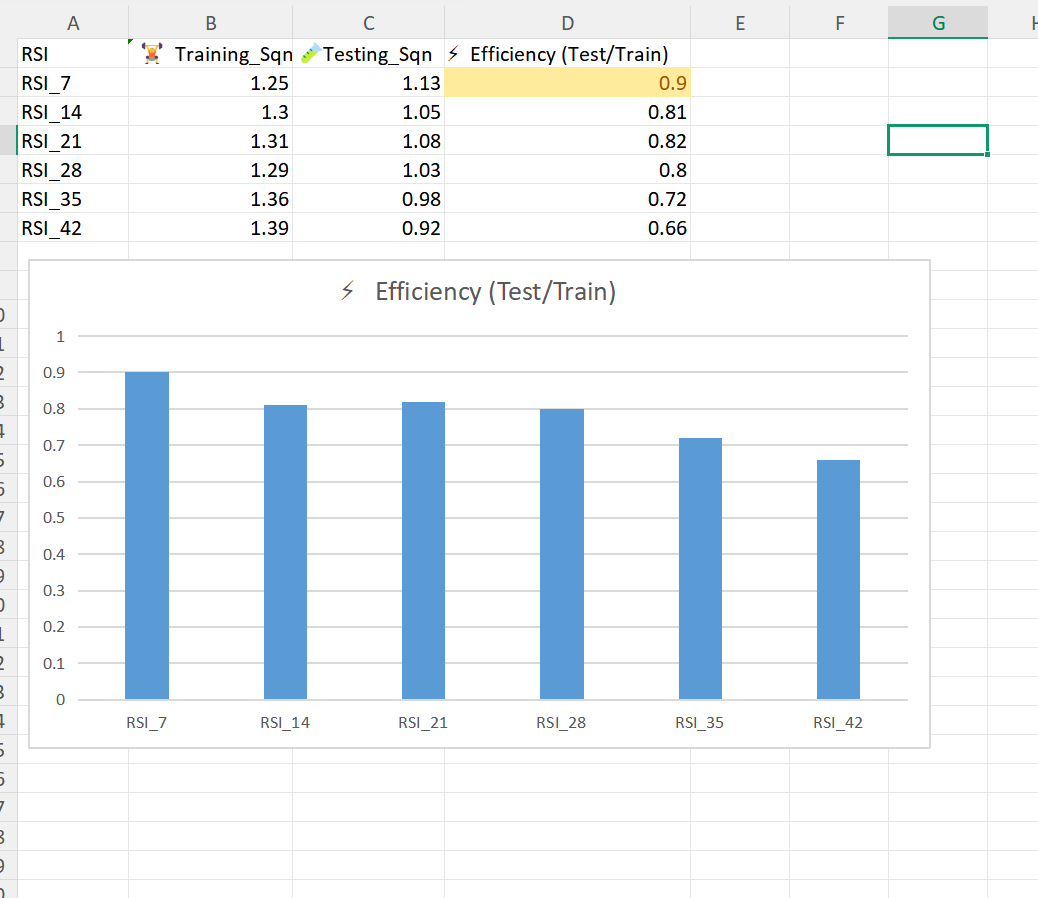
Excel output: Efficiency (Test/Train) by RSI period, with RSI_7 (0.90) as the top performer.
Key Result
RSI_7 recorded the highest efficiency score at 0.90, making it the most reliable RSI period for scalping among all the values tested.
Key Insight: Why Shorter RSI Periods Work Better for Scalping
One of the most useful takeaways from this test is the clear downward trend in efficiency as the RSI period increases. RSI_7 tops the chart at 0.90, while RSI_42 falls all the way down to 0.66. This isn’t a coincidence — it reflects something fundamental about how momentum-based scalping strategies behave.
Scalping is about capturing short, fast momentum moves. When the RSI period is too long — say, looking back over 30 or 42 candles — the indicator becomes too “laggy” for this purpose. It smooths over the very short-term momentum shifts that a scalping strategy depends on. A shorter lookback, such as 7 candles, stays responsive enough to catch these quick moves without excessive lag.
In short: for momentum-based scalping trades, don’t look too far back. A window of around 7 candles is good; a window of 30–42 candles is simply too much lag for the strategy to work effectively.
Taking It Further: Optimising Multiple Parameters Together
This process doesn’t have to stop at a single parameter. The same train-test-efficiency framework can be extended to test combinations of parameters simultaneously. For example, instead of testing RSI alone, you could test it alongside three different EMA settings:
-
EMA 9
-
EMA 21
-
EMA 35
Each of these EMA values can be paired with every RSI period being tested, and the entire train-test-efficiency cycle repeated for every combination. This is important because real-world strategies are rarely governed by a single parameter — they usually involve a combination of parameters working together. Testing combinations, rather than one variable in isolation, gives a far more realistic picture of how a strategy will perform live.
Whichever combination produces the highest efficiency score across the full test set represents your best set of parameters for that strategy.
Behind the Code: How the Backtest Works
The backtest itself is built around Nifty’s 5-minute candle data, using the following core logic:
-
RSI above 60 is treated as a bullish signal.
-
RSI below 40 is treated as a bearish signal.
For every trade generated during the backtest, the script records key details such as the trade date, entry time, entry price, buy/sell direction, and quantity. It also applies a stop-loss and a target to every trade. If either level is hit, the position is exited, and the resulting profit-and-loss (P&L) for that trade is recorded.
Once all trades have been processed, the script calculates the System Quality Number (SQN) for the strategy — the single score used throughout this optimisation process to compare performance across different parameter values.
Note
This walkthrough assumes some familiarity with backtesting logic covered in earlier videos in this series. If this is your first time seeing this kind of code, it’s worth revisiting those earlier videos first — the entry/exit and P&L logic used here builds directly on that foundation.
Other Parameters You Can Optimise
The beauty of this framework is that it isn’t limited to RSI. The exact same train-test-efficiency process can be used to find the optimal value for almost any parameter in your trading strategy, including:
-
Best Supertrend parameter
-
Best EMA values
-
Best expiry to trade
-
Best strike price to trade
-
Best stop-loss and target levels
-
Best entry time
-
Best indicator or price-action candle pattern
In essence, virtually every configurable element of a trading strategy can be run through this same optimisation pipeline — test it, train it, calculate efficiency, and let the numbers tell you what works best.
Resources
For the complete walkthrough and the full source code used in this optimisation, refer to the links below:
-
Video Tutorial: https://youtu.be/4HGT6_jDK_Y?si=waMLKNhxIbSSzcWS
-
Complete Project / Code (Google Drive): https://drive.google.com/file/d/1dTS-dsiQrPyOPCVPrG65GcCiESbFLxMD/view
Questions about the code or the underlying logic can be posted in the “Learn Algo Trading” section on Meet for Trade, where they will be reviewed and answered.
Summary
Choosing strategy parameters by intuition is a gamble. Backtesting them systematically, with a proper train-test split and an efficiency score, replaces guesswork with evidence. In this case, testing RSI 7, 14, 21, 28, 35, and 42 on five years of Nifty 5-minute data showed a clear winner: RSI_7, with an efficiency score of 0.90 — comfortably ahead of every longer RSI period tested.
More importantly, the process itself is the real takeaway. The same train-test-efficiency framework can be applied to any parameter or combination of parameters in a trading strategy, whether that’s an indicator setting, a stop-loss level, an expiry choice, or a strike selection. Once you understand this flow, optimising your own strategies becomes a matter of running the numbers rather than trusting a hunch.