From the TA-Lib i am getting the below values
new_chart = tsl.get_historical_data(tradingsymbol=‘ACC’, exchange=‘NSE’, timeframe=‘5’)
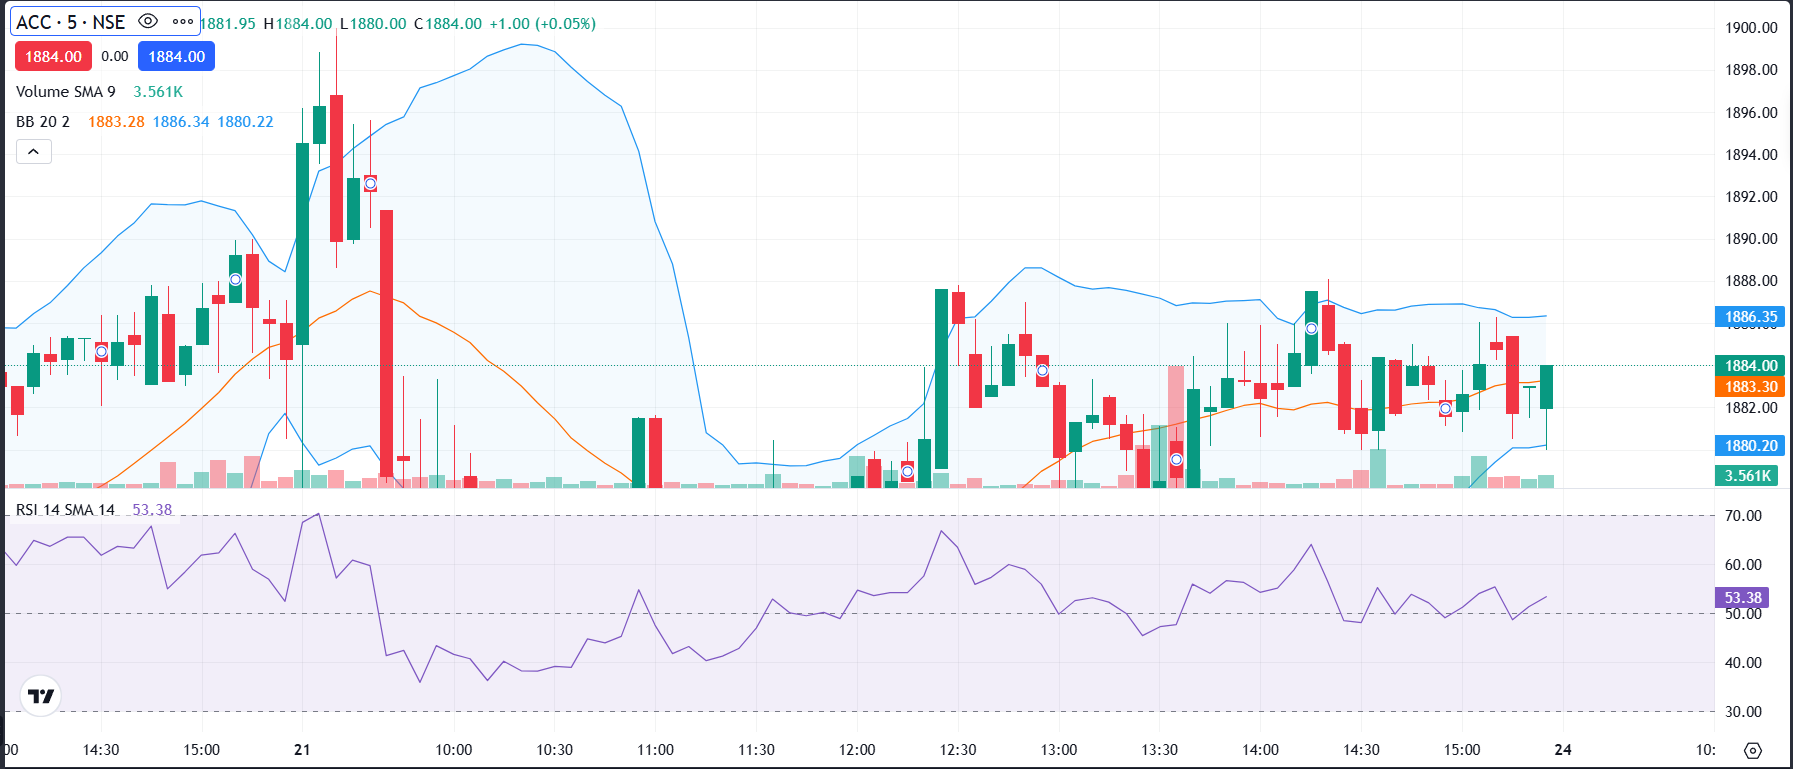
new_chart[‘upperband’], new_chart[‘middleband’], new_chart[‘lowerband’] = talib.BBANDS(new_chart[‘close’], timeperiod=5, nbdevup=2, nbdevdn=2, matype=0)
open 1881.95
high 1882.95
low 1880.0
close 1881.8
volume 3561.0
timestamp 2025-02-21 15:25:00+05:30
upperband 1885.460481
middleband 1883.07
lowerband 1880.679519