@PravinJ
why is there a different price for the same symbol? I used the candle and heikin ashi chart.
screen recording
1 Like
It is totally Normal
The Heikin-Ashi technique uses a modified formula in order to calculate the candles OHLC:
- xClose = (Open+High+Low+Close)/4 - The average price of the current bar.
- xOpen = [xOpen(Previous Bar) + xClose(Previous Bar)]/2 -Midpoint of the previous bar.
- xHigh = Max(High, xOpen, xClose) - Highest value in the set.
- xLow = Min(Low, xOpen, xClose) - Lowest value in the set.
As a result, the last price you see on a regular candlestick chart is different from the Heikin Ashi chart.
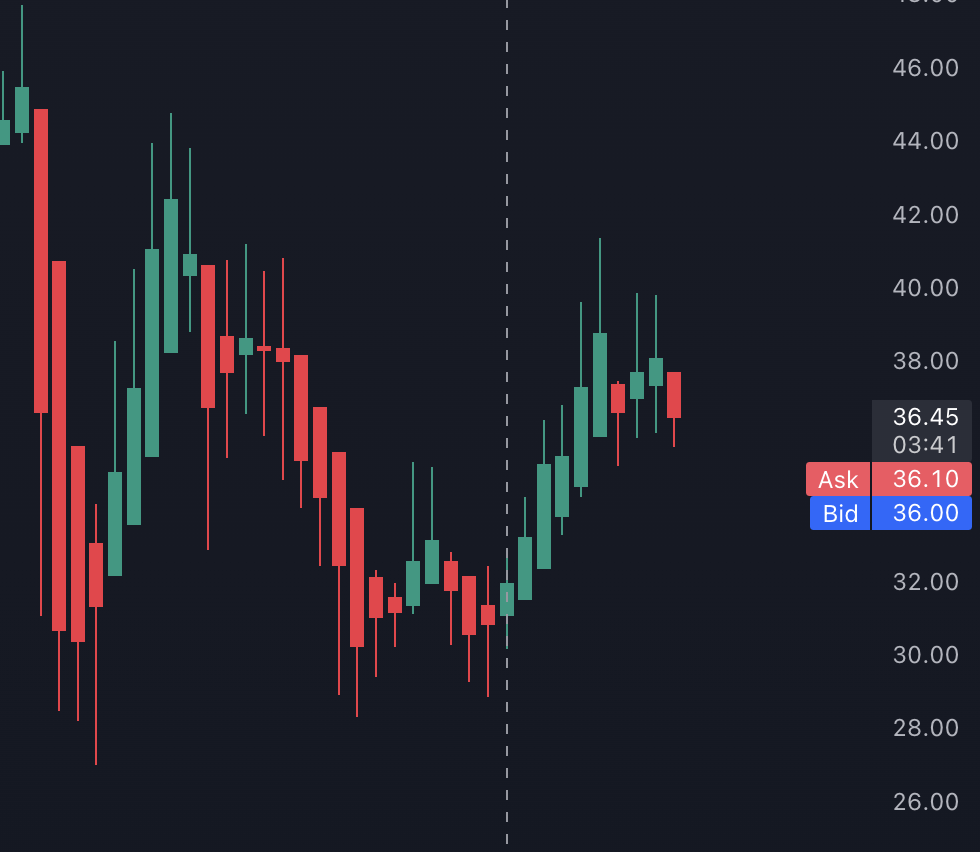
well, I think the last price has nothing to do with HA candles, It doesn’t get modified by any formula in HA candles.
The actual TRADED LTP doesn’t get modified but what is displayed does get Modified. All because of the formula I mentioned above.
You should enable “BID/ASK” Lines to see the trading LTP.
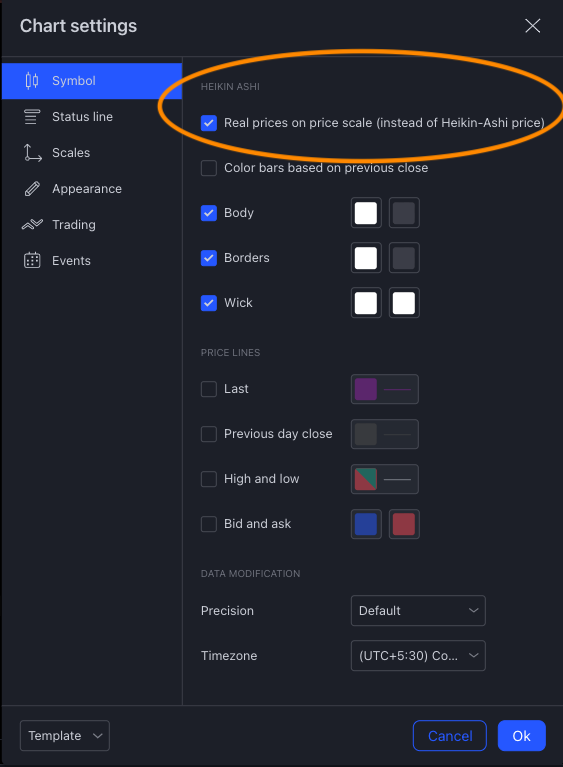
On HA charts, you need to enable following Chart Settings to see the latest LTP.
It seems this option is missing in Dhan TV charts.
1 Like
Nice Spot @amit ! This is a great setting! This correctly solves the purpose to see real price.
Yea, couldn’t find this setting on Dhan TV so asked @HIR to use BID/ASK line as an alternative ![]()
same chart but rsi showing different value
@Naman
Recently, replicated your concern whenever you move your cursor to a different candle, you need to refresh the chart to show the correct RSI (Relative Strength Index) value.
and ChartIQ provide real time data then TradingView chart?
I Placed a Sl Buy Limit above 595 and didn’t go there and made high 589.85 than How order Executed on my SL Limit price
Hi @KESHAV_CHANDRA,
We are connecting to you on your registered number to address your concerns.
Hi @KESHAV_CHANDRA,
As discussed, over the call your query regarding order execution has been addressed.
hello @PravinJ sir please watch this video
dhan chart is 2 second delayed and candle issue please fix it asap.
i compare it with zerodha for refer.
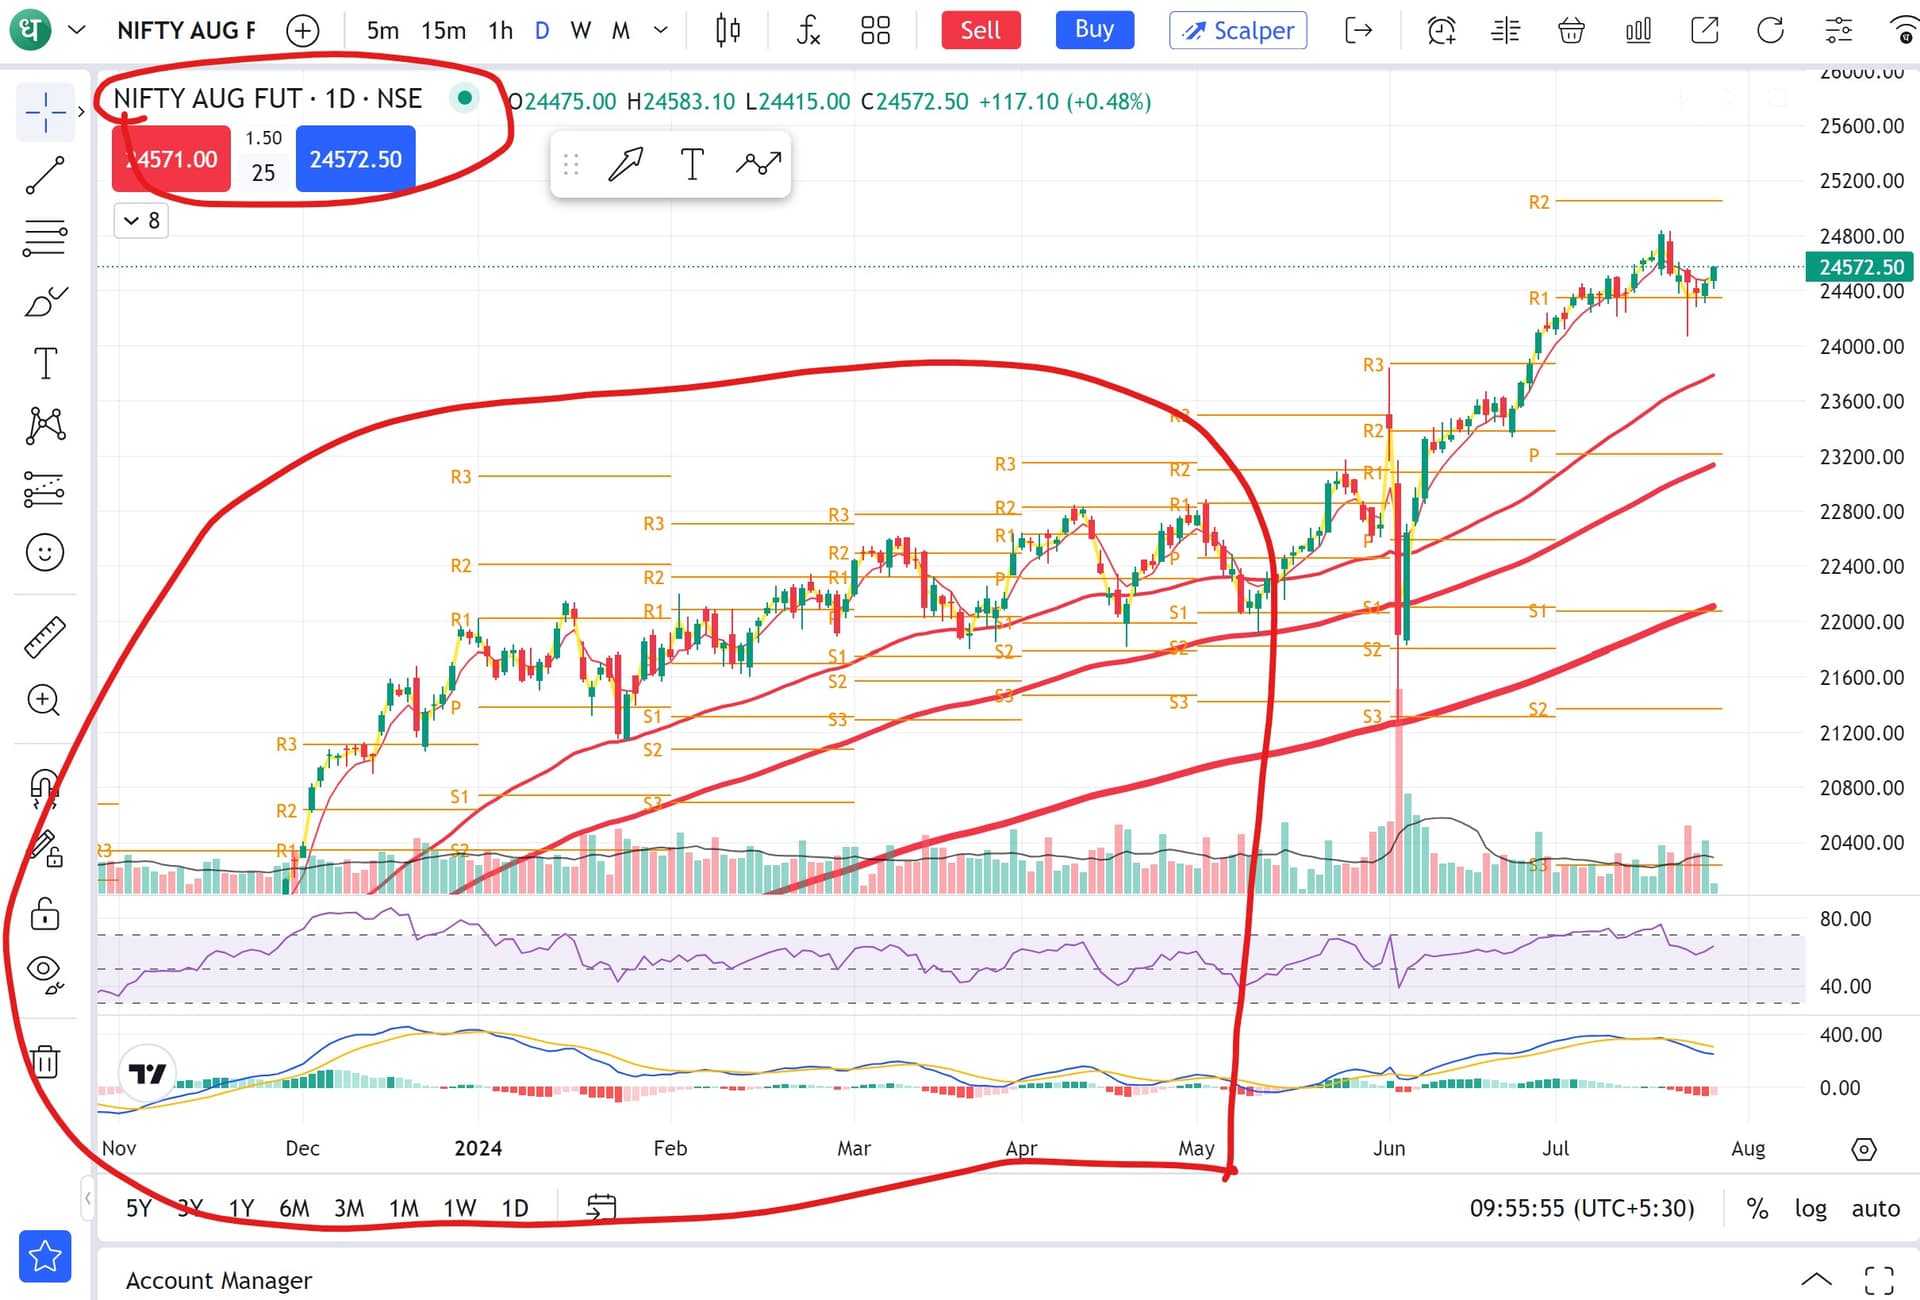
my question about future contract. tv.dhan.co shows data of any particular script future before three month. how its possible? for example nifty aug future live when nifty may expired so how tv.dhan.co shows data from month of may or before month may (with volume) how its possible?
Hi @Bhargav_Parmar Contracts on Futures are traded 3 months before respective expiry date of that month. I hope this was your query, unless I did not get it correctly.
I KNOW THAT BUT TV.DHAN.CO SHOWS DATA BEFORE ITS AVAILABLE FOR TRADE. FOR EXAMPLE NIFTY AUF FUTURE SHOWS DATA OF THE MONTH OF MAY WHEN IT NOT EXIST FOR TRADE
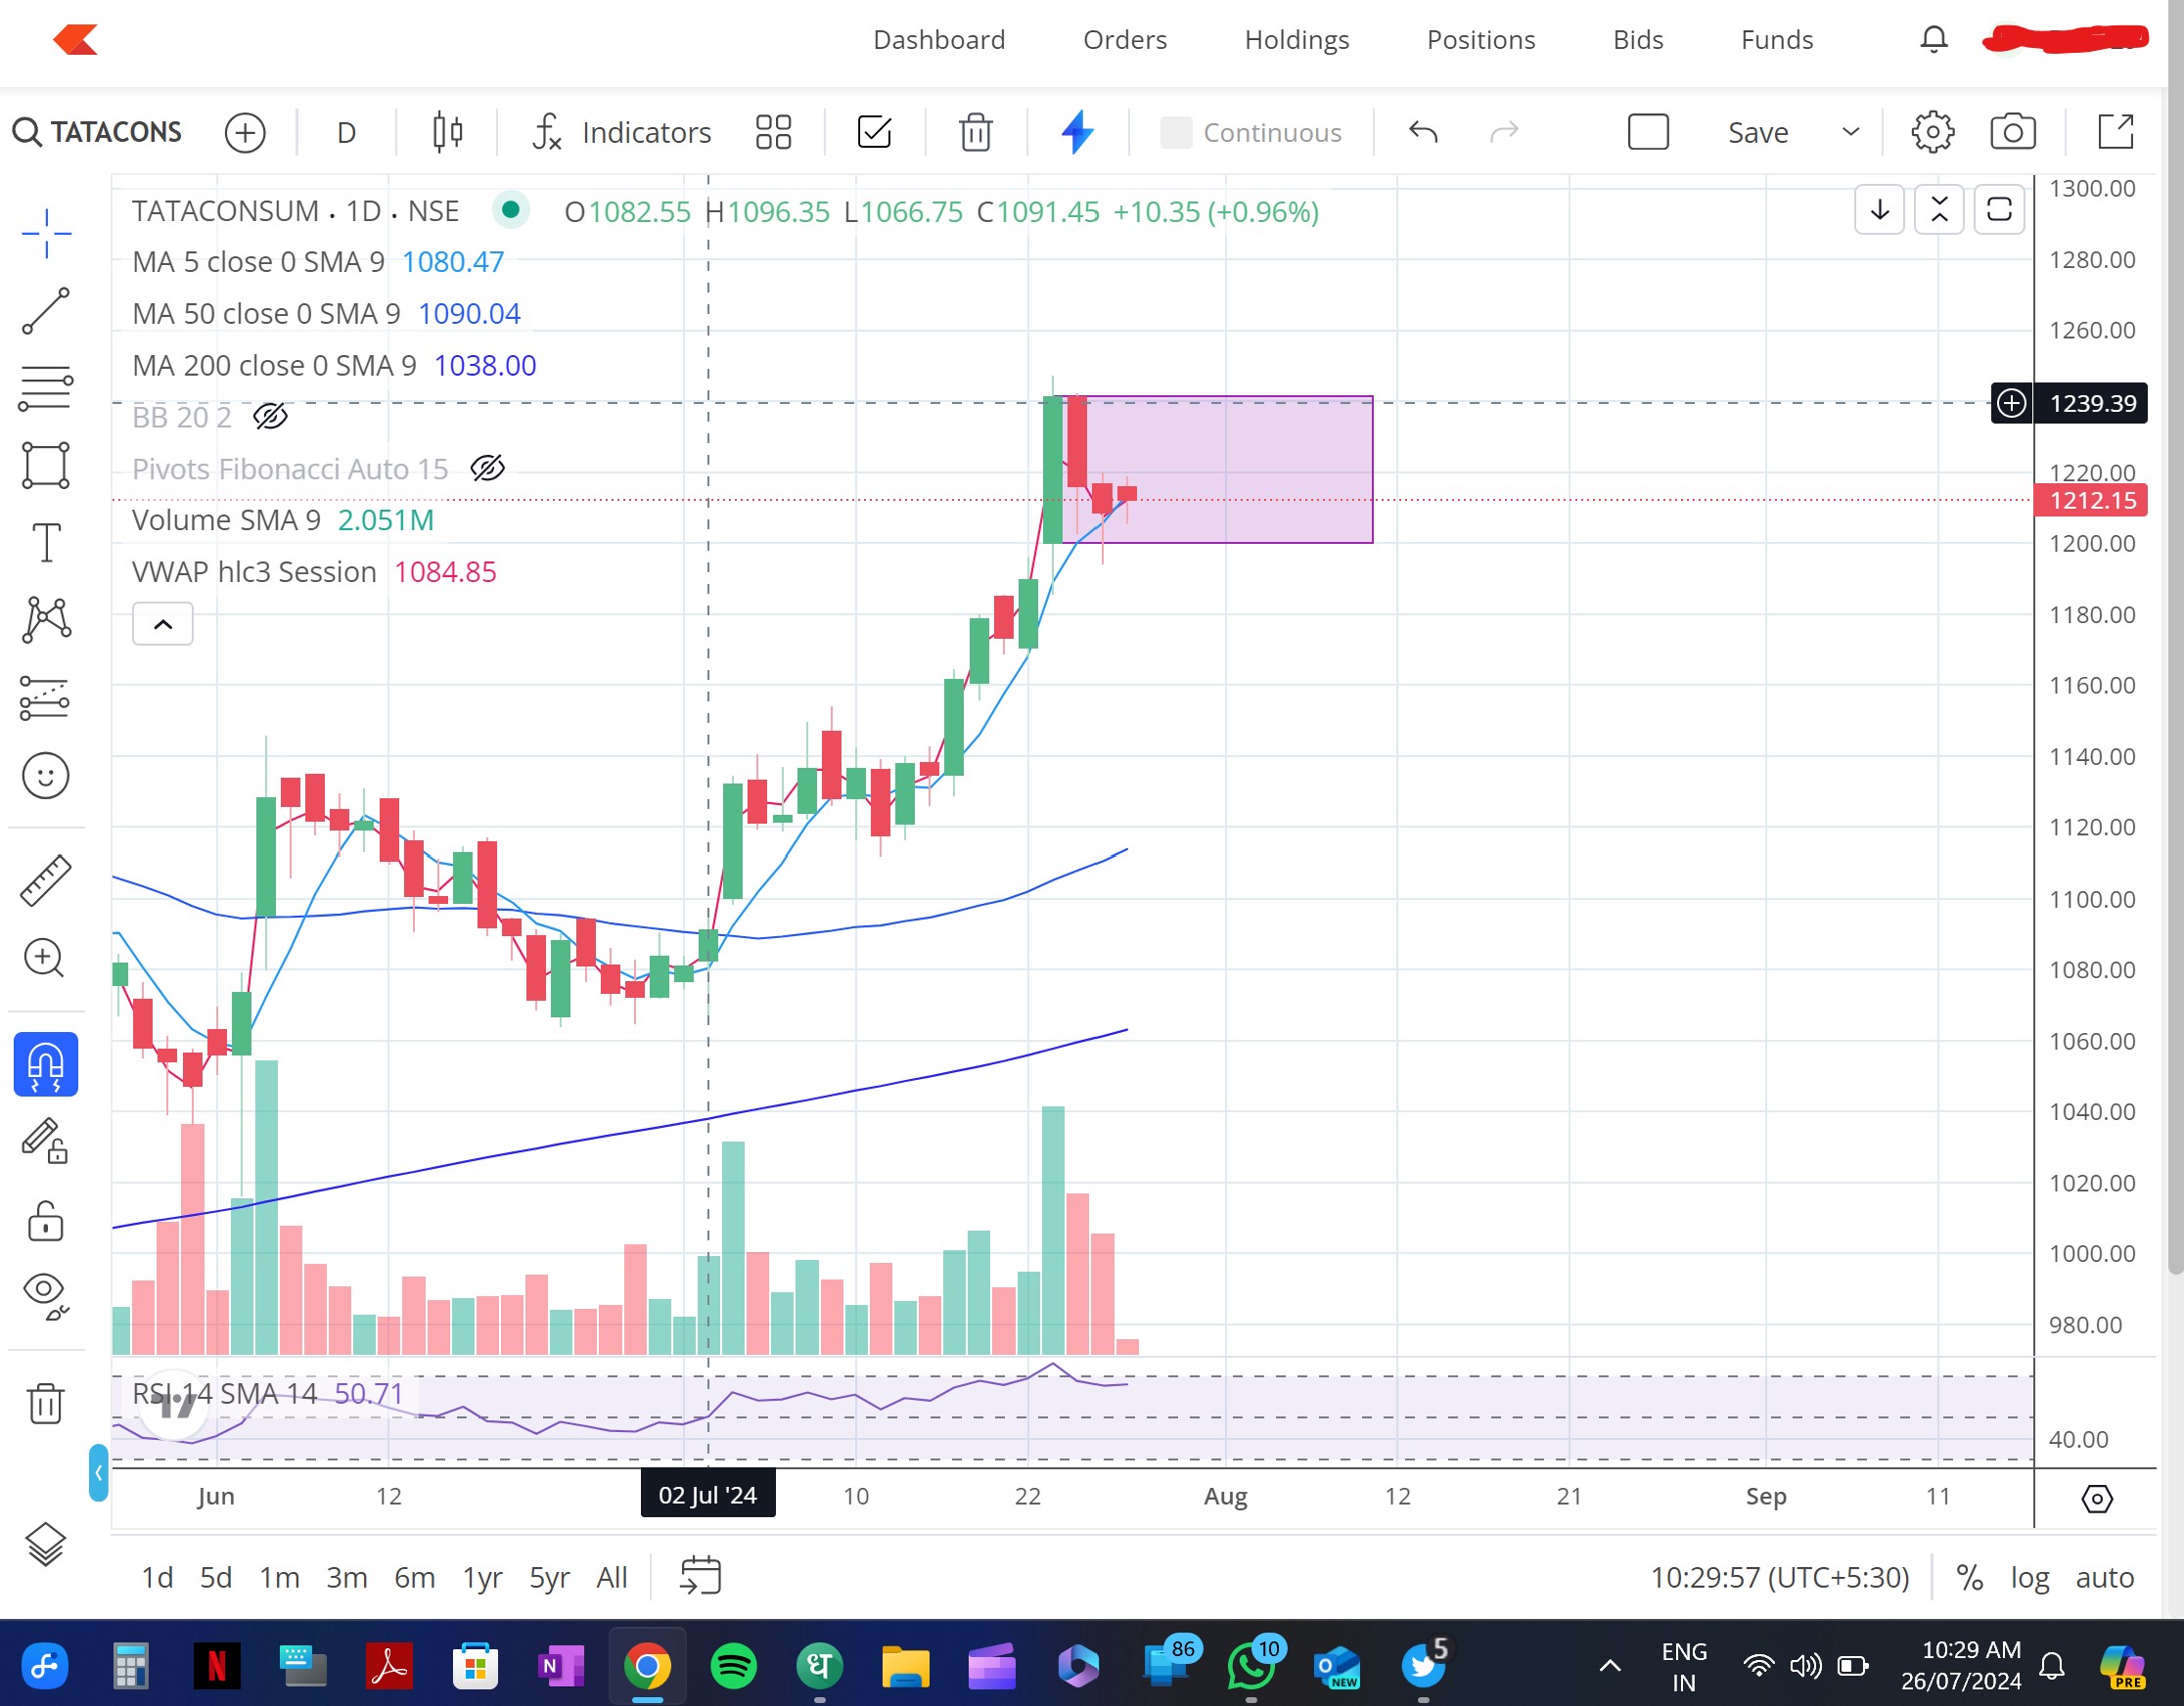
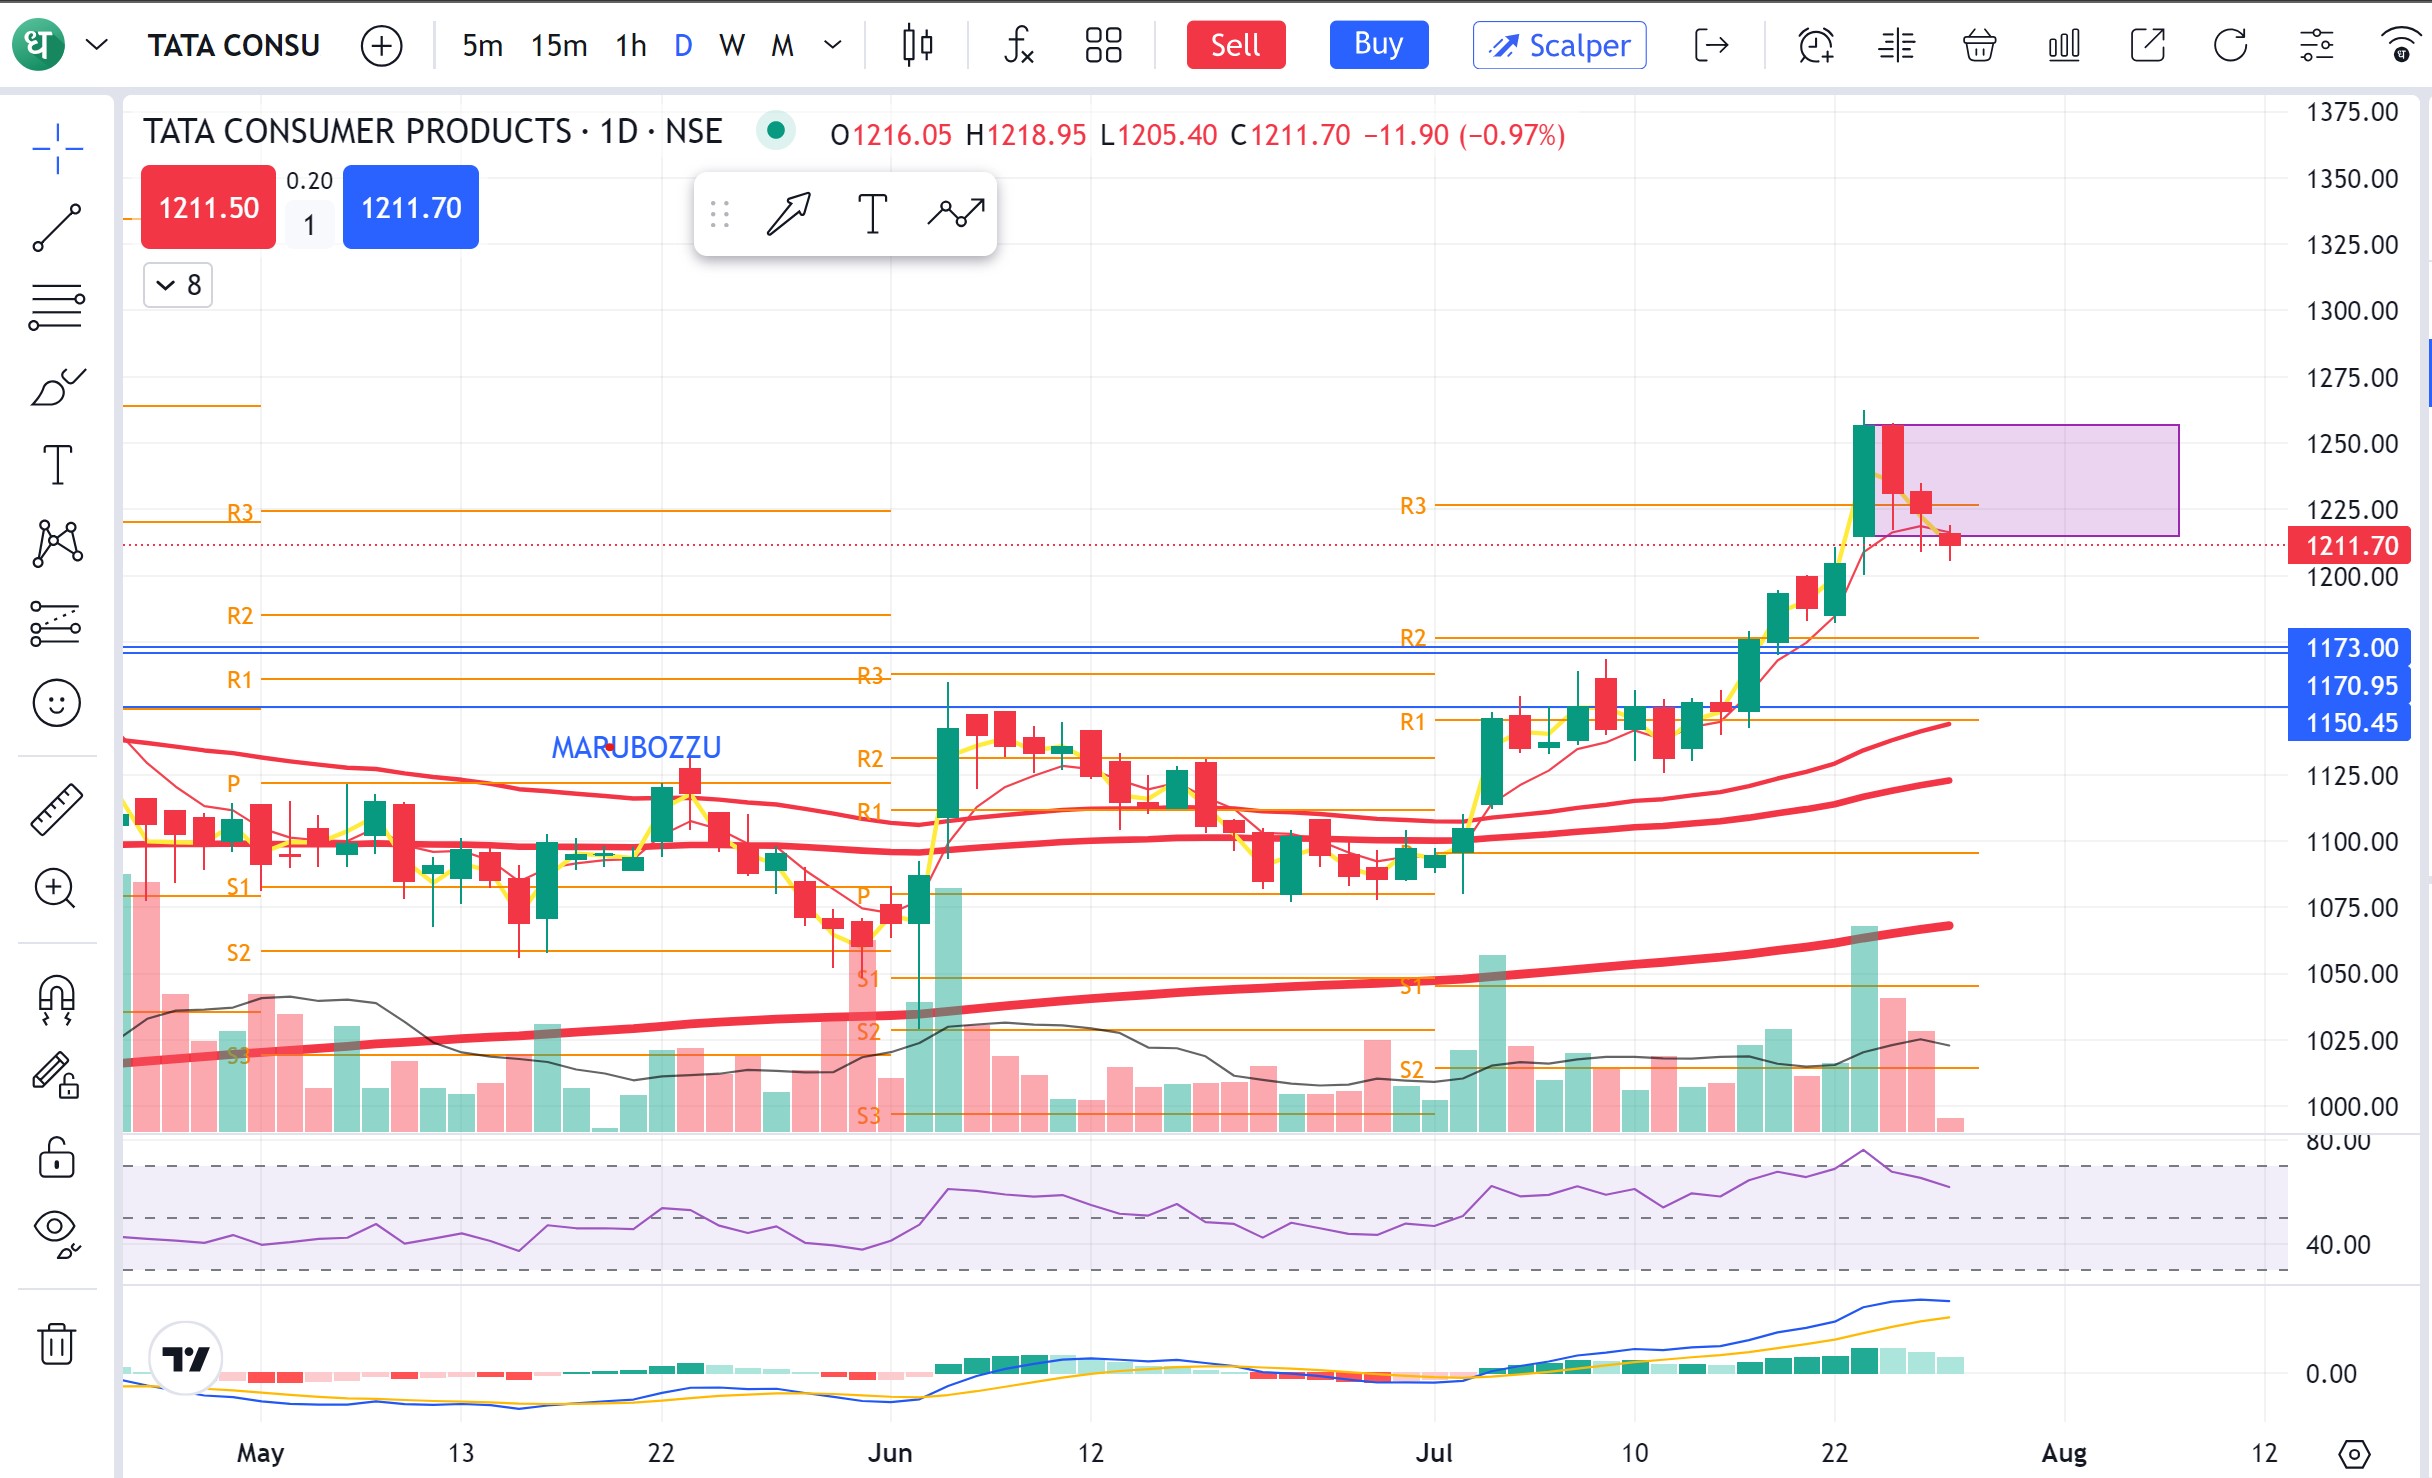
How we do technical analysis if this much data mismatch? for example tata consumer make inside candle from 23 to 25 July. but in @Dhan shows its breakout today i.e. 26 July wile in kite (zerodha) shows is still insider candle because of OHLC data of 23 July. as per Dhan OHLS for tata consumer on 23 July 1215,1262.60,1200.25,1256.90 respectively. whiles per KITE OHLS for tata consumer on 23 July 1200.10,1247.10,1185.50,1241.45 respectively . the main purpose of candle stick chart is to analyze script in view of technical analysis. from this error costumers of yours may make big losses.
not true about Hindustan unilever aug fut. as pen NSE high of 23 july is 2830 but as per tv.dhan.co it is 2812.20.
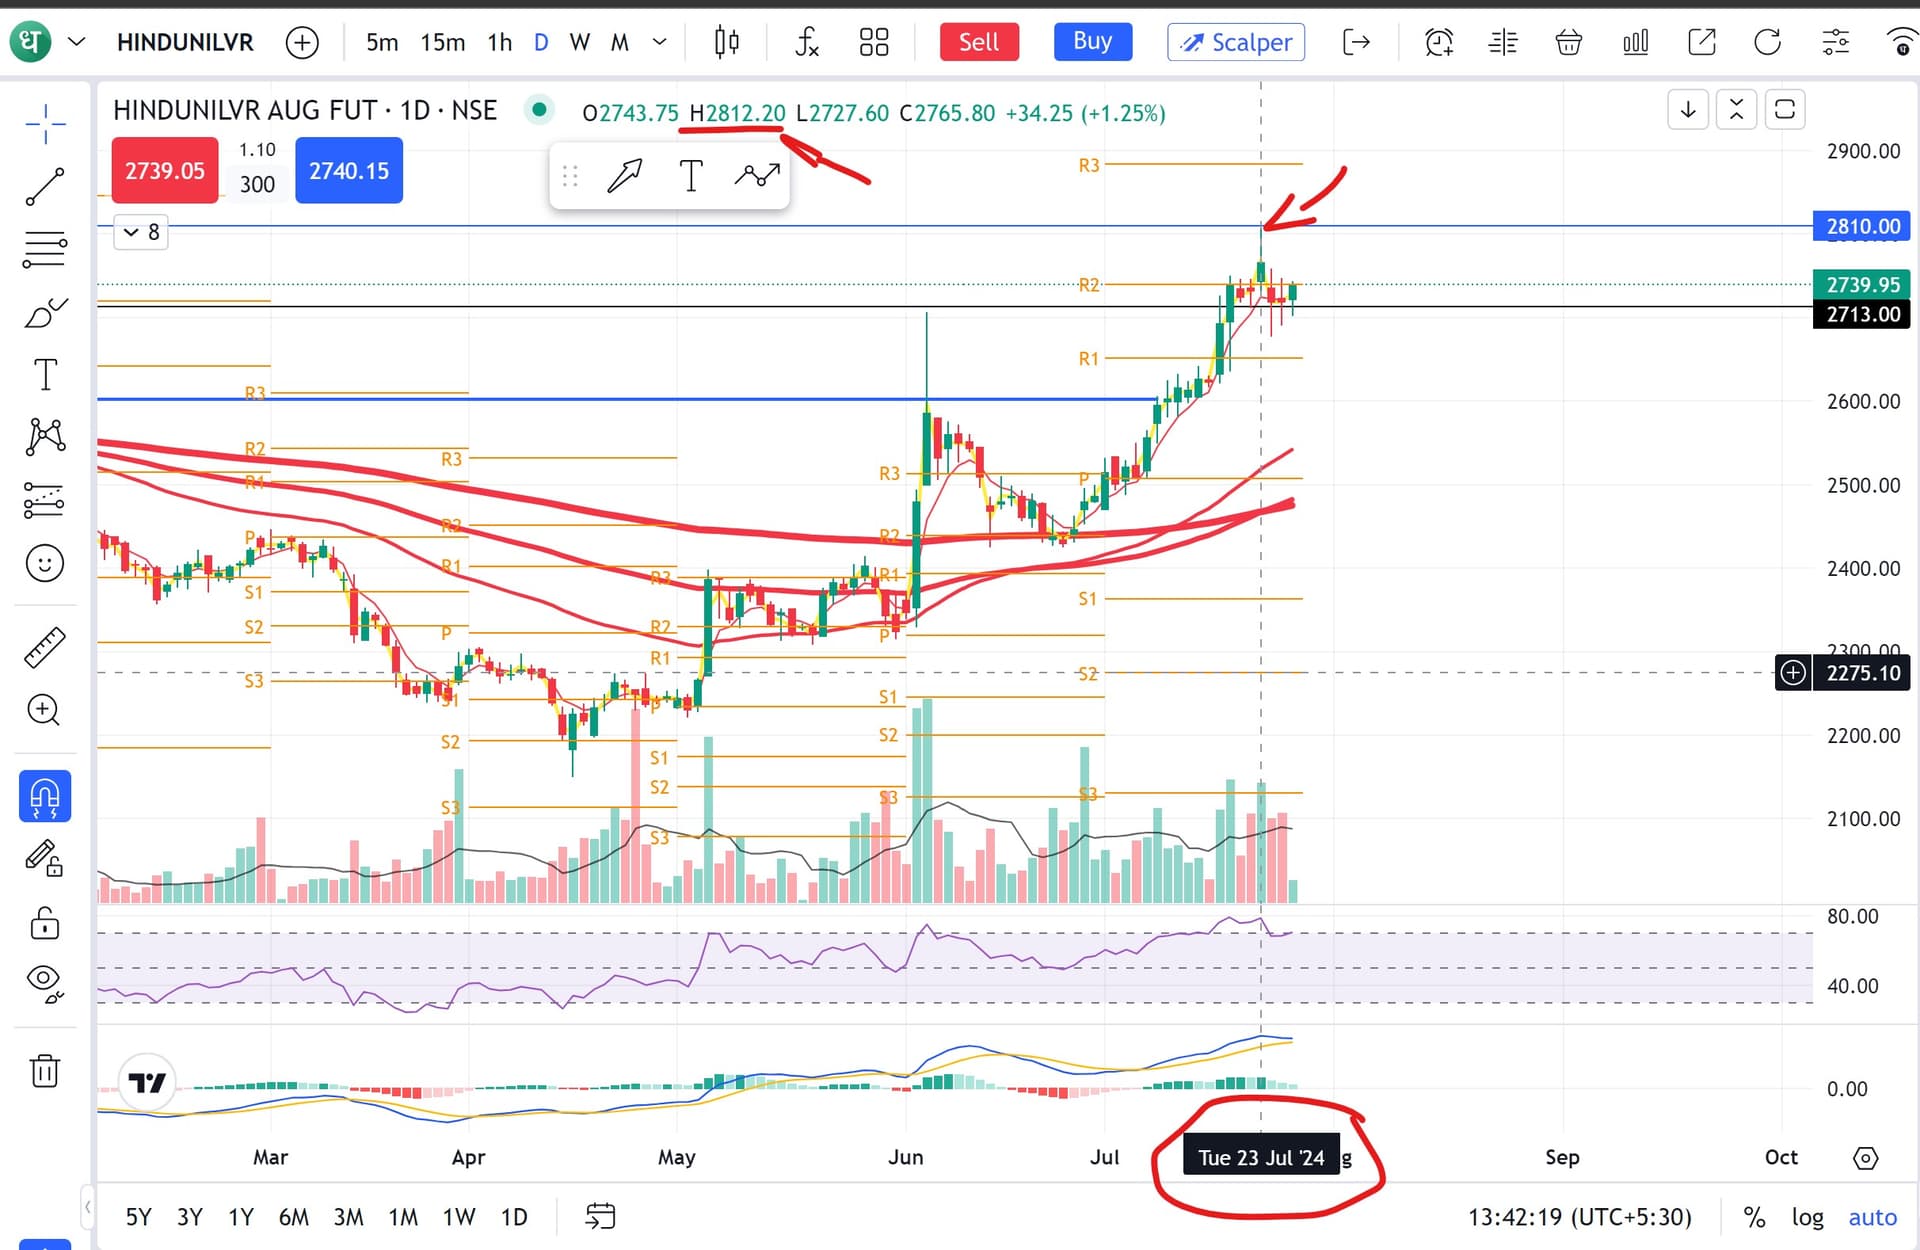
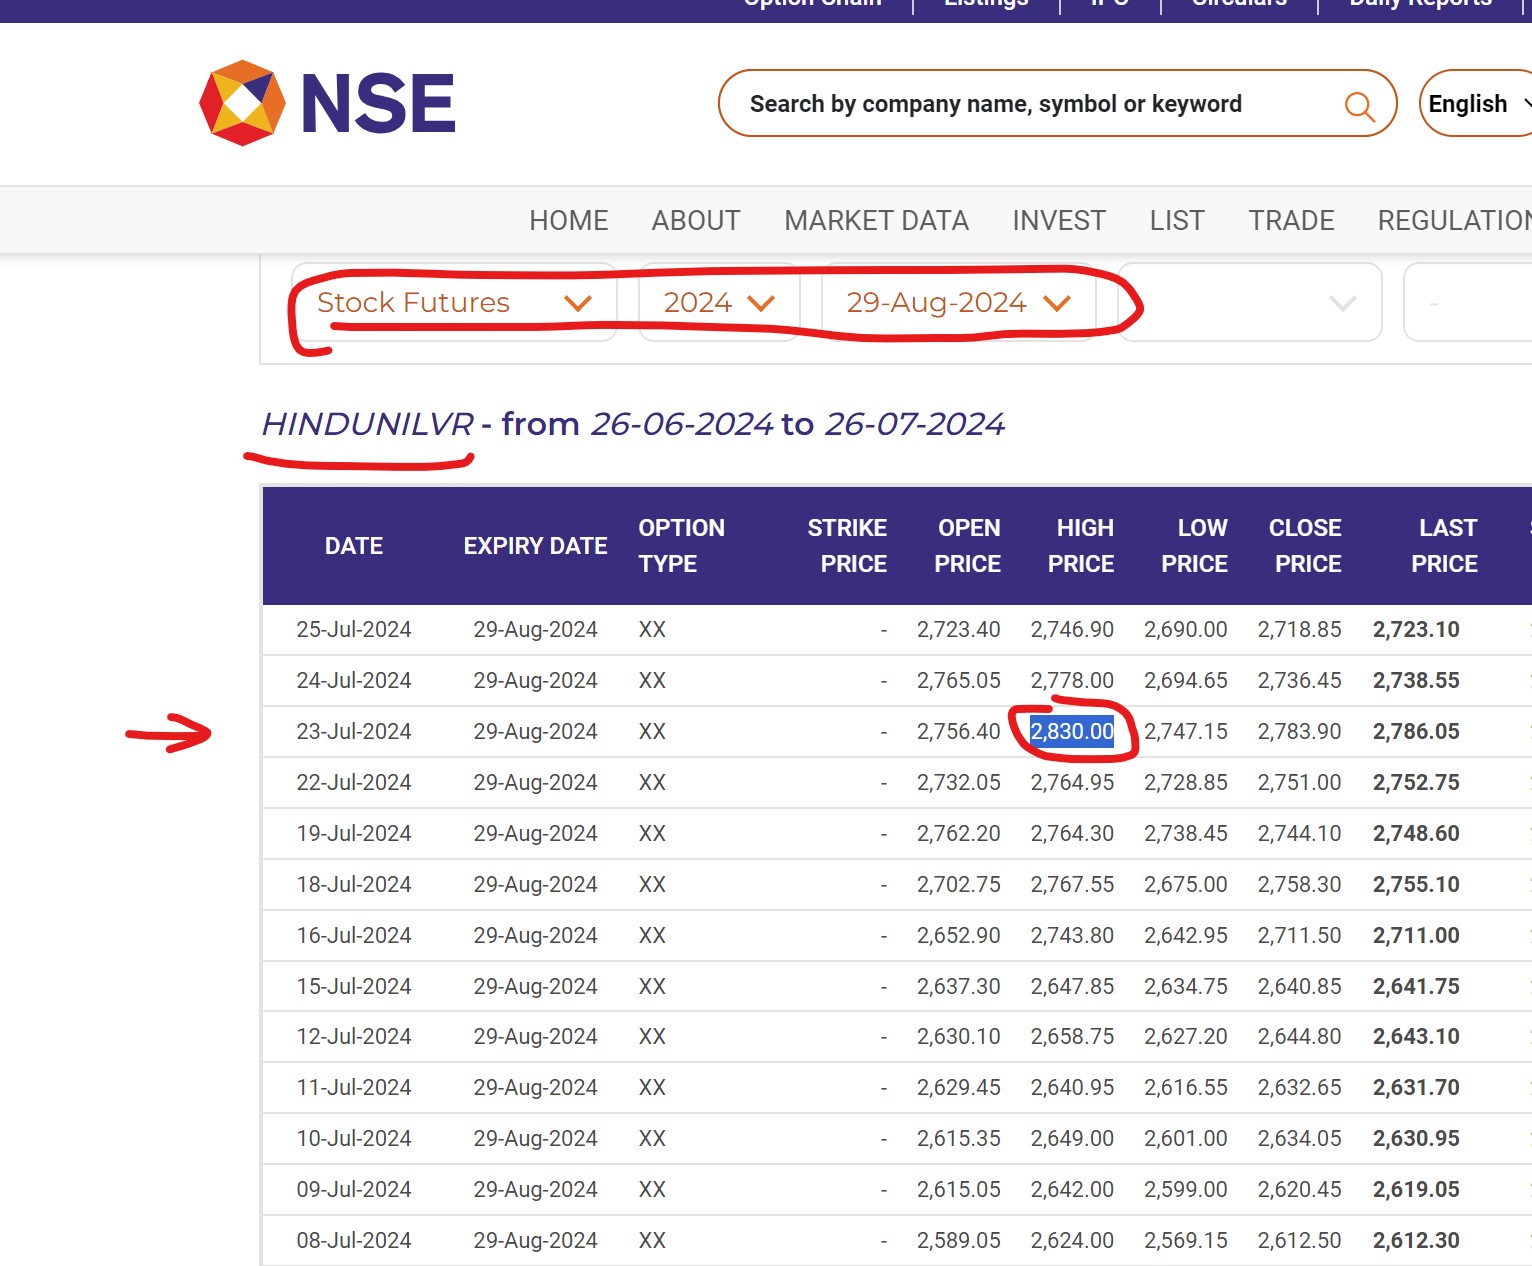
1 Like
This is still a concern as of today, for eg i was in 48400call 24feb where 2:05 was displayed as doji candle on bnf fut and options chrt while its updated to big pinbar candle in eod. hw a buyer will take exit decisions in trading in such cases? . wrong info in such instances is missing opportunities and increase losses. Specially when platform is designed fr ops buyers