Charts on Dhan: What happens behind the scenes and how Charts work exactly?
Hello Traders,
We know that Charts are one of the most valuable tools in any Super Trader’s tool-kit.
By now most of you know that we build Dhan based on continuous feedback & suggestions from our users, and our users reach out to us through lots of channels. Additionally with Dhan, we just don’t launch features - we also build upon them and continue to enhance them with time. We believe in addressing every query and also evaluate all the suggestions we get.
We provide you incredible charting experience on Dhan in a special partnership with TradingView where more deeper integrations and trader friendly tools and capabilities are introduced, and few of them are industry first including one of our favourite is ability to execute orders (single or basket of orders) directly from TradingView using free Webhooks that Dhan provides. As always, Dhan gets better everyday and there is more to come.
While we continue to receive appreciation, suggestions and feedback from our users, we have also received concerns on price differences in live charts, slowness or lag on Dhan charting platforms and in many cases where users have compared price / data on Dhan with other platforms or charting tools.
As these charting libraries are a core part of our product experience and traders actively use this, we thought it would be best for us to explain to our users what goes behind the scenes and how charting platforms work and render data when they are at work.
For starters note that:
- The market data for building these charts comes directly from live feeds of stock exchanges via our servers that are connected by dedicated leased lines to exchanges.
- We are directly connected to all three exchanges - NSE, BSE and MCX.
- We do not source live feeds data from any third party or data provider, it is sourced directly from stock exchanges.
- At Dhan, we keep > 60% bandwidth free at all times to ensure your orders are instantly sent to exchanges.
- We serve data feeds independently to all our platforms - which means we have dedicated and multiple servers to serve live exchange data for all trading platforms be it Web, Mobile or TradingView.
With that, let me come to some of the explanations on how charts work and questions that get asked to us frequently from traders who use charts.
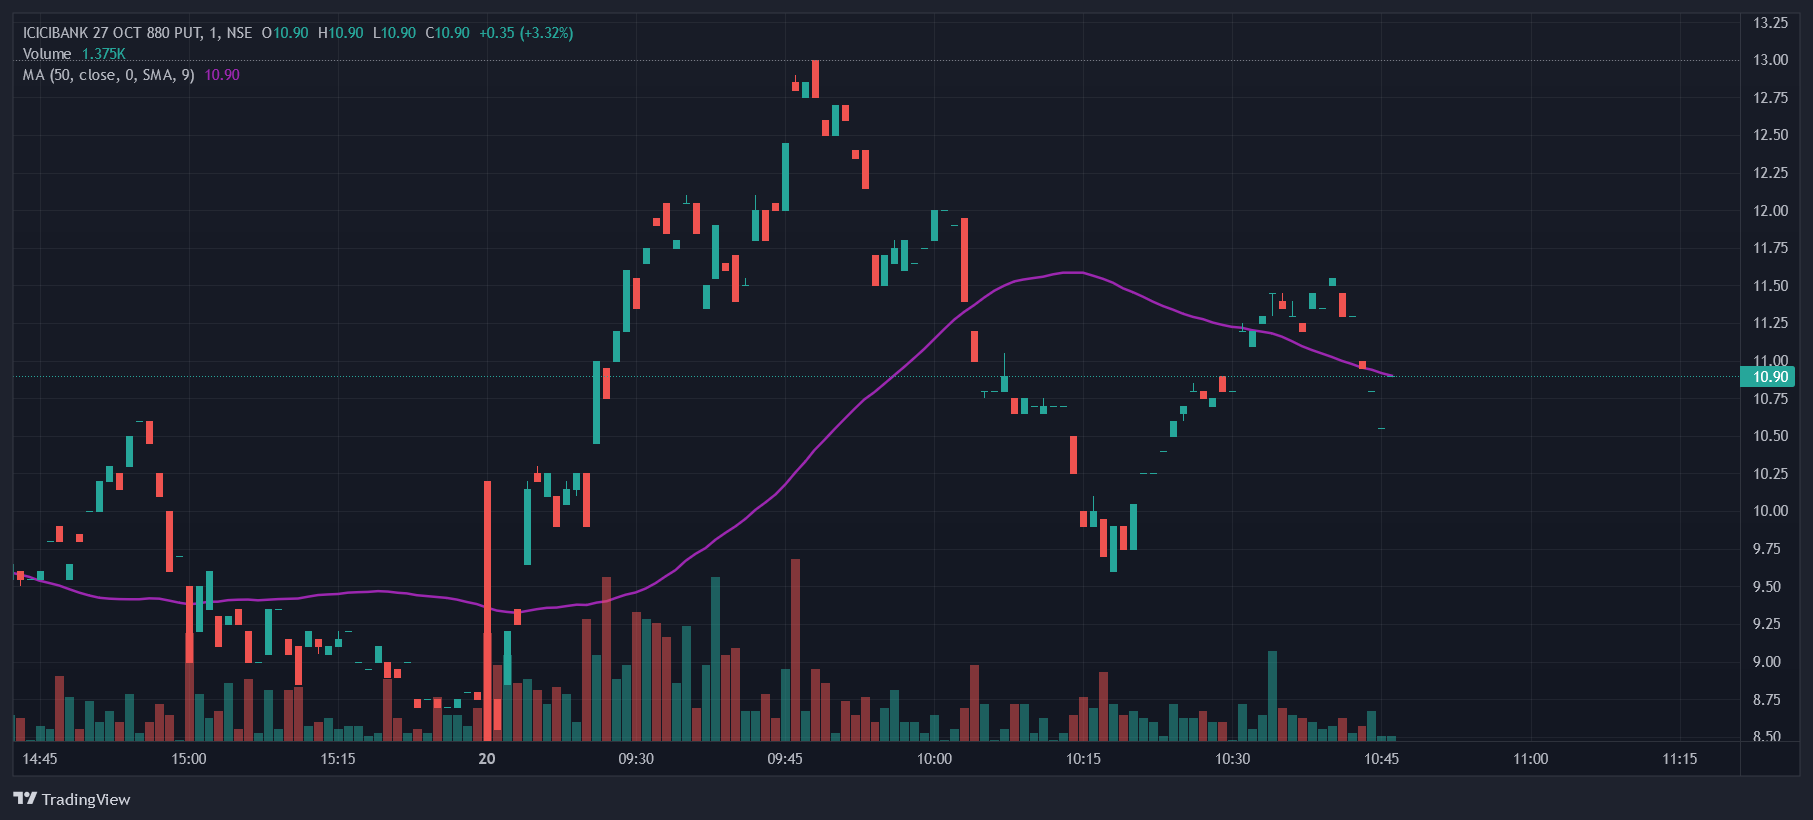
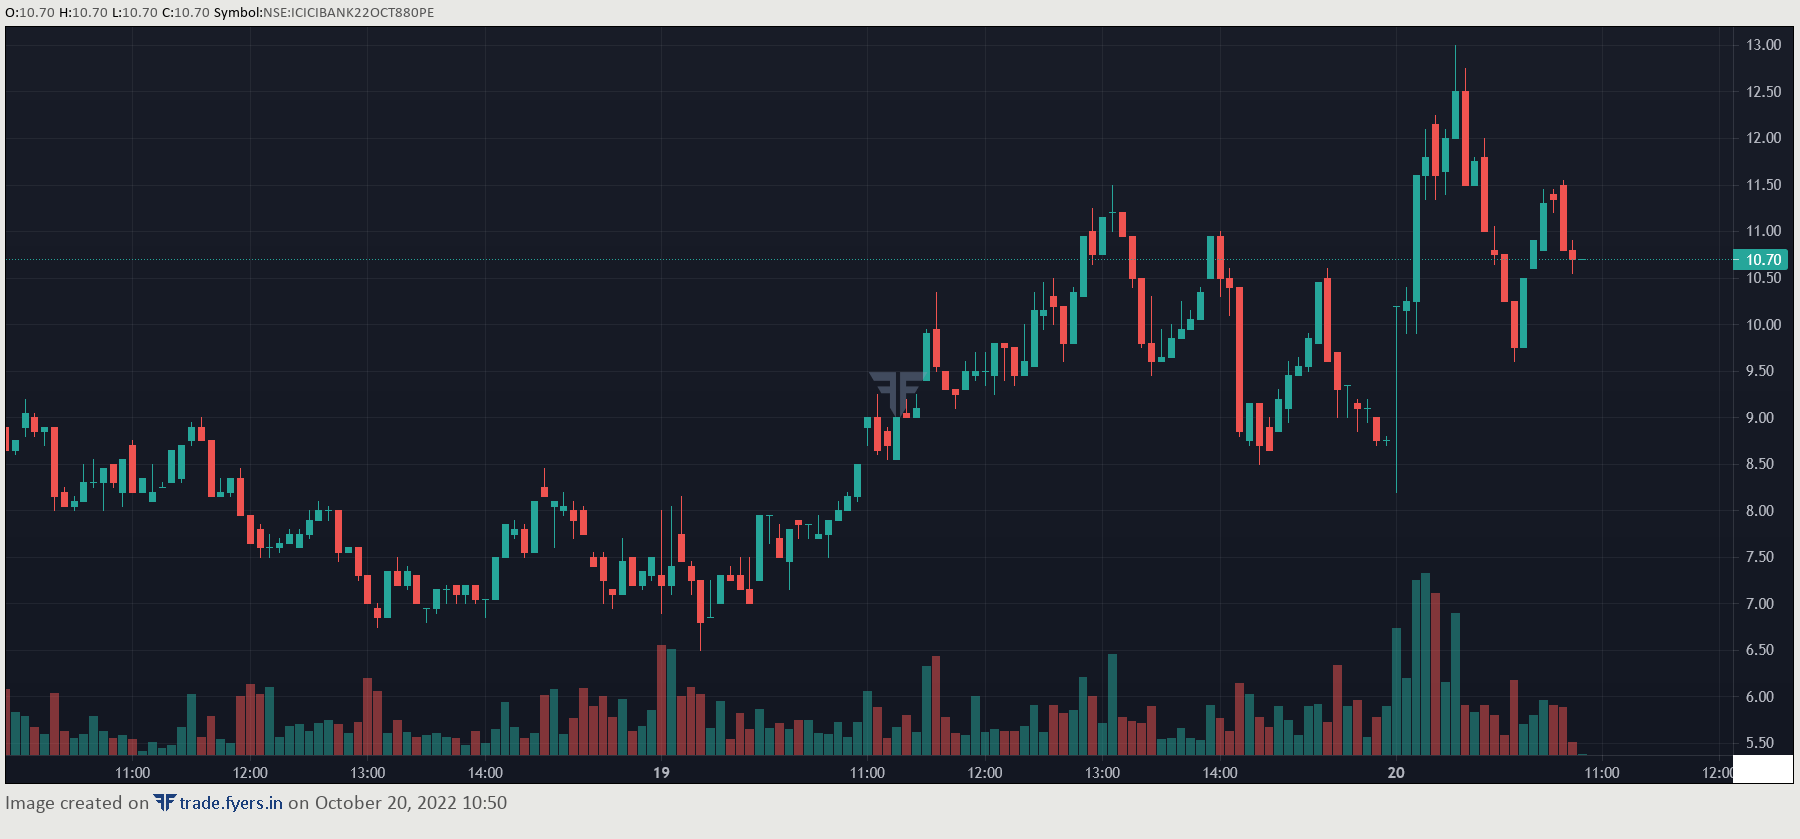
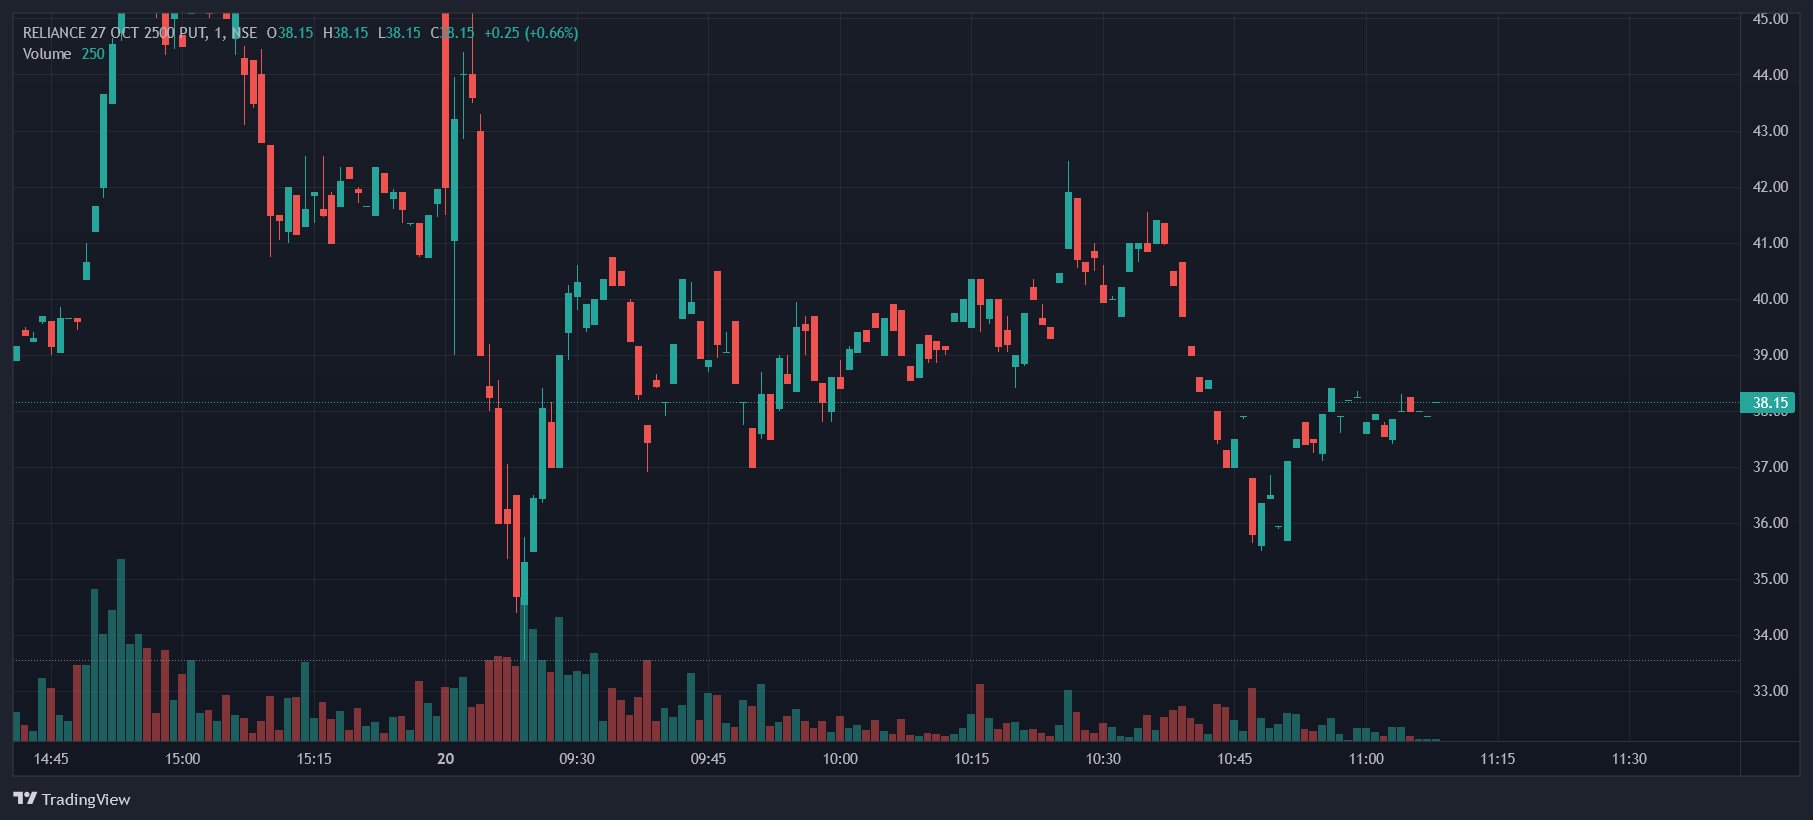
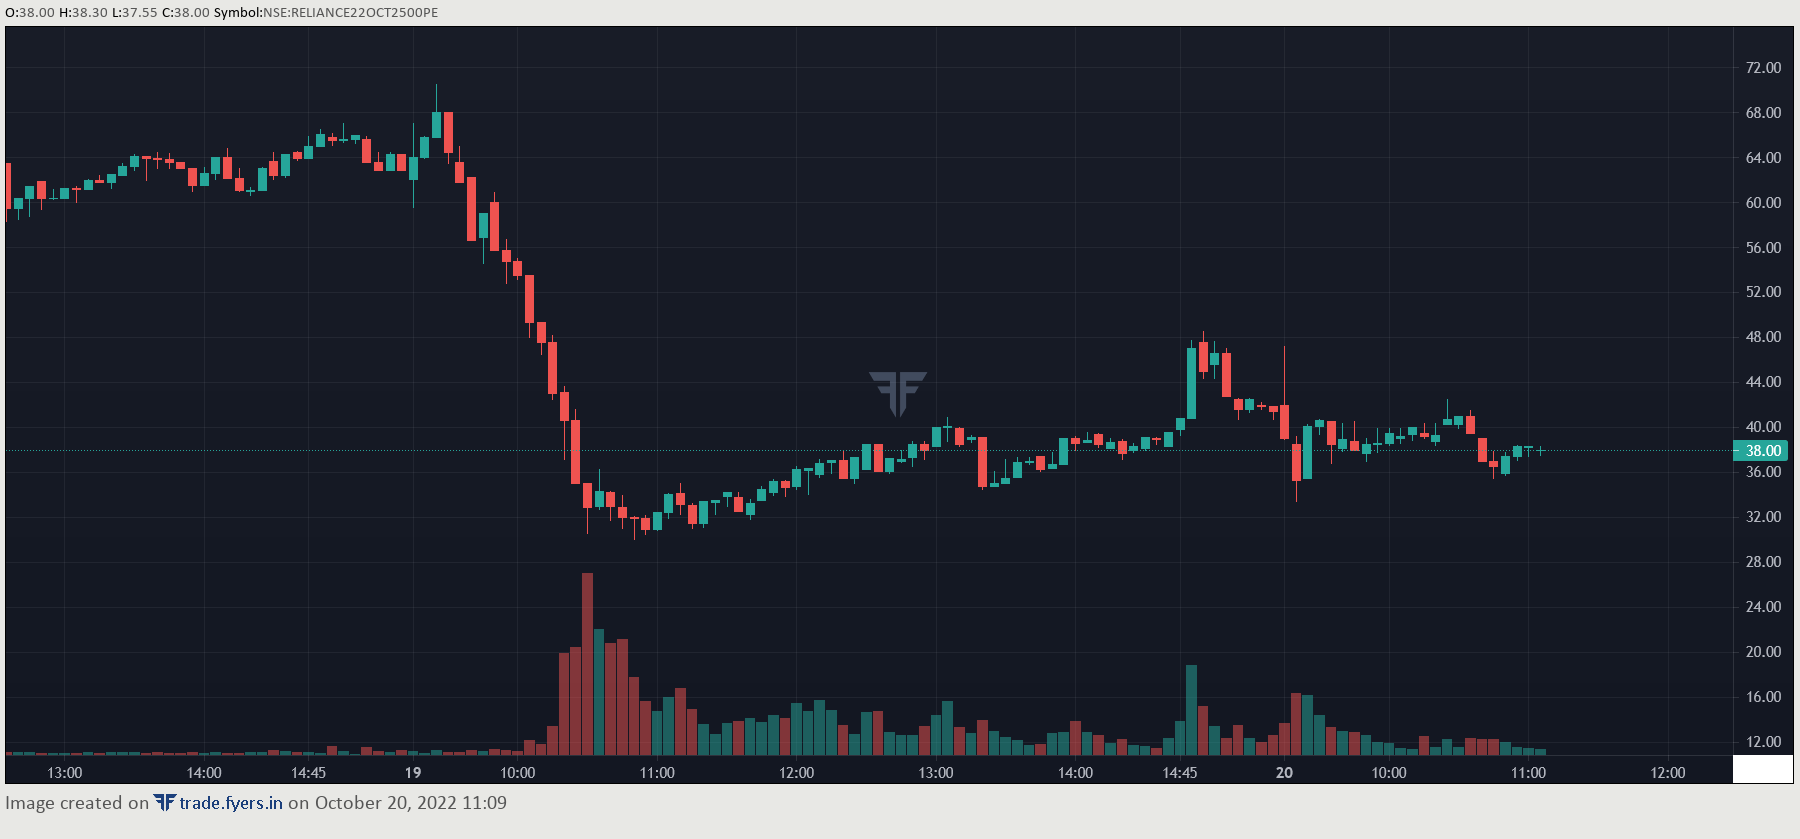
Why is there a difference in charts between two charting platforms?
To explain this, let’s start with how charts are created in live markets. There are two scenarios here
- When you open charts in non-trading hours, charts data come from servers where it is stored
- When you open charts in trading hours, past data again comes from servers, and the live data of the selected time-frame comes from live market price ticks from exchanges.
Yes, so the live data for the ‘currently selected time-frame’ is first rendered on your charts and then it is saved in the background the moment the time-frame ends as OHLC (Open High Low Close) for that timeframe. This means that there is a good chance of some price ticks getting missed by your device due multiple reasons - the moment you land on the chart, the connection at time of request made and also as a result of internet drop or packet loss (which is quite common in India) - and this may happen despite the fact that you are connected via 4G, 5G, broadband or a leased line.
As a result of this, there will be a slight difference in the chart displayed. However, when you look at past candles, there is no margin of data being lost as our chart data servers are present within the same data centre as our streaming servers and the data is continuously saved on server side.
To take an example, when markets go live at 09.15, if you open a chart with 1 min time frame, the candles getting formed are based on live data received on your device over the internet. Once the candle starts forming, it is possible that you might lose a couple of ticks in between due to intermittent internet connection which may create a slight difference in the formed chart.
Now, if you are on the chart for 10 minutes i.e. till 09.25 and then refresh the chart, you may observe the previous 10 candles being changed slightly. This is because when you refresh or reload, this time the chart fetches the data from our chart data server which does not have any missing price ticks.
One underlying phenomenon here is that you might have opened the chart at 9:15:20 in the beginning which implies 20 seconds after the minute started. Since, the data comes from the historical data server only after a minute is completed, the chart thus formed might lose some ticks from the beginning as well.
Again, these are rare scenarios where you will find noticeable differences in charts between two charting platforms. However, it is our priority to keep our users informed, always.
How did my order get executed at a price which the chart never reflected?
Market data for every stock / instrument comes directly from the stock exchange. Exchange processes millions of transactions each day which translates to a lot of transactions per second.
Now, each transaction represents a tick. However, it is not feasible even for exchanges to send all of this data via ticks as every tick is a representation of all transactions that happened in that ‘moment of tick’. So as an industry standard, a snapshot of a tick is sent by the exchanges to the data feeds or market tick by tick data, which results in the end user seeing the price of the stock / instrument as an LTP.
This tick is shown on your device which is live market price and the same data is used to plot charts. Now, this per second tick is one of the many hundred ticks that take place on the exchange every second. So, it is quite possible that sometimes your order gets executed at a certain price without that price getting reflected on your screen.
We have also come across instances where the OHLC has adequate information, but the same was not even reflected on the exchange’s own stock graphs / charts.
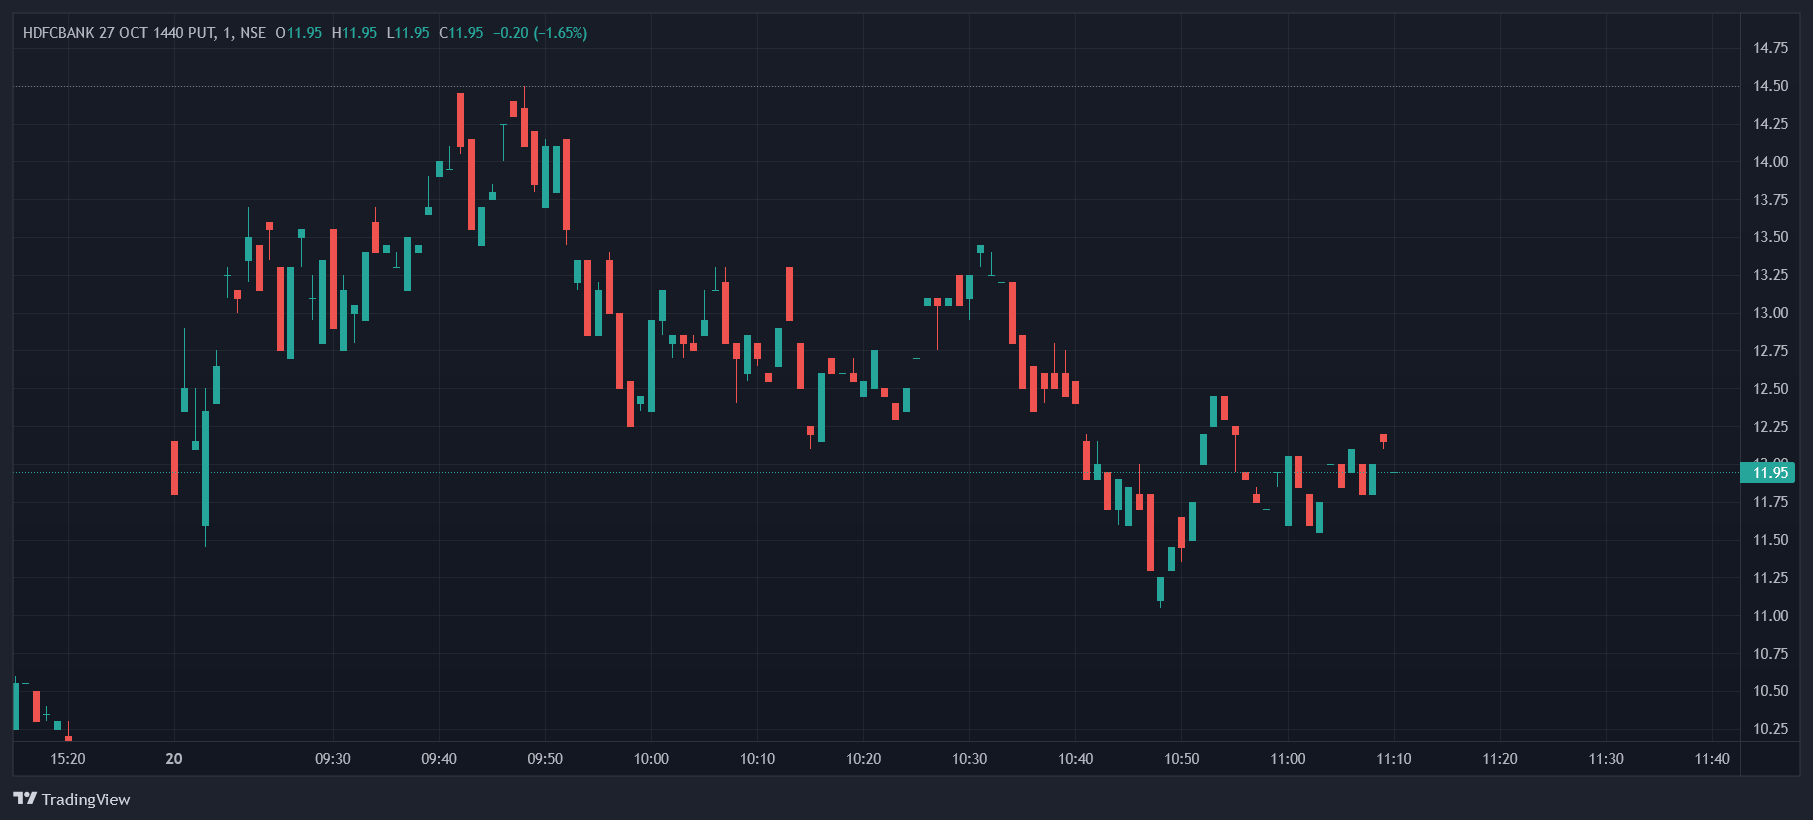
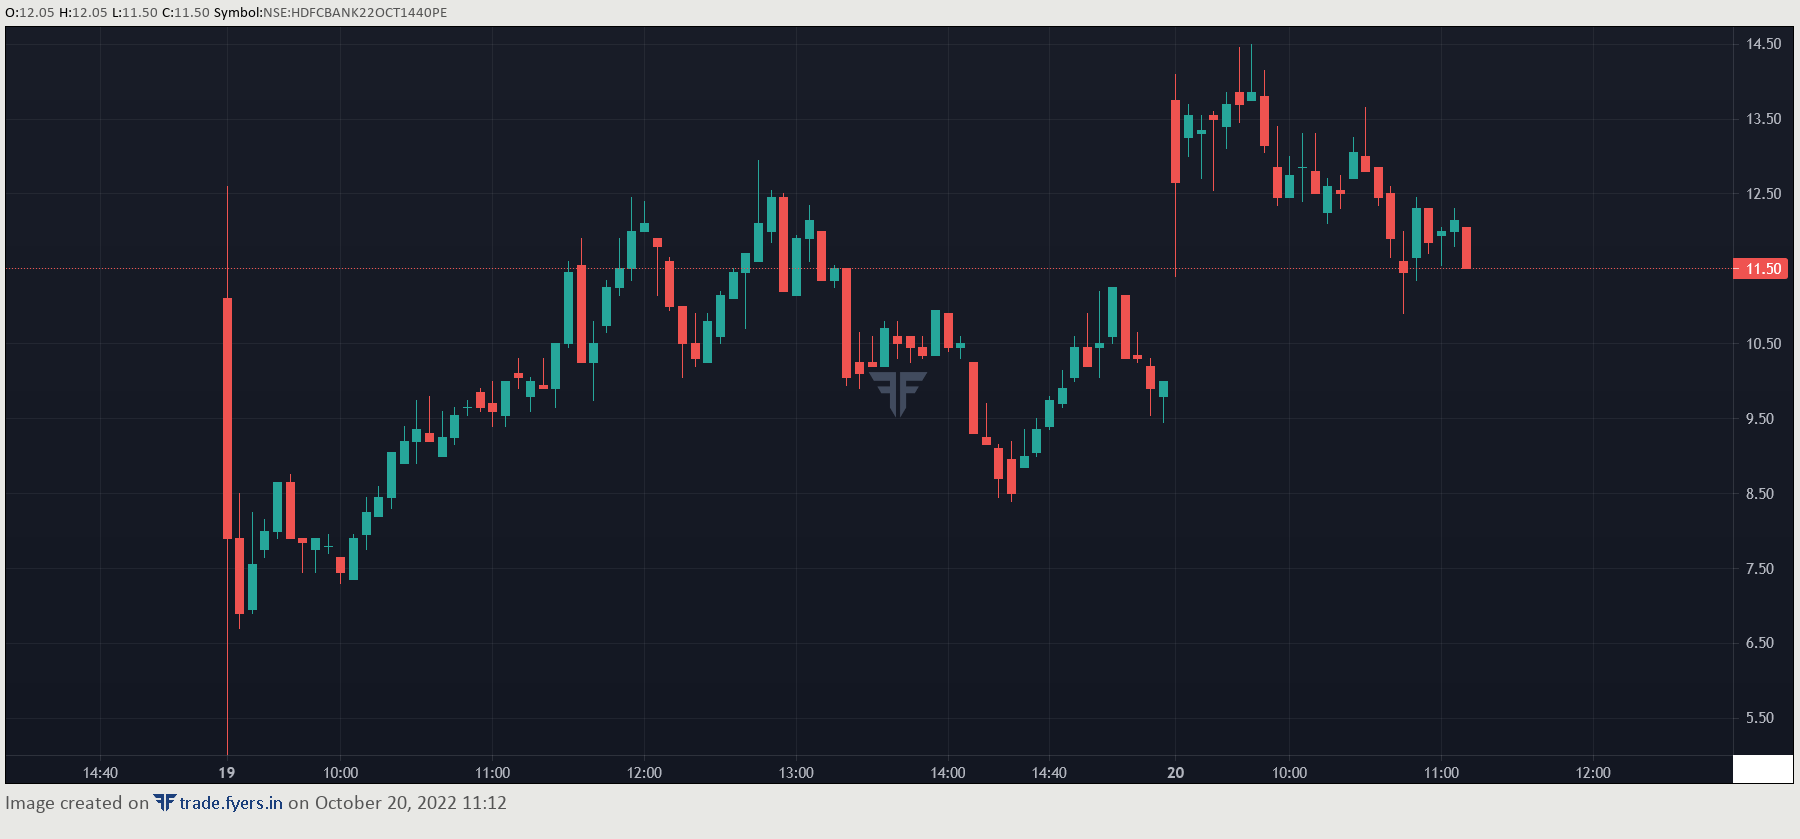
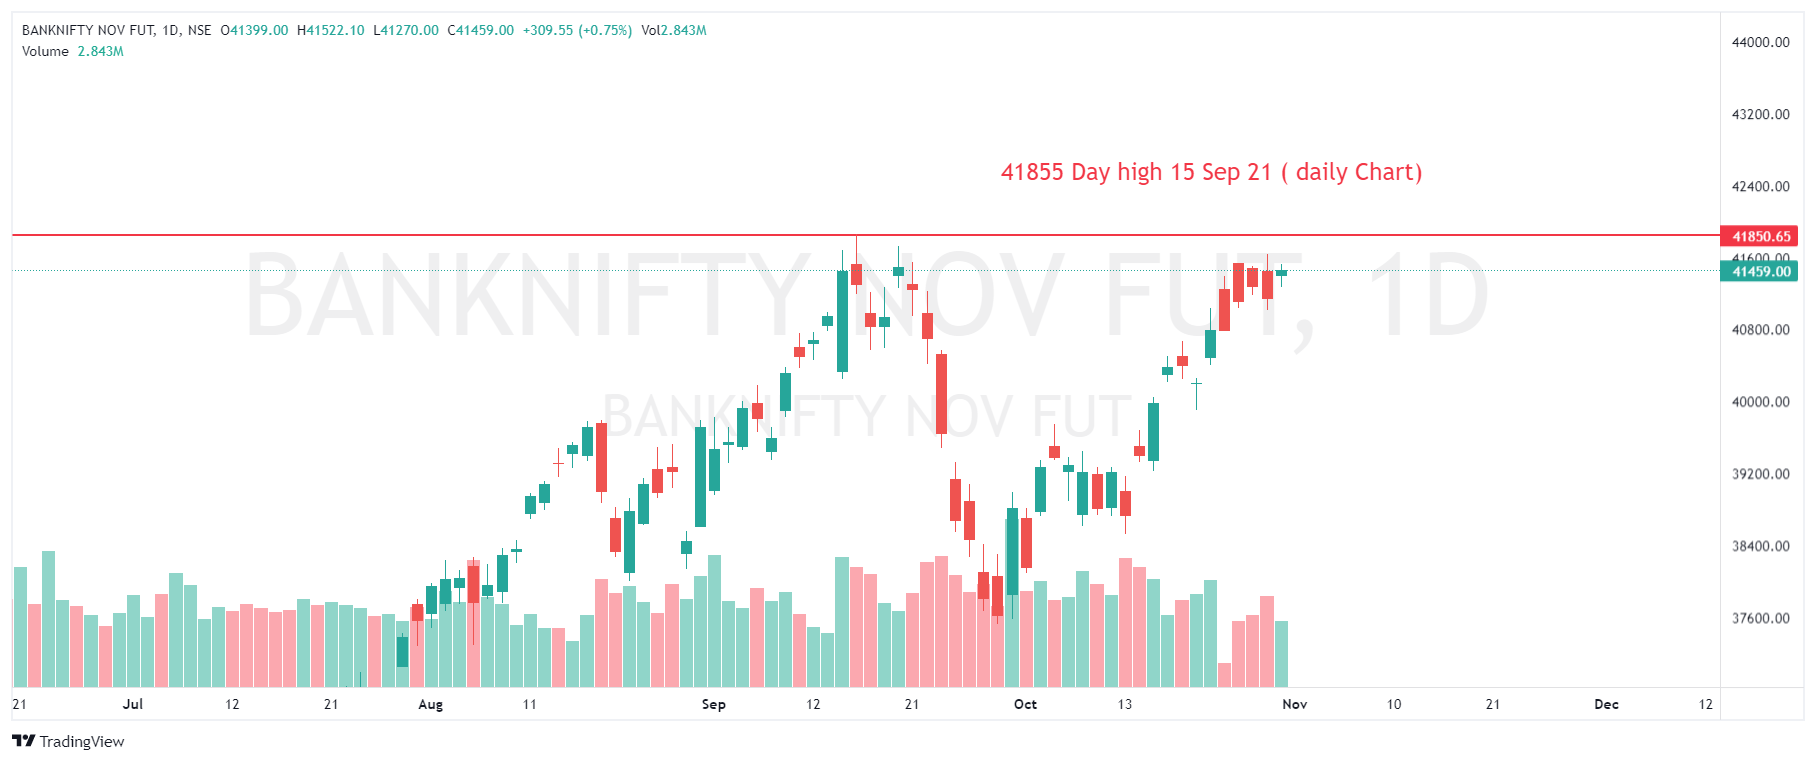
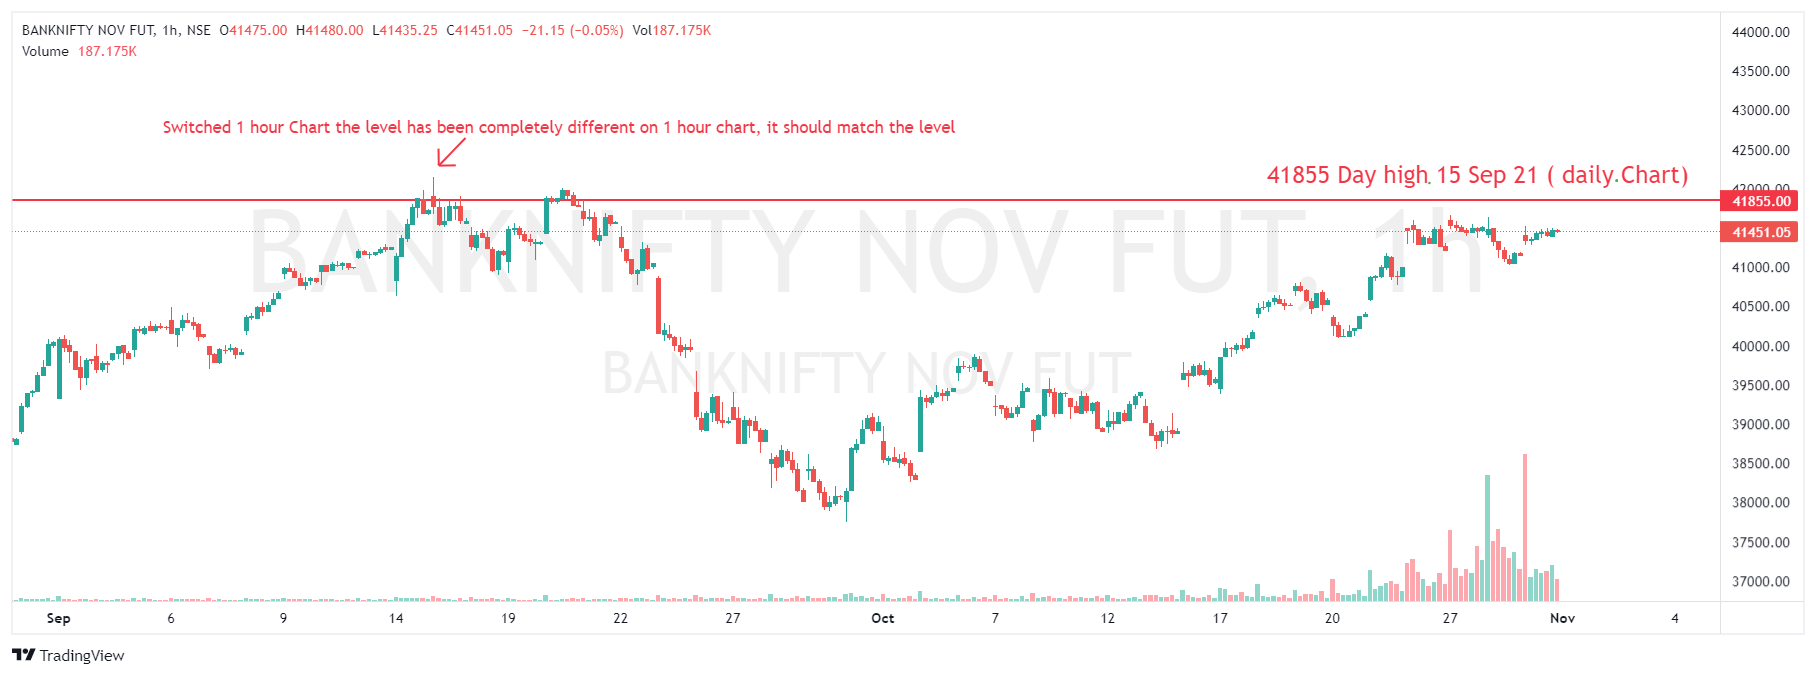
Is it possible that a chart in the same time-frame will be different across different brokers?
Yes, it is absolutely possible for that to happen and in it happens as well.
Beyond the two reasons that we have explained above there are many things that happen on the backend behind the scenes - which means where are our servers located, where are the stock exchanges servers located and to which of those servers of stock exchange we were connected at that moment and more. Also to be noted that this is just connectivity between exchange and the broker, and similar to this is the connectivity that you have with Dhan as a broker.
All of the above results in multiple permutations and combinations, and as result - yes it is possible to have different charts for the same stock or scrip in the same time-frame.
But I am on a high-speed broadband connection, why are my charts stopping in between? This shouldn’t happen.
Yes this can happen. Please note that the marketed speed of your broadband connection and the speed of actual data transfer are two different things. For example - my current connection as per Fast (dot) com is 140 Mbps but my data transfer as per speed tracking tools like Meter (dot) net are significantly slower. Additionally your data transfer speed is not always constant, it depends on factors like your data consumption on other devices in home, your applications and other usage as well.
From the perspective of charts - when charts are loaded on your browser we connect via your internet connection through websockets where there is an assumption of continuous data connectivity and transfer is available. When data transfer rates drop below required rates, there is an empty tick that is received for that second and it continues. In such a scenario, our charts keep trying re-connecting back to our servers in the background and then charts will be rendered when data transfer is reestablished either automatically or via a refresh.
We also notice many of our users are using our multi-charts facility that’s provided on TradingView console of Dhan on tv.dhan.co, here it has to be noted that when you open a window with 8 charts at once, your that browser tab for chart is consuming 8 times of usual data on that single websocket - so on a lower speed data transfer, this may become more evident.
For staying best informed of your connectivity at all times, we request you to ensure add data transfer tools in your browser / system taskbar of Windows or Mac machines. If you think your connection is good and you have to refresh - we recommend doing a browser refresh over a chart refresh. A chart refresh, will just refresh data that is loaded on the chart and also its indicators, but a browser refresh will load all the charts again and also reconnects the browser with data through our websockets. And don’t worry much here - on Dhan we save your charts, indicators, patterns and all that matters automatically on server side so that you continue to enjoy seamless trading for charts experience.
Concluding Notes:
At Dhan, we are building for an incredible trading & investing experience with a lot of focus on product, technology and customer service experience. Trading systems are hard and also complex, and so are charts. As a team we want to ensure we get your experience right on Dhan.
As always, Dhan keeps getting better everyday.
pj