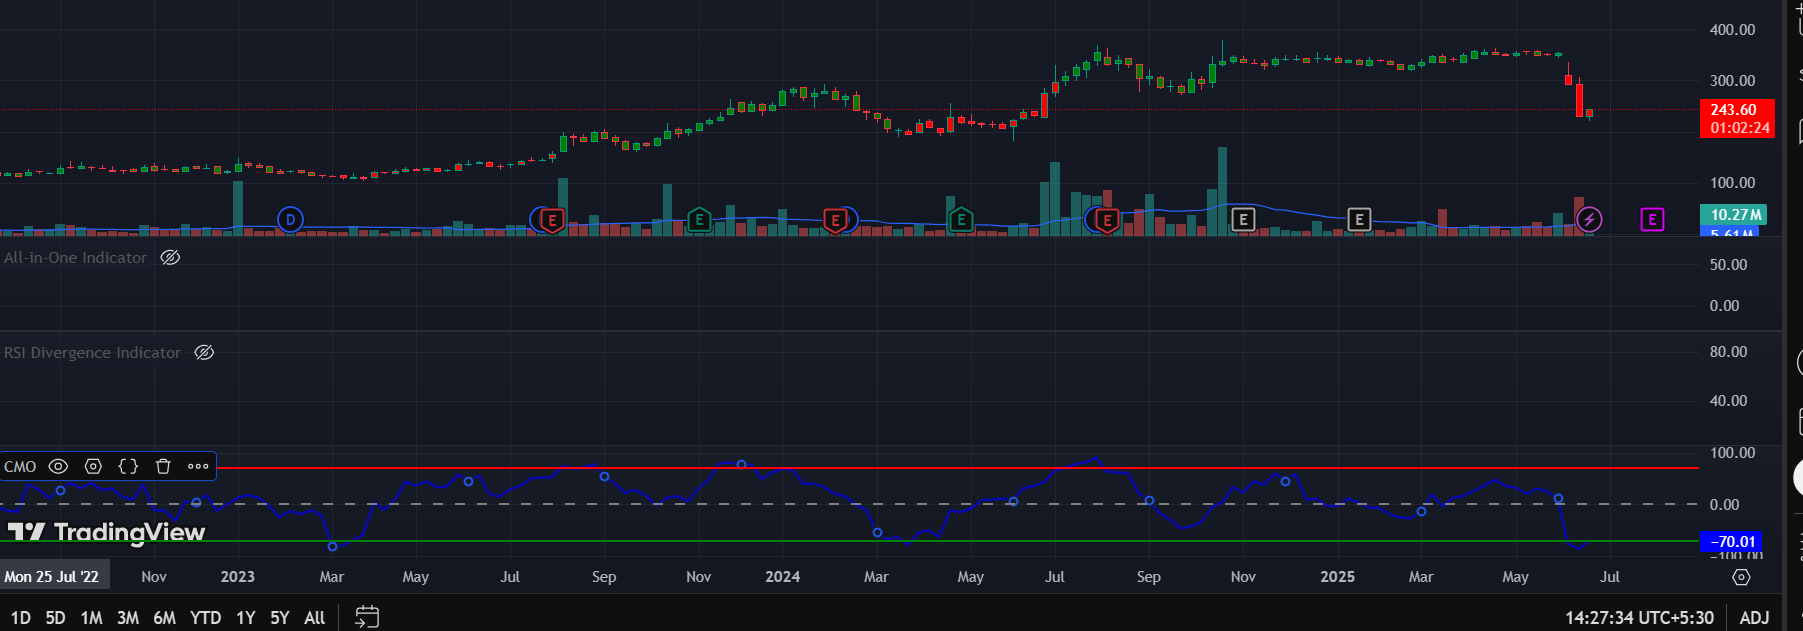
CMO (Chande Momentum Oscillator) indicator currently does not have the option to add custom horizontal line ranges like we can in the RSI indicator.
For better visual analysis, I’d like to request the ability to add two horizontal lines — for example, at +25 and -25 — within the CMO indicator settings. This would help identify overbought and oversold zones more effectively, just like we do with RSI levels at 70/30 or 80/20.
Please consider adding this feature in future updates.
Thanks!
Please add this option.. I have requested this feature in 24 feb 2024 … still i am looking for it .. hope dhan will fix this
- old post - https://private-poc.madefortrade.in/t/i-want-to-add-range-in-cmo-indicator-please-help/22553
If you need script code for fix this - this one ---- CMO (Chande Momentum Oscillator) Strategy — Indicator by HPotter — TradingView
////////////////////////////////////////////////////////////
study(title="CMO (Chande Momentum Oscillator)", shorttitle="CMO")
Length = input(9, minval=1)
TopBand = input(70, minval=1)
LowBand = input(-70, maxval=-1)
hline(0, color=gray, linestyle=dashed)
hline(TopBand, color=red, linestyle=line)
hline(LowBand, color=green, linestyle=line)
xMom = abs(close - close[1])
xSMA_mom = sma(xMom, Length)
xMomLength = close - close[Length]
nRes = 100 * (xMomLength / (xSMA_mom * Length))
pos = iff(nRes > TopBand, 1,
   iff(nRes <= LowBand, -1, nz(pos[1], 0)))
barcolor(pos == -1 ? red: pos == 1 ? green : blue )
plot(nRes, color=blue, title="CMO")