Hello
If we want to see a stock s relative strength to a benchmark index (may be Nifty 50 , or its sectoral index) , what is the indicator available in Dhan , which we can use
This is a very useful indicator which says whether a sector is over performing and under performing with respect to others in the market
Hi @Sandeep_Khurana, thank you for your suggestion. As of now, Dhan does not have a dedicated indicator for measuring the relative strength of a stock against a benchmark index like Nifty 50 or its sectoral indices. which is also called as stock Beta.
However, your feedback is well noted. We understand the importance of such an indicator or beta value for analysis, and we’ll consider this for future enhancements to improve your analysis experience on the platform.
2 Likes
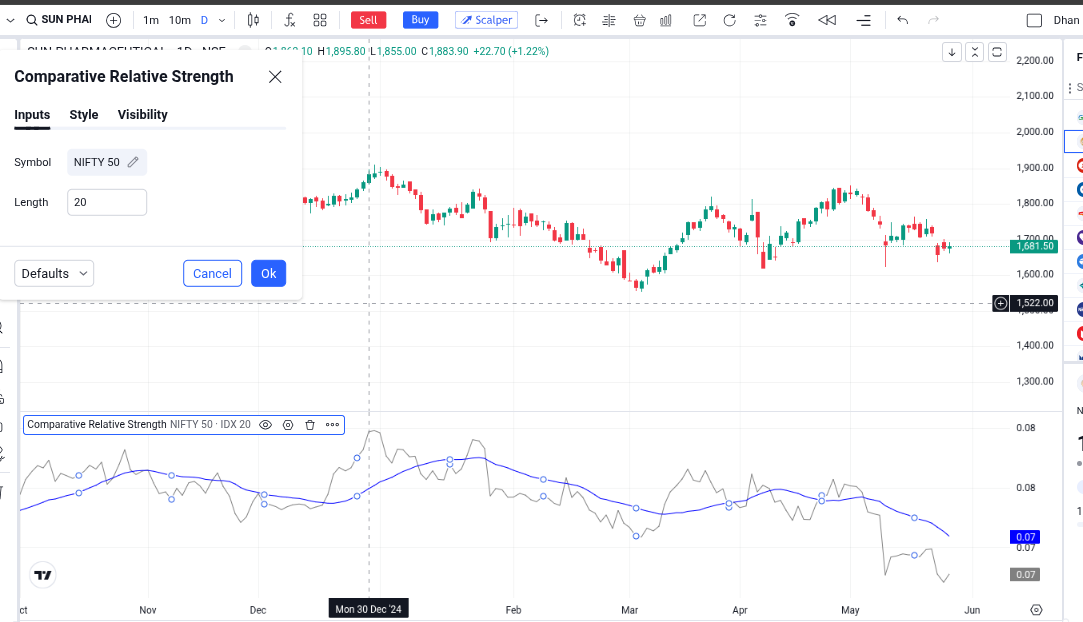
@Sandeep_Khurana As discussed over the call, thank you for your time and for allowing us to understand your query. The Beta of a stock helps measure its volatility in comparison to the broader index, and if you’re looking to understand performance trends relative to an index, the Comparative Relative Strength (CRS) indicator is more appropriate.
This indicator highlights whether a stock is outperforming or underperforming a benchmark index over time. Here’s the attached screenshot for better clarity on how the CRS indicator appears on the chart.
Thanks for the update.But how to interpret this indicator . E g. In this case , nifty value and sunpharma value is given .So if the stock value is higher than nifty value it means it has outperformed the latter
Please confirm if my understanding is correct
And if we want to see it for 55 days , where we can do this setting
Hello Mohseen , I can see two lines appearing for CRS .
How to interpret this
How do we know that the stock is over performing or underperforming the benchmark
Hi @Sandeep_Khurana
The CRS line reflects how a stock is performing relative to the chosen benchmark (like Nifty 50).
- If the line is rising, it means the stock is outperforming the benchmark.
- If the line is falling, the stock is underperforming the benchmark.
1 Like
but sir its very strange that you provide overlapping indicator on some indicator and why not on others. its really difficult to create a scanner and these are also not available on scanx
So , it does not matter whether CRS line is above zero or not .
I thought if it is above zero , it is always performing above benchmark index