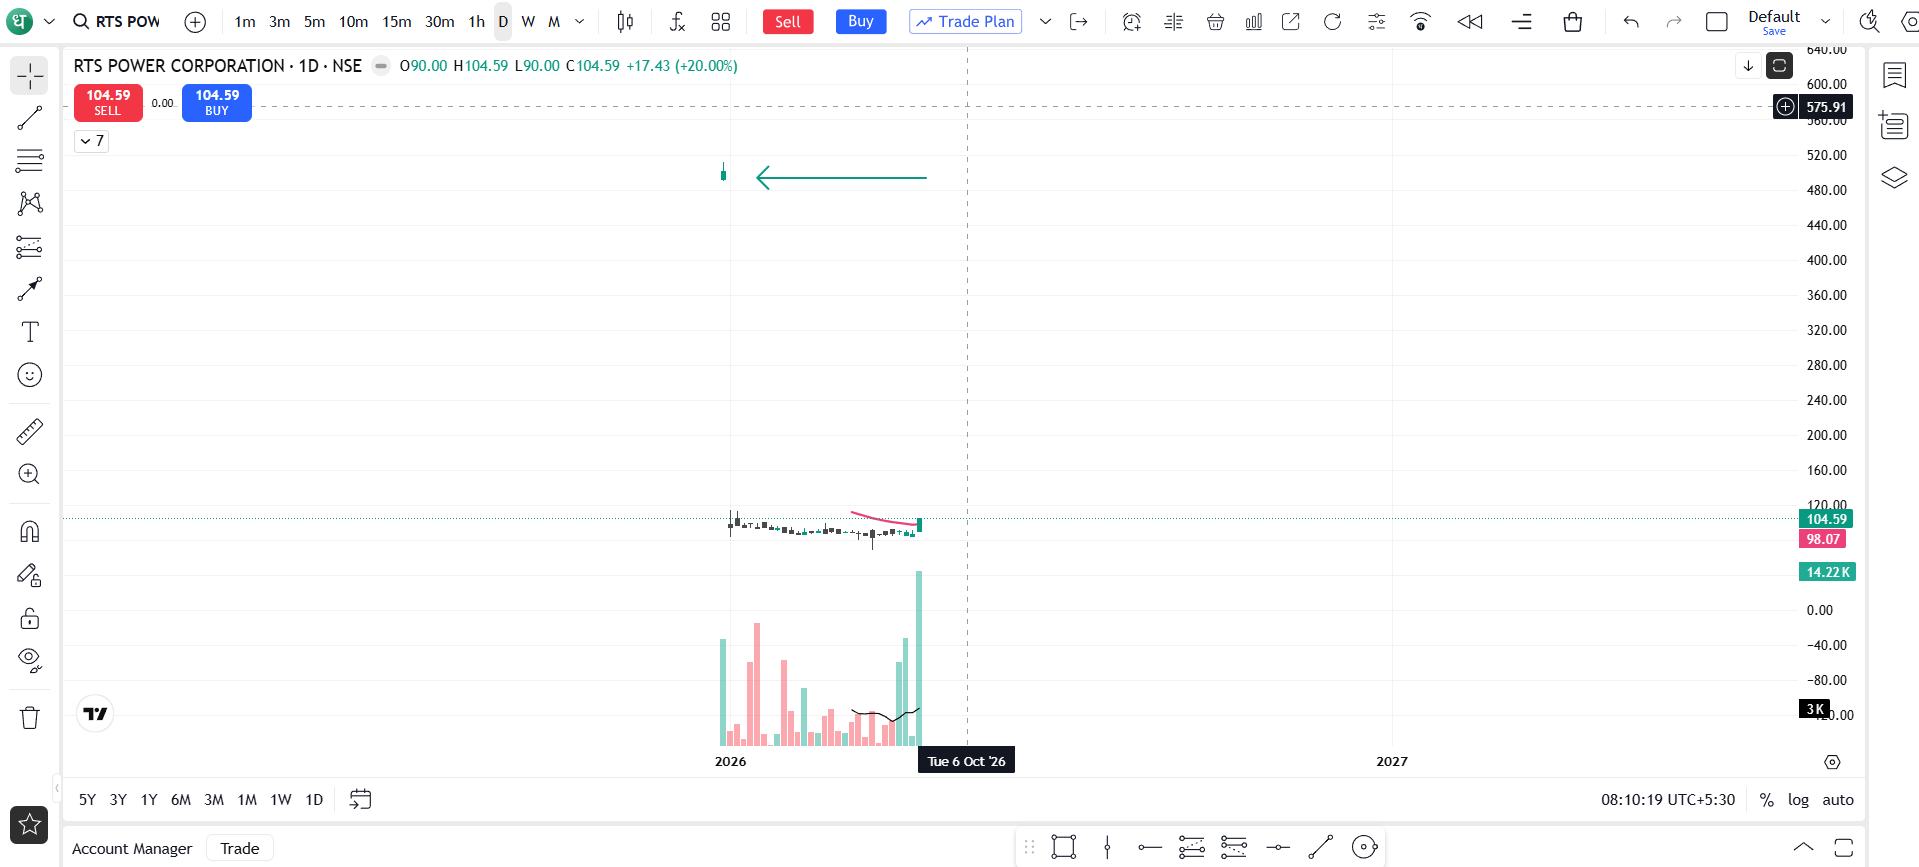
I would like to report a data accuracy issue with the RTS Power Corporation daily chart.
As shown in the attached screenshot, the chart appears to contain incorrect historical price data. The chart is displaying a very large price level around ₹500, while the subsequent historical candles are around ₹90–₹105. This creates a significant discontinuity in the price history and makes the chart misleading.
Request
Please verify the OHLC and corporate-action-adjustment data for RTS Power Corporation and correct the historical chart if the data is incorrect.