A lot of traders I have come across relied on a particular pattern for analysis: Gravestone Doji Candlestick Pattern.
Meaning
Gravestone Doji is a type of Doji pattern that arises when a security’s opening price, low price, and closing price are very similar.
This candlestick pattern can be witnessed at the top of the chart when the security prices are at a very high point and then after which you can expect a fall in prices.
Gravestone Doji is formed when the opening price of a security is almost similar to the closing price.
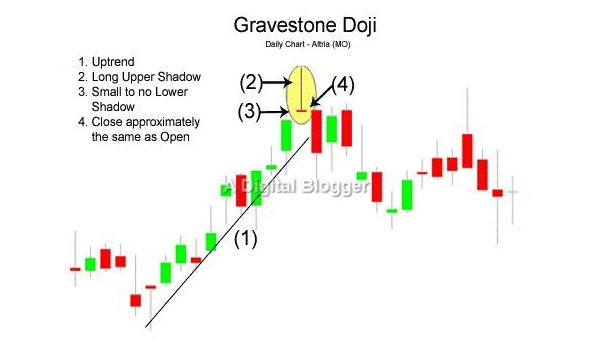
It looks like the letter “T” that is turned upside down in which the body lies below the candlestick chart and the long shadow-like line lies above it.
The same opening and closing prices indicate that there are many buyers for particular security in the market which leads to a rise in demand and hence prices are rising.
The shadow line above the body indicates that security prices have reached their resistance level after which there will be a direct fall.
This fall in price will lead to high selling in the day and hence the upward trend will get corrected.
Now that you have understood the meaning, let’s understand Gravestone Doji’s usage.
Usage of Gravestone Doji
A pattern that has Gravestone in it has to be bearish, right? It is. Gravestone Doji is a bearish indicator that arises after an upward trend in security prices.
The indicator is used as a sell signal. The final decision should be taken after analyzing other technical indicators such as moving average convergence divergence (MACD), Fibonacci levels, and relative strength index (RSI).
Along with these indicators, you should also consider the volumes traded in the day.
So far, we have spoken about the basics of Gravestone Doji. Let’s deep dive into the examples.
Example of Gravestone Doji Across Trends
1. Usage in Upward Trend
When the Gravestone Doji is formed after an upward trend in security prices, you can expect that prices are more likely to fall in the future.
In this case, you should buy the security when the first candlestick closes just beneath the low point of the Gravestone Doji. The main idea is to sell the security in the short run just within a day. You can set a stop loss beyond the high level of the candlestick pattern.
The decision should be taken after analyzing the RSI indicator to check if the security is in an overly bought situation. For example, if the RSI is 80, then it will indicate that security is over-purchased. This means that your decision is correct to sell the security because the signal of RSI aligns with the Gravestone Doji pattern.
2. Usage in Downward Trend
When the Gravestone Doji is formed after a downward trend in security prices, then it does not guarantee that prices will rise. Rather than this, the prices will continue to fall further and therefore you should sell the security.
In this case, you can sell the security when the first candlestick closes below the Gravestone Doji. You can set a stop loss just above the high level of the candlestick pattern.
Drawbacks of Using Gravestone Doji
Gravestone Doji helps you analyze past patterns in security prices on which you can predict the future but it certainly has some drawbacks which are as follows.
1. Indicate a Wrong Trend
This indicator tells you that once the prices rise to a point, they will show the reverse trend and start falling but that does not happen in every situation. So, you have to wait for the next candlestick pattern and analyze some other indicators to take the best position.
2. Not Ideal for Bearish Trend
Gravestone Doji only tells you about the upcoming bearish trend when the prices are rising today. It does not show the correct signal when the prices are already falling. Therefore, you should not expect that the reverse trend will happen when there is already a bearish trend.
3. Not Dependable in Some Conditions
You cannot depend on this indicator in some situations like low trading volume where you cannot see a relevant pattern in security prices. Also, the pattern may vary in different markets and the time at which you are studying the security prices.
4. Not Good for Long-Term
Gravestone Doji is best for short-term market positions and not for the long-term because high fluctuations are more likely to happen in the short run. Therefore, it is ideal only for day traders and not for value investors.
Conclusion
Gravestone Doji is a technical indicator that tells you more about a bearish trend in the future when the security prices are going up.
It looks like a flipped “T” shape where the closing, opening, and low prices are almost similar.
Typically used as a Sell signal, you can add indicators such as MACD on top to ensure that you’re not fooled by randomness.