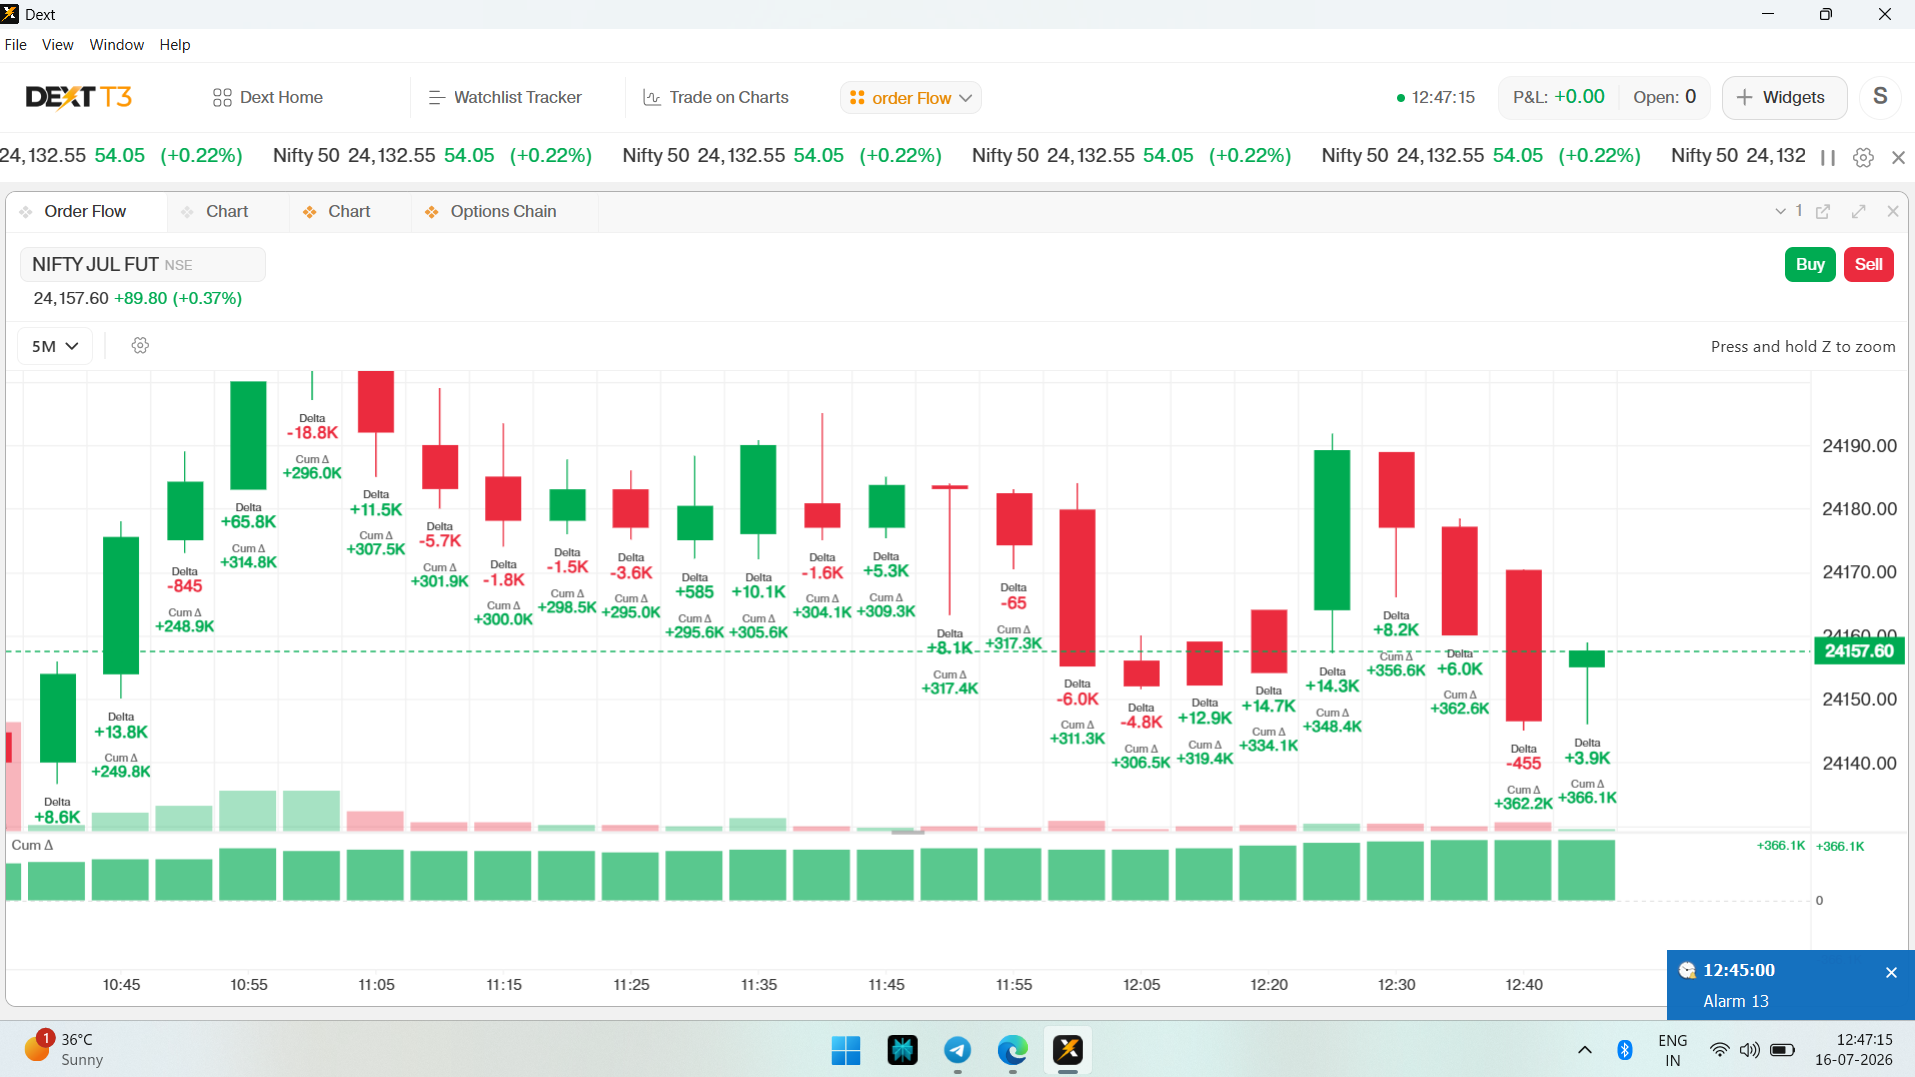
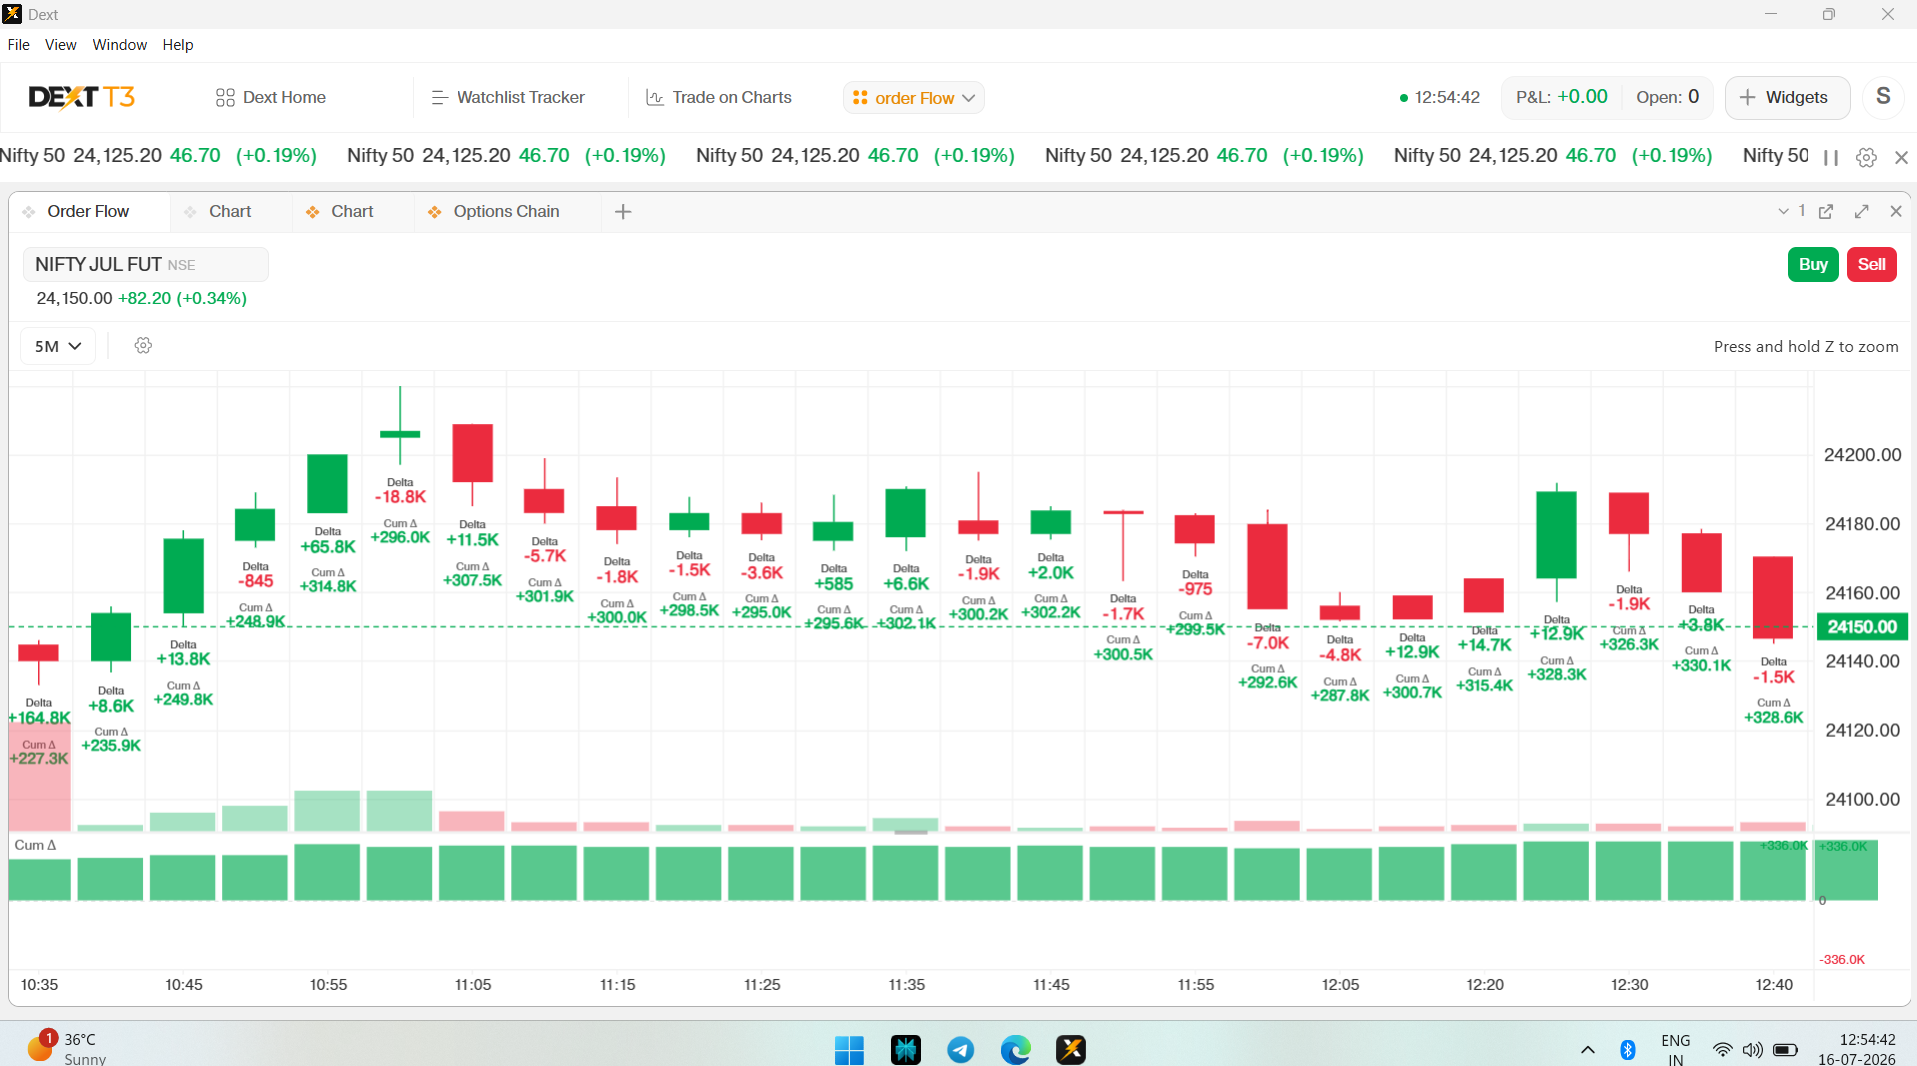
Recently, I start using your order flow chart on Dext#3 and observed some issue. Once I change script/Time frame, Data( cumulative delta, candle delta changes significantly. I have attached two screenshots for your reference. please do let me know if I am missing out on anything. thank you..!!
I faced similar issue today, attaching sreenshot of same script same time frame, but different delta.
This was not a small difference, a huge difference of -99k and +100k. This could make huge difference in decision making when trading in live market.
look at the 11:05 candle in both the screenshots. @Bhavya_Jain
Few minutes ago, Cum. Delta was green. the bars at downside were also green after 11.55. All of a sudden all went RED.
I think we should need to wait to use it until it fixed by team.
(Unfortunately, I don’t have previous screen shot .)
Today Again, I have experienced a big data change in Order flow chart. The 2:30pm candle on nifty Aug fut 15 min. had a negative Delta in live market, but after closing of market, It changed to green. I have stopped Dhan’s Order flow chart today Because somehow, I have made a decision to my PE positions due to negative delta on green candle. Although, I managed to exit C2C but any day the disaster can be happen.
@Kothal While we’re still working on resolving the Delta behaviour during refresh and while a candle is forming, we’ve made some optimisations for stocks. Could you please have a look and let us know how it works for you now?