Dear Dhan: I tried almost 40 ways of calculating RSI but none are matching with Dhan’s RSI. Due to this my algo trade code is unable to hit the order in the right time. Almost variances of RSI calculated through Python code vs Dhan RSI ranging from 0.5 to 4 points, which is way too beyond. Precisely when rate of change of candles pricing is very sporadic for each 5 minute interval, then variances are going for toss. Can you please help in getting the logic how RSI is calculated by Dhan? Appreciate your help.
Hey @Suresh_Pillitla
We have the standard way of calculating RSI, which matches trading view and other platforms as well.
Can you help us with some details on which libraries that you are using to compute this at your end.
Hey Hardik,
I have used talib which are derived through “TA_Lib‑0.4.0‑cp311‑cp311‑win_amd64.whl”. And also I tried various methods which are calculated manually as well rather talib derived methods, but none matched with Dhan RSI.
May I request you to direct me which library I should use in order to match correctly with Dhan RSI values that gets displayed on Dhan terminal graph? Appreciate your quicker response on this Hardhik.
I used ta lib but in python version 3.13 the values of not matched exactly with tradingview but near like i got for example M&M fin daily RSI 60.77 but trading view is 60.46 , we dont get exact match with tradingview as, Small differences may appear if TradingView uses Wilder’s smoothing vs. EMA/SMA, but usually negligible. So use TA-LIB
try using rsi with difference types such as pandas ta, talib and other available . u will get easily. when i used to crosscheck all these rsi was the most easiest u could match , rather other indicators are little bit tricky like supertrend and other volume indicator etc.
Rem,
Thanks for your response. However when I use talib with RSI windows period as 46 on 5 min interval candles, and precisely when RSI momentum is very uneven based on candles pattern, I see a variance of about 2-4 points. But when the momentum of market is study and rsi is also study in terms of its pattern then as you mentioned I barely see a variance which is less than 0.5. I need to sort out the issue when the momentum of market is very uneven as during those junctures my orders are getting delayed to hit.
Calculate RSI only on closed candles
→ This avoids mid-candle RSI flickering. Use completed 5-min bars, not real-time updating bars.
(Yes, this means signals come slightly later, but they’re reliable.)
could compute RSI on both 14 and 46, and only trade when both agree
need to check whether orders are triggered on signal generation or after signal confirmation
Instead of executing right at RSI = 70/30, add a ±2 tolerance band. E.g., act only if RSI > 72 or < 28. This reduces false triggers due to intrabar noise
Hardik,
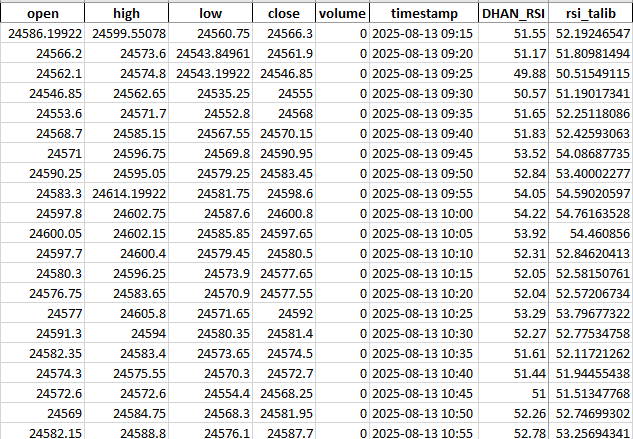
Please look at the variances (DHAN_RSI VS rsi_talib) of these 2 columns. I used 46 as window period for RSI with enough records to support 46 period window. But even then variance wise it is huge on closed candles. I really need you to chime-in by directing me the method to calculate RSI in order to match DHAN_RSI. Appreciate your help in advance Hardik.. This is NIFTY index.
Hello Kanhaji,
Appreciate your response on this. Being said this, when the market is very volatile and candles pattern are very sporadic in nature (like gap up/down, very aggressively making swings, etc), during such instances I see a variance of 2-4 points in RSI (window period 46, 5 minute interval). Such instances are causing my program to either to not enter/exit timely. Please note that I am checking ONLY on CLOSED candles. Atleast CLOSED candles value must match with DHAN RSI.
Hardik,
Can you please give me snippet to calculate RSI so that it matches DHAN RSI. As you mentioned “We have the standard way of calculating RSI, which matches trading view and other platforms as well” so is my ask. Appreciate your quicker response on this as I am stuck with this variance issue.
chart[‘rsi’] = talib.RSI(chart[‘close’], timeperiod =14). if not matching their must be version issue for sure for your talib version must be incompatibe with the python version
I use the same talib method to calculate RSI but not matching in the conditions when Candles are very sporadic in nature or during closed candles gap up and gap down instances. I am using Python 3.11.9 with talib library downloaded through TA_Lib‑0.4.0‑cp311‑cp311‑win_amd64.whl. If I am using in-correct versions please do suggest what to use. Appreciate your help Kanhaji.
if u still have query talk to dhan team
Please find below code to get RSI values similar to tradingview.
import pandas as pd

# Read data downloaded from tradingview
df = pd.read_csv('rsi_calculation_NACL.csv')

# change date in yyyy-mm-dd format
df['time'] = pd.to_datetime(df['time'],unit='s').dt.date
df['t'] = 'NACLIND'
df['open'] = round(df['open'], 2)
df['high'] = round(df['high'], 2)
df['low'] = round(df['low'], 2)
df['close'] = round(df['close'], 2)
df['Volume'] = round(df['Volume'], 0)
df = df.rename(columns={'time': 'd', 'open': 'o', 'high': 'h', 'low': 'l', 'close': 'c', 'Volume': 'v', })
df = df[['d', 't', 'o', 'h', 'l', 'c', 'v', ]]

# RSI Calculation
df['change'] = df.groupby('t')['c'].diff()
df['gain'] = df.change.mask(df.change < 0, 0.0)
df['loss'] = -df.change.mask(df.change > 0, -0.0)
df['avg_gain'] = df.groupby('t')['gain'].transform(lambda s: s.ewm(alpha=1/14, adjust=False, ignore_na=False,  min_periods=14).mean())
df['avg_loss'] = df.groupby('t')['loss'].transform(lambda s: s.ewm(alpha=1/14, adjust=False, ignore_na=False,  min_periods=14).mean())
df['r_s'] = df['avg_gain'] / df['avg_loss']
df['rsi'] = round(100 - (100 / (1 + df['r_s'])), 2)

# deleting columns created for calculation of RSI
df = df.drop(columns=['change', 'gain', 'loss', 'avg_gain', 'avg_loss', 'r_s', ])

# Display last 10 records
df.tail(10)
Just need to make sure your data is similar to tradingview OHLC values. You dont need any other library to calculate RSI values other than Pandas.
The beauty of this code is, even if you have different symbols in your code, you can calculate RSI without a loop. Hope this helps.
Appreciate your code and I am impressed the way the code is written and have not seen till now such method to calculate RSI, not even from any of the recommendations from chatgpt or other competitors. However values are still not matching.
I am using RSI Period as 46 on 5 minute interval with security as NIFTY INDEX. I am pasting the data of 13-Aug-2025 with ohlc data with a lookback data of more than 46 record so that we have enough data to calculate RSI for 13-Aug-2025. Please go through this data and help me out why the calculation of your code is not matching DHAN RSI values listed under DHAN_RSI column.
| open | high | low | close | volume | timestamp | DHAN_RSI |
|---|---|---|---|---|---|---|
| 24650.6 | 24666 | 24650.25 | 24657.75 | 0 | 2025-08-12 10:20 | |
| 24658.35 | 24662.15 | 24611.5 | 24613.65 | 0 | 2025-08-12 10:25 | |
| 24612.7 | 24612.7 | 24562.25 | 24581.75 | 0 | 2025-08-12 10:30 | |
| 24582.05 | 24609 | 24580.25 | 24595.6 | 0 | 2025-08-12 10:35 | |
| 24595.45 | 24611.35 | 24582.05 | 24583.85 | 0 | 2025-08-12 10:40 | |
| 24583.3 | 24596.15 | 24570.4 | 24582.35 | 0 | 2025-08-12 10:45 | |
| 24582.15 | 24590.8 | 24578.15 | 24582.4 | 0 | 2025-08-12 10:50 | |
| 24581.95 | 24604.45 | 24579.3 | 24580.75 | 0 | 2025-08-12 10:55 | |
| 24579.7 | 24581.75 | 24551.9 | 24556.65 | 0 | 2025-08-12 11:00 | |
| 24555.8 | 24561.8 | 24532.7 | 24540.25 | 0 | 2025-08-12 11:05 | |
| 24540.15 | 24549.4 | 24538.5 | 24544.15 | 0 | 2025-08-12 11:10 | |
| 24544.05 | 24593.25 | 24541.75 | 24580.2 | 0 | 2025-08-12 11:15 | |
| 24580.05 | 24584.15 | 24570.9 | 24573.55 | 0 | 2025-08-12 11:20 | |
| 24573.2 | 24575.2 | 24551.05 | 24556.7 | 0 | 2025-08-12 11:25 | |
| 24556.3 | 24571.9 | 24555.55 | 24559.3 | 0 | 2025-08-12 11:30 | |
| 24558.8 | 24568.75 | 24557.1 | 24561 | 0 | 2025-08-12 11:35 | |
| 24561.15 | 24567.55 | 24554.4 | 24561.75 | 0 | 2025-08-12 11:40 | |
| 24561.35 | 24562.45 | 24543.55 | 24545.95 | 0 | 2025-08-12 11:45 | |
| 24545.7 | 24550.7 | 24531.45 | 24548.9 | 0 | 2025-08-12 11:50 | |
| 24548.8 | 24566.55 | 24548.1 | 24565.75 | 0 | 2025-08-12 11:55 | |
| 24565.85 | 24569.75 | 24553.5 | 24554.1 | 0 | 2025-08-12 12:00 | |
| 24554.25 | 24567.85 | 24552.7 | 24565.15 | 0 | 2025-08-12 12:05 | |
| 24565.5 | 24566.75 | 24553.5 | 24561.75 | 0 | 2025-08-12 12:10 | |
| 24561.75 | 24599.35 | 24559.1 | 24599.35 | 0 | 2025-08-12 12:15 | |
| 24599.65 | 24618.9 | 24589.65 | 24617.8 | 0 | 2025-08-12 12:20 | |
| 24617.55 | 24623.6 | 24594.75 | 24604.5 | 0 | 2025-08-12 12:25 | |
| 24604.4 | 24625.95 | 24604.4 | 24614.7 | 0 | 2025-08-12 12:30 | |
| 24614.1 | 24638.85 | 24612.85 | 24637.4 | 0 | 2025-08-12 12:35 | |
| 24637 | 24640.35 | 24627.35 | 24631.7 | 0 | 2025-08-12 12:40 | |
| 24633.7 | 24633.7 | 24607.45 | 24611.85 | 0 | 2025-08-12 12:45 | |
| 24610.85 | 24616.45 | 24597.75 | 24598.65 | 0 | 2025-08-12 12:50 | |
| 24598.9 | 24603.3 | 24590 | 24595.05 | 0 | 2025-08-12 12:55 | |
| 24595.35 | 24619.7 | 24592.2 | 24614.1 | 0 | 2025-08-12 13:00 | |
| 24613.65 | 24615.35 | 24600.15 | 24607.1 | 0 | 2025-08-12 13:05 | |
| 24607.3 | 24610.95 | 24596.65 | 24597.2 | 0 | 2025-08-12 13:10 | |
| 24597.25 | 24597.25 | 24572.45 | 24576.75 | 0 | 2025-08-12 13:15 | |
| 24577.6 | 24585.6 | 24572.55 | 24579.5 | 0 | 2025-08-12 13:20 | |
| 24579.8 | 24581.95 | 24549.5 | 24574.75 | 0 | 2025-08-12 13:25 | |
| 24574.8 | 24579.15 | 24563.65 | 24565.7 | 0 | 2025-08-12 13:30 | |
| 24565.65 | 24574.4 | 24563 | 24572.55 | 0 | 2025-08-12 13:35 | |
| 24571.9 | 24572.25 | 24558.4 | 24564.9 | 0 | 2025-08-12 13:40 | |
| 24564.7 | 24577.7 | 24561.7 | 24565.7 | 0 | 2025-08-12 13:45 | |
| 24566.15 | 24577.15 | 24563.9 | 24575.45 | 0 | 2025-08-12 13:50 | |
| 24575.65 | 24607.6 | 24569.3 | 24603.55 | 0 | 2025-08-12 13:55 | |
| 24603.7 | 24606.15 | 24561.1 | 24561.5 | 0 | 2025-08-12 14:00 | |
| 24561.75 | 24564.05 | 24552.25 | 24552.25 | 0 | 2025-08-12 14:05 | |
| 24552.9 | 24552.9 | 24534.85 | 24542.65 | 0 | 2025-08-12 14:10 | |
| 24544.05 | 24548.25 | 24522.30078 | 24533.15 | 0 | 2025-08-12 14:15 | |
| 24533.05 | 24550.1 | 24526.4 | 24539 | 0 | 2025-08-12 14:20 | |
| 24539.05 | 24562.3 | 24537.85 | 24544.9 | 0 | 2025-08-12 14:25 | |
| 24544.8 | 24544.8 | 24518 | 24519.3 | 0 | 2025-08-12 14:30 | |
| 24519.15 | 24533.85 | 24516.40039 | 24531.05 | 0 | 2025-08-12 14:35 | |
| 24531.15 | 24531.15 | 24500.55078 | 24507.45 | 0 | 2025-08-12 14:40 | |
| 24507.25 | 24511.8 | 24493.15039 | 24495.3 | 0 | 2025-08-12 14:45 | |
| 24495.2 | 24503.2 | 24481.5 | 24492.5 | 0 | 2025-08-12 14:50 | |
| 24492.7 | 24524.65 | 24489.1 | 24499.75 | 0 | 2025-08-12 14:55 | |
| 24501.1 | 24503.8 | 24465.65039 | 24470.75 | 0 | 2025-08-12 15:00 | |
| 24472.75 | 24491.55 | 24471.5 | 24487.9 | 0 | 2025-08-12 15:05 | |
| 24490.2 | 24499.05 | 24484.6 | 24490.25 | 0 | 2025-08-12 15:10 | |
| 24490.85 | 24501.2 | 24485.25 | 24490.1 | 0 | 2025-08-12 15:15 | |
| 24490.75 | 24496.35 | 24484.8 | 24493.8 | 0 | 2025-08-12 15:20 | |
| 24493.4 | 24494.75 | 24477.75 | 24485.85 | 0 | 2025-08-12 15:25 | |
| 24485.85 | 24485.85 | 24485.85 | 24485.85 | 0 | 2025-08-12 15:30 | |
| 24586.19922 | 24599.55078 | 24560.75 | 24566.3 | 0 | 2025-08-13 09:15 | 51.55 |
| 24566.2 | 24573.6 | 24543.84961 | 24561.9 | 0 | 2025-08-13 09:20 | 51.17 |
| 24562.1 | 24574.8 | 24543.19922 | 24546.85 | 0 | 2025-08-13 09:25 | 49.88 |
| 24546.85 | 24562.65 | 24535.25 | 24555 | 0 | 2025-08-13 09:30 | 50.57 |
| 24553.6 | 24571.7 | 24552.8 | 24568 | 0 | 2025-08-13 09:35 | 51.65 |
| 24568.7 | 24585.15 | 24567.55 | 24570.15 | 0 | 2025-08-13 09:40 | 51.83 |
| 24571 | 24596.75 | 24569.8 | 24590.95 | 0 | 2025-08-13 09:45 | 53.52 |
| 24590.25 | 24595.05 | 24579.25 | 24583.45 | 0 | 2025-08-13 09:50 | 52.84 |
| 24583.3 | 24614.19922 | 24581.75 | 24598.6 | 0 | 2025-08-13 09:55 | 54.05 |
| 24597.8 | 24602.75 | 24587.6 | 24600.8 | 0 | 2025-08-13 10:00 | 54.22 |
| 24600.05 | 24602.15 | 24585.85 | 24597.65 | 0 | 2025-08-13 10:05 | 53.92 |
| 24597.7 | 24600.4 | 24579.45 | 24580.5 | 0 | 2025-08-13 10:10 | 52.31 |
| 24580.3 | 24596.25 | 24573.9 | 24577.65 | 0 | 2025-08-13 10:15 | 52.05 |
| 24576.75 | 24583.65 | 24570.9 | 24577.55 | 0 | 2025-08-13 10:20 | 52.04 |
| 24577 | 24605.8 | 24571.65 | 24592 | 0 | 2025-08-13 10:25 | 53.29 |
| 24591.3 | 24594 | 24580.35 | 24581.4 | 0 | 2025-08-13 10:30 | 52.27 |
| 24582.35 | 24583.4 | 24573.65 | 24574.5 | 0 | 2025-08-13 10:35 | 51.61 |
Ekveer,
Can you please check my data given here and let me know how to calculate RSI to match with the column DHAN_RSI. DHAN_RSI values were taken on Dhan Trading Terminal chart by replaying the market of Dated: 13-Aug-2025.
Hi, I tried executing my code (made some changes to change period you are using) with your data. Surprisingly, my results were not matching with Dhan RSI indicator or Tradingview RSI Indicator for the period you are using.
I tried validating whether values of my origianl code (by using rsi period as 14) to matches with values of Dhan RSI. Unfortunately they didnt match.
So, how Dhan is calculating RSI needs to be explanined by Dhan team.
I tried various permutations and combinations but they did not match.
Unfortunately, I cant be of much help here.