Hi. I’d like to suggest 2 features for Journal which would help make tracking performance easier.
(1) Equity Curve or Account Performance Graph
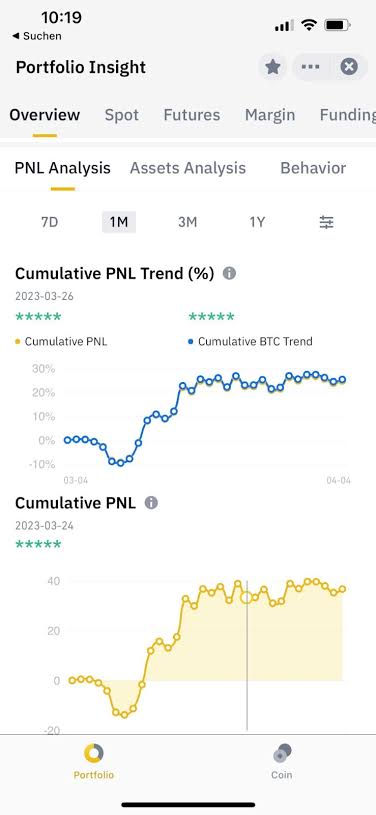
(2) Cumulative P&L Graph vs Time.
Both of these options, I currently do manually and it takes up time. I’d appreciate if Dhan could do this since all the P&L data gets updated on Trader’s Diary anyways. Thanks!
@PravinJ
4 Likes
Hi @thisisbanerjee
Thank you for your feedback.
Regarding the points you shared:
- Work is currently in progress.
- Would appreciate it if you could share more insights to help us evaluate and address this better.
1 Like
Hi @MahimaShah Hope you’re doing good. Regarding the Cumulative P&L Graph - Cumulative P&L graph shows the graphical representation of incremental P&L + Historical P&L.
For example - Let’s say I have started the 2025 with ₹0 profits or losses. On 2nd Jan, I made ₹7000 as profit, then on 3rd Jan I made ₹1500 as profits, so the cumulative P&L graph would show something like this:
1/1/25 - ₹0
2/1/25 - ₹7000
3/1/25 - ₹8500
… And so forth. An example graph 
3 Likes
Hi @thisisbanerjee
Thank you for sharing the details; we will surely evaluate and work on it.