Basically I would like to find an average movement range of any stock over the span of, let’s say, 6 months. Right now I am taking two months because I go over manual calculations of using this tool and then calculating average of those % movements. Is there anything I can to make process fast?

Hi @YashM Good to see you after a long time, welcome back!
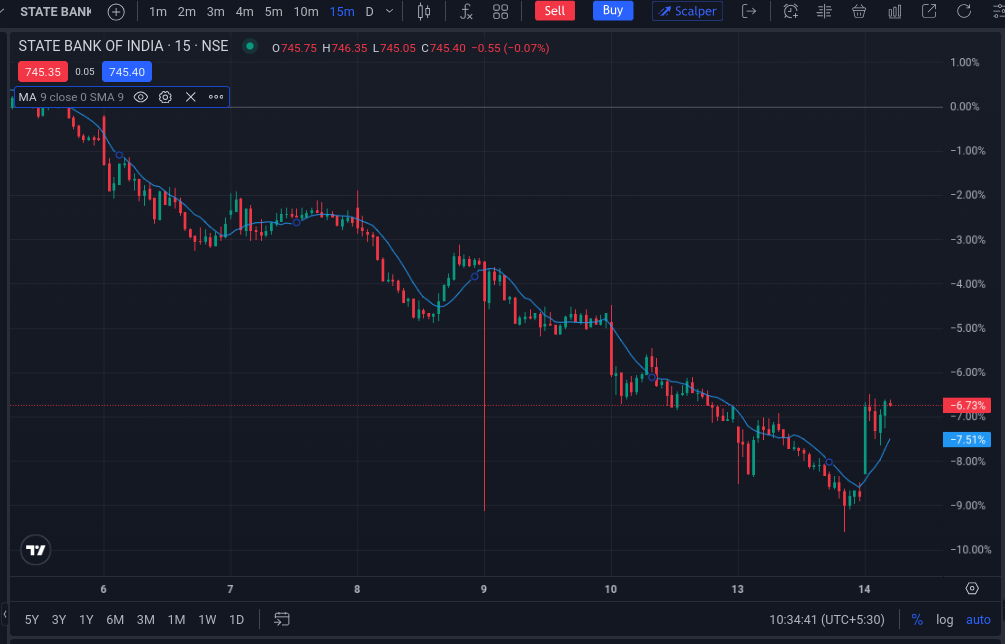
The fastest way would be to use a Simple moving average indicator and set chart percentage toggle which can be found in the bottom left of the charts next to the time zone. refer screenshot below.