Hi @Everyone ,
A five-step, beginner-friendly guide to the method hedge funds follow, and how a retail algo trader can apply it with backtesting, paper trading and the Dhan API.
Introduction
Hedge funds guard their trading strategies closely. The exact rules, parameters and signals behind a fund’s profits are trade secrets.
Their method, however, is not a secret. The process hedge funds follow to build a strategy is well documented in public sources, and you can learn and copy it. If you follow the same method, you can use it to make your own strategies stronger.
In this guide, we walk through that method step by step. There are five steps in total:
- Find an edge
- Combine many small edges
- Keep only the edges that are different
- Take many trades, or give it a long time (the law of large numbers)
- Paper trade first, counting brokerage and slippage
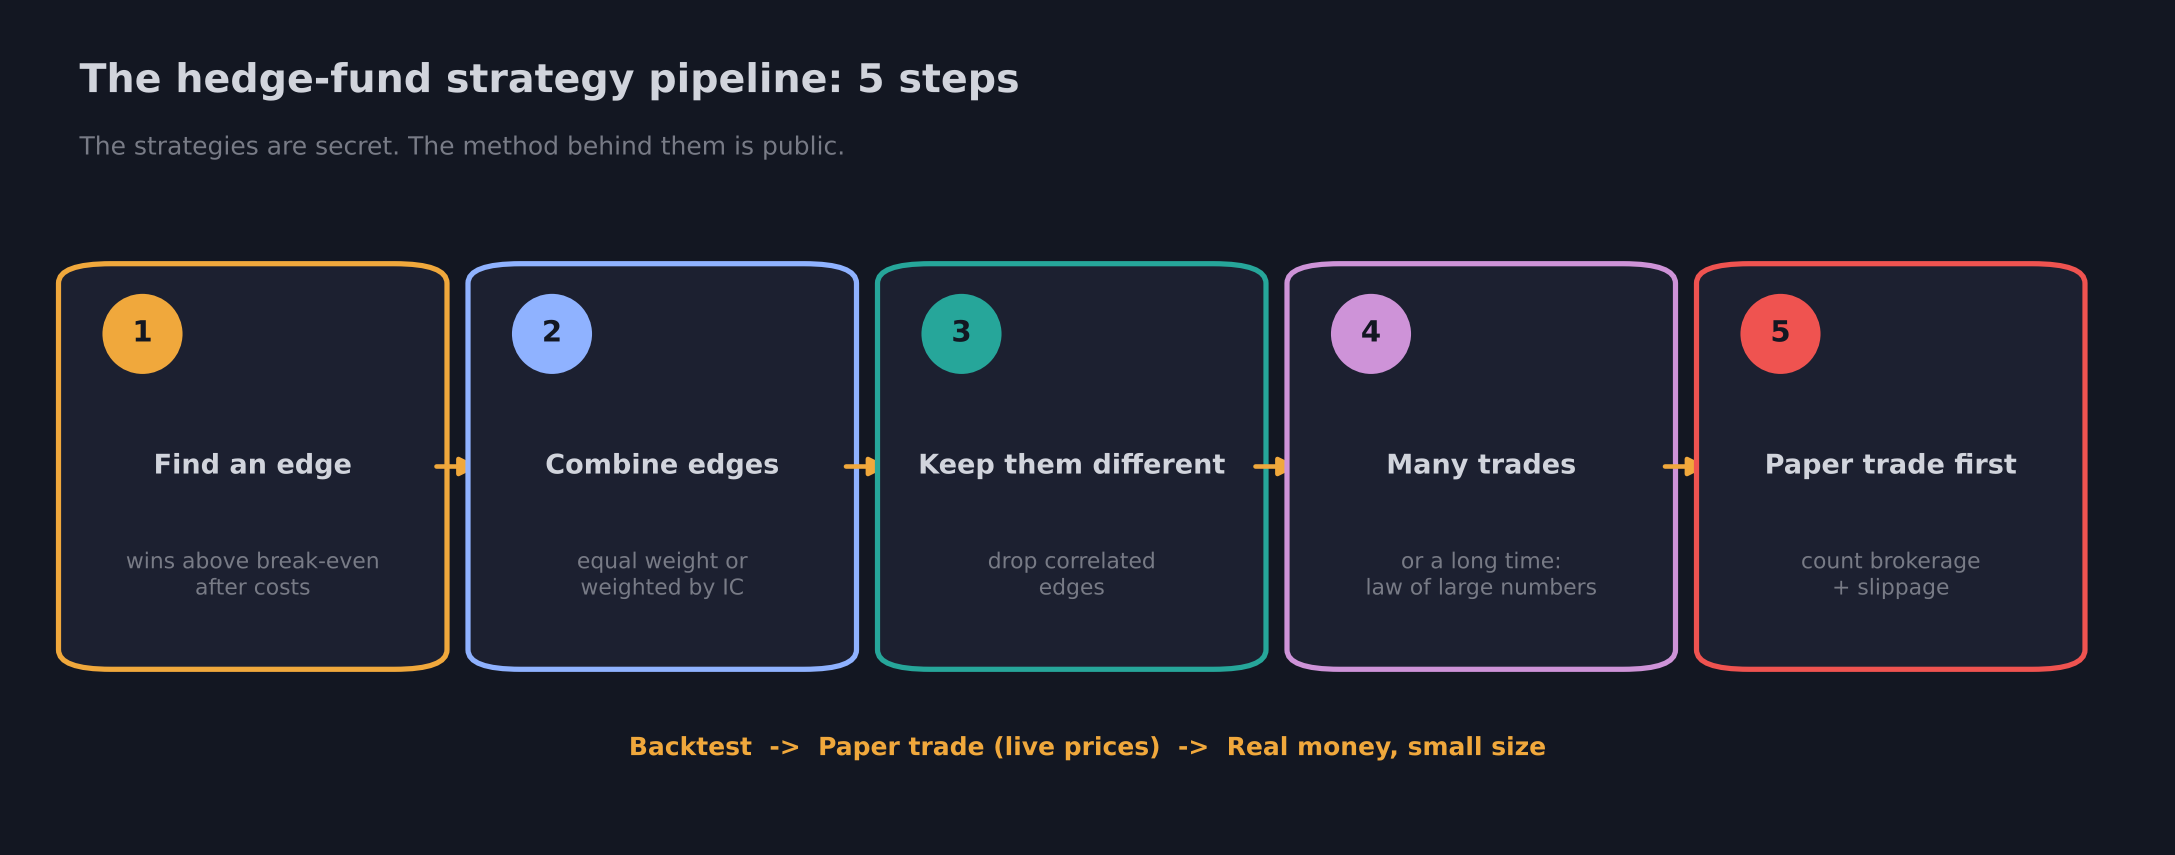
Figure 1: The five steps hedge funds follow, from finding an edge to paper trading before going live.
Note: The strategies are secret. The method behind them is public. This article teaches the method, not any specific fund’s strategy.
Step 1: Find an Edge
What needs to be done
The first thing any hedge fund does is find an edge. You will also hear it called an alpha. Both words mean the same thing.
What is an edge?
An edge is a piece of logic that helps you win more than you lose, and still leaves something above zero after brokerage and slippage.
In other words:
An edge is anything that wins more than break-even, after all costs.
How it works: a coin-flip example
Imagine a trade where you win Rs 1 or lose Rs 1 (a 1:1 risk-to-reward), like flipping a fair coin.
- Take 100 trades. 50 win and 50 lose. You break even. There is no edge.
- Now suppose 51 trades win and 49 lose. That one extra win is your edge of about 1%.
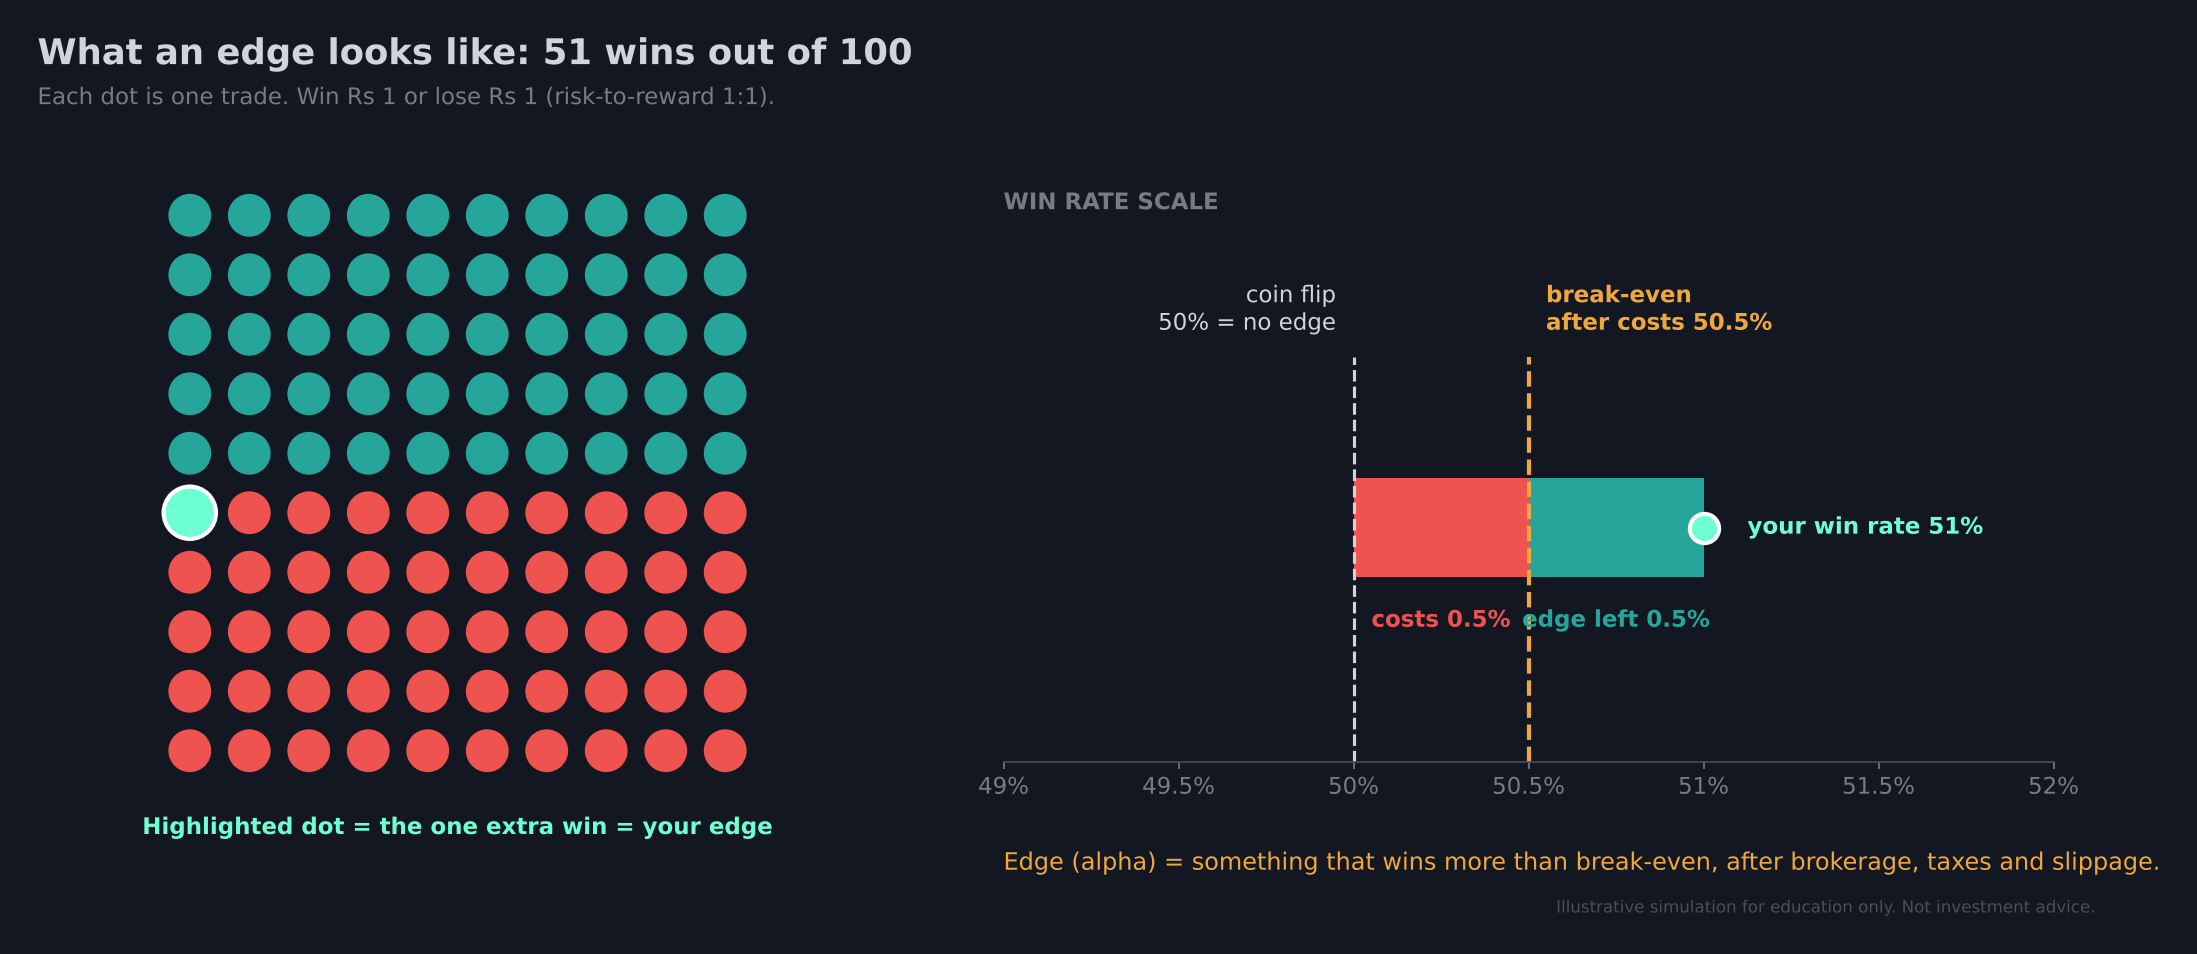
Figure 2: Out of 100 trades, one extra win moves you from a coin flip (50%) to a small edge. Costs move the break-even point from 50% to 50.5%.
A practical example: Supertrend
Suppose you trade using the Supertrend indicator with a 1:1 risk-to-reward:
| Measure | Value |
|---|---|
| Win rate | 60% |
| Loss rate | 40% |
| Risk-to-reward | 1:1 |
| Break-even win rate at 1:1 | 50% |
| Edge | 60% - 50% = 10% above break-even |
This 10% above break-even is your edge, or alpha.
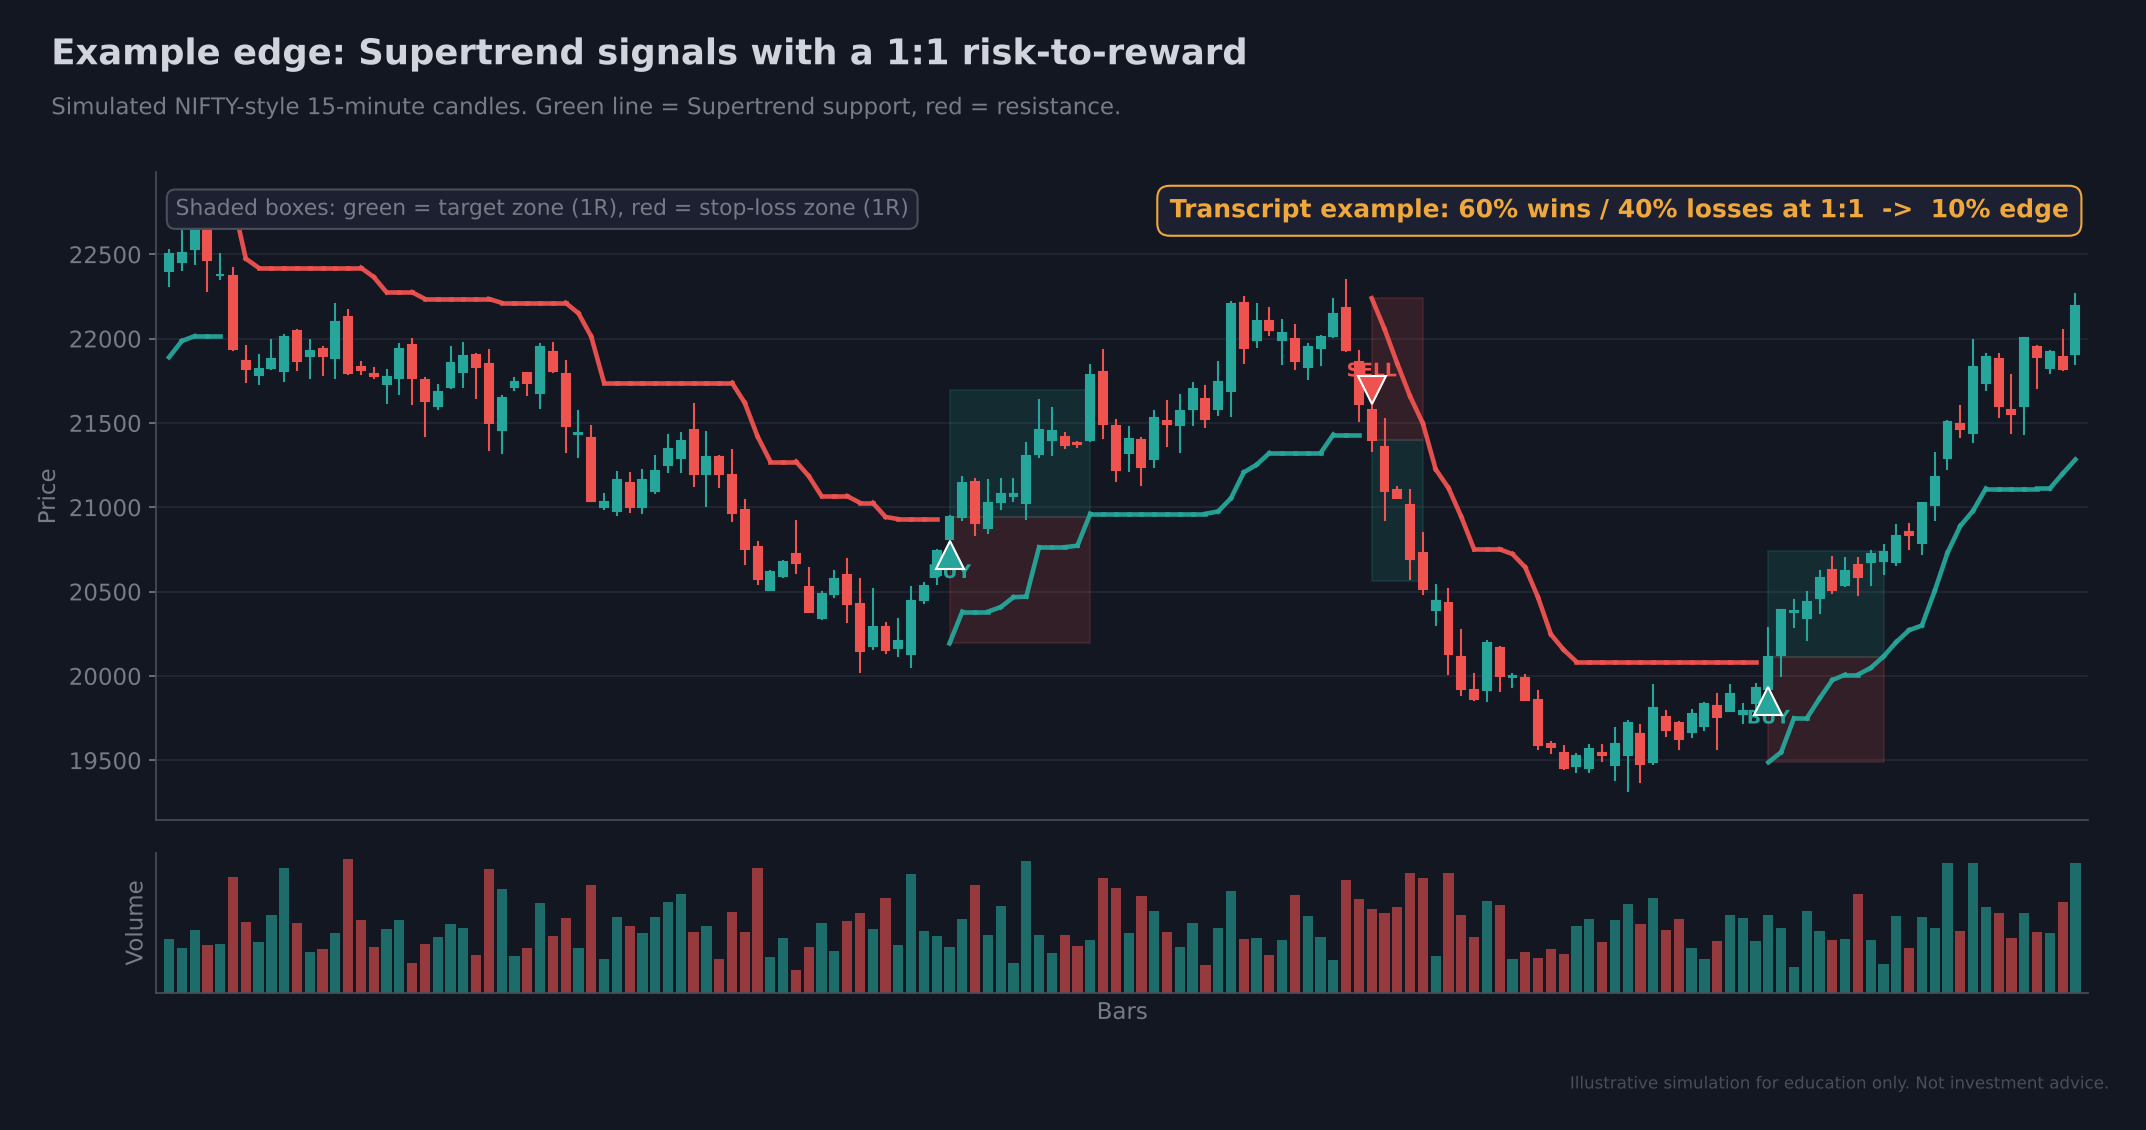
Figure 3: An example edge on a candlestick chart. Supertrend flips create BUY and SELL signals; green boxes show the 1R target and red boxes the 1R stop-loss.
Why costs matter
Every edge must survive costs. Say your strategy has a 1% gross edge:
- Brokerage, taxes and slippage take 0.5%
- The edge left over is 0.5%
It is tiny, but it is still above zero, so it is still an edge.
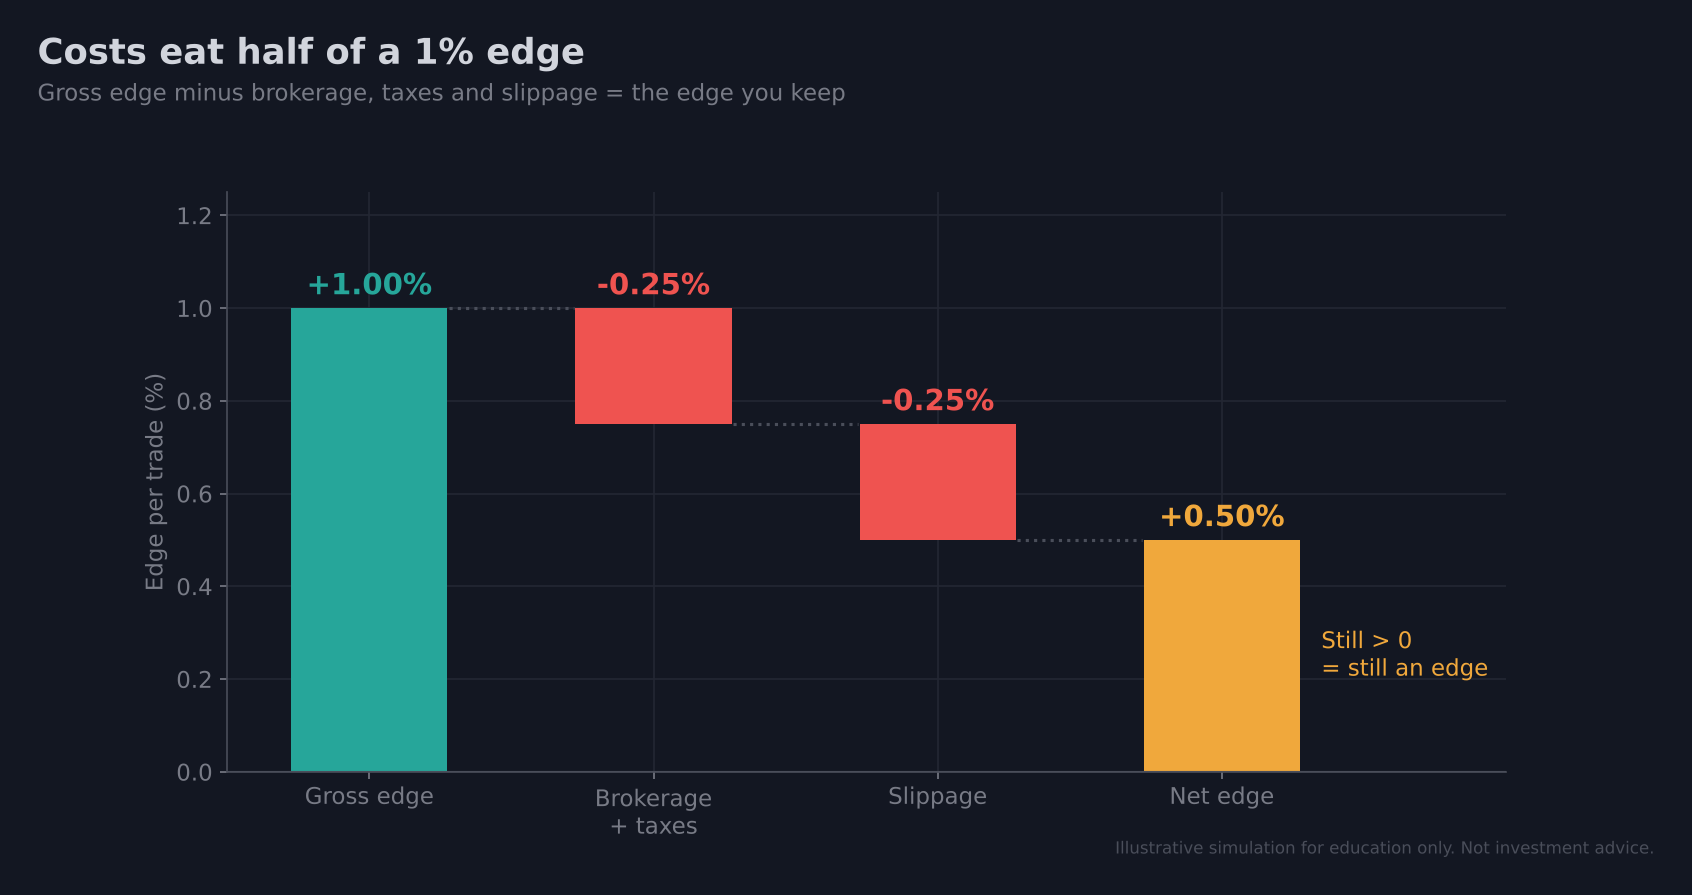
Figure 4: Costs can eat half of a small edge. What matters is the net edge after brokerage, taxes and slippage.
Expected result
You should come out of this step with one or more ideas that, in a backtest, win more than break-even after costs.
Important: Real edges are very small: 0.5%, 1%, 1.5% or 2%. The more you backtest, the more clearly you will see this for yourself. Every alpha is small. Almost everyone in the industry knows this.
“Can 0.5% really be enough?”
It is natural to ask: would you actually trade a 0.5% edge? It looks like nothing.
On its own, it is very difficult. But keep reading. Later in this guide you will meet a real market-making firm that held an edge of only about 1 to 2% and, over roughly 5 to 6 years of trading, had just one losing day. Hedge funds and institutions build their entire business model on these small edges. Some funds even specialise only in finding them.
Step 2: Combine Many Small Edges
Why this step exists
A single small edge can never beat the market on its own. What can you really do with 0.5%?
That is why institutions combine many small edges. Adding them together makes the overall signal more powerful.
What needs to be done
Collect several independent edges. Here are five common examples:
| Edge | The idea in one line |
|---|---|
| Momentum | Strong stocks tend to keep going (for example, RSI momentum is strong). |
| Mean reversion | Big falls tend to bounce back. |
| Volatility premium | Options are usually priced a little high, so sellers collect a premium. |
| Earnings drift | After good results, prices tend to keep drifting in the same direction. |
| Low volatility | Calm stocks tend to do better than their risk suggests. |
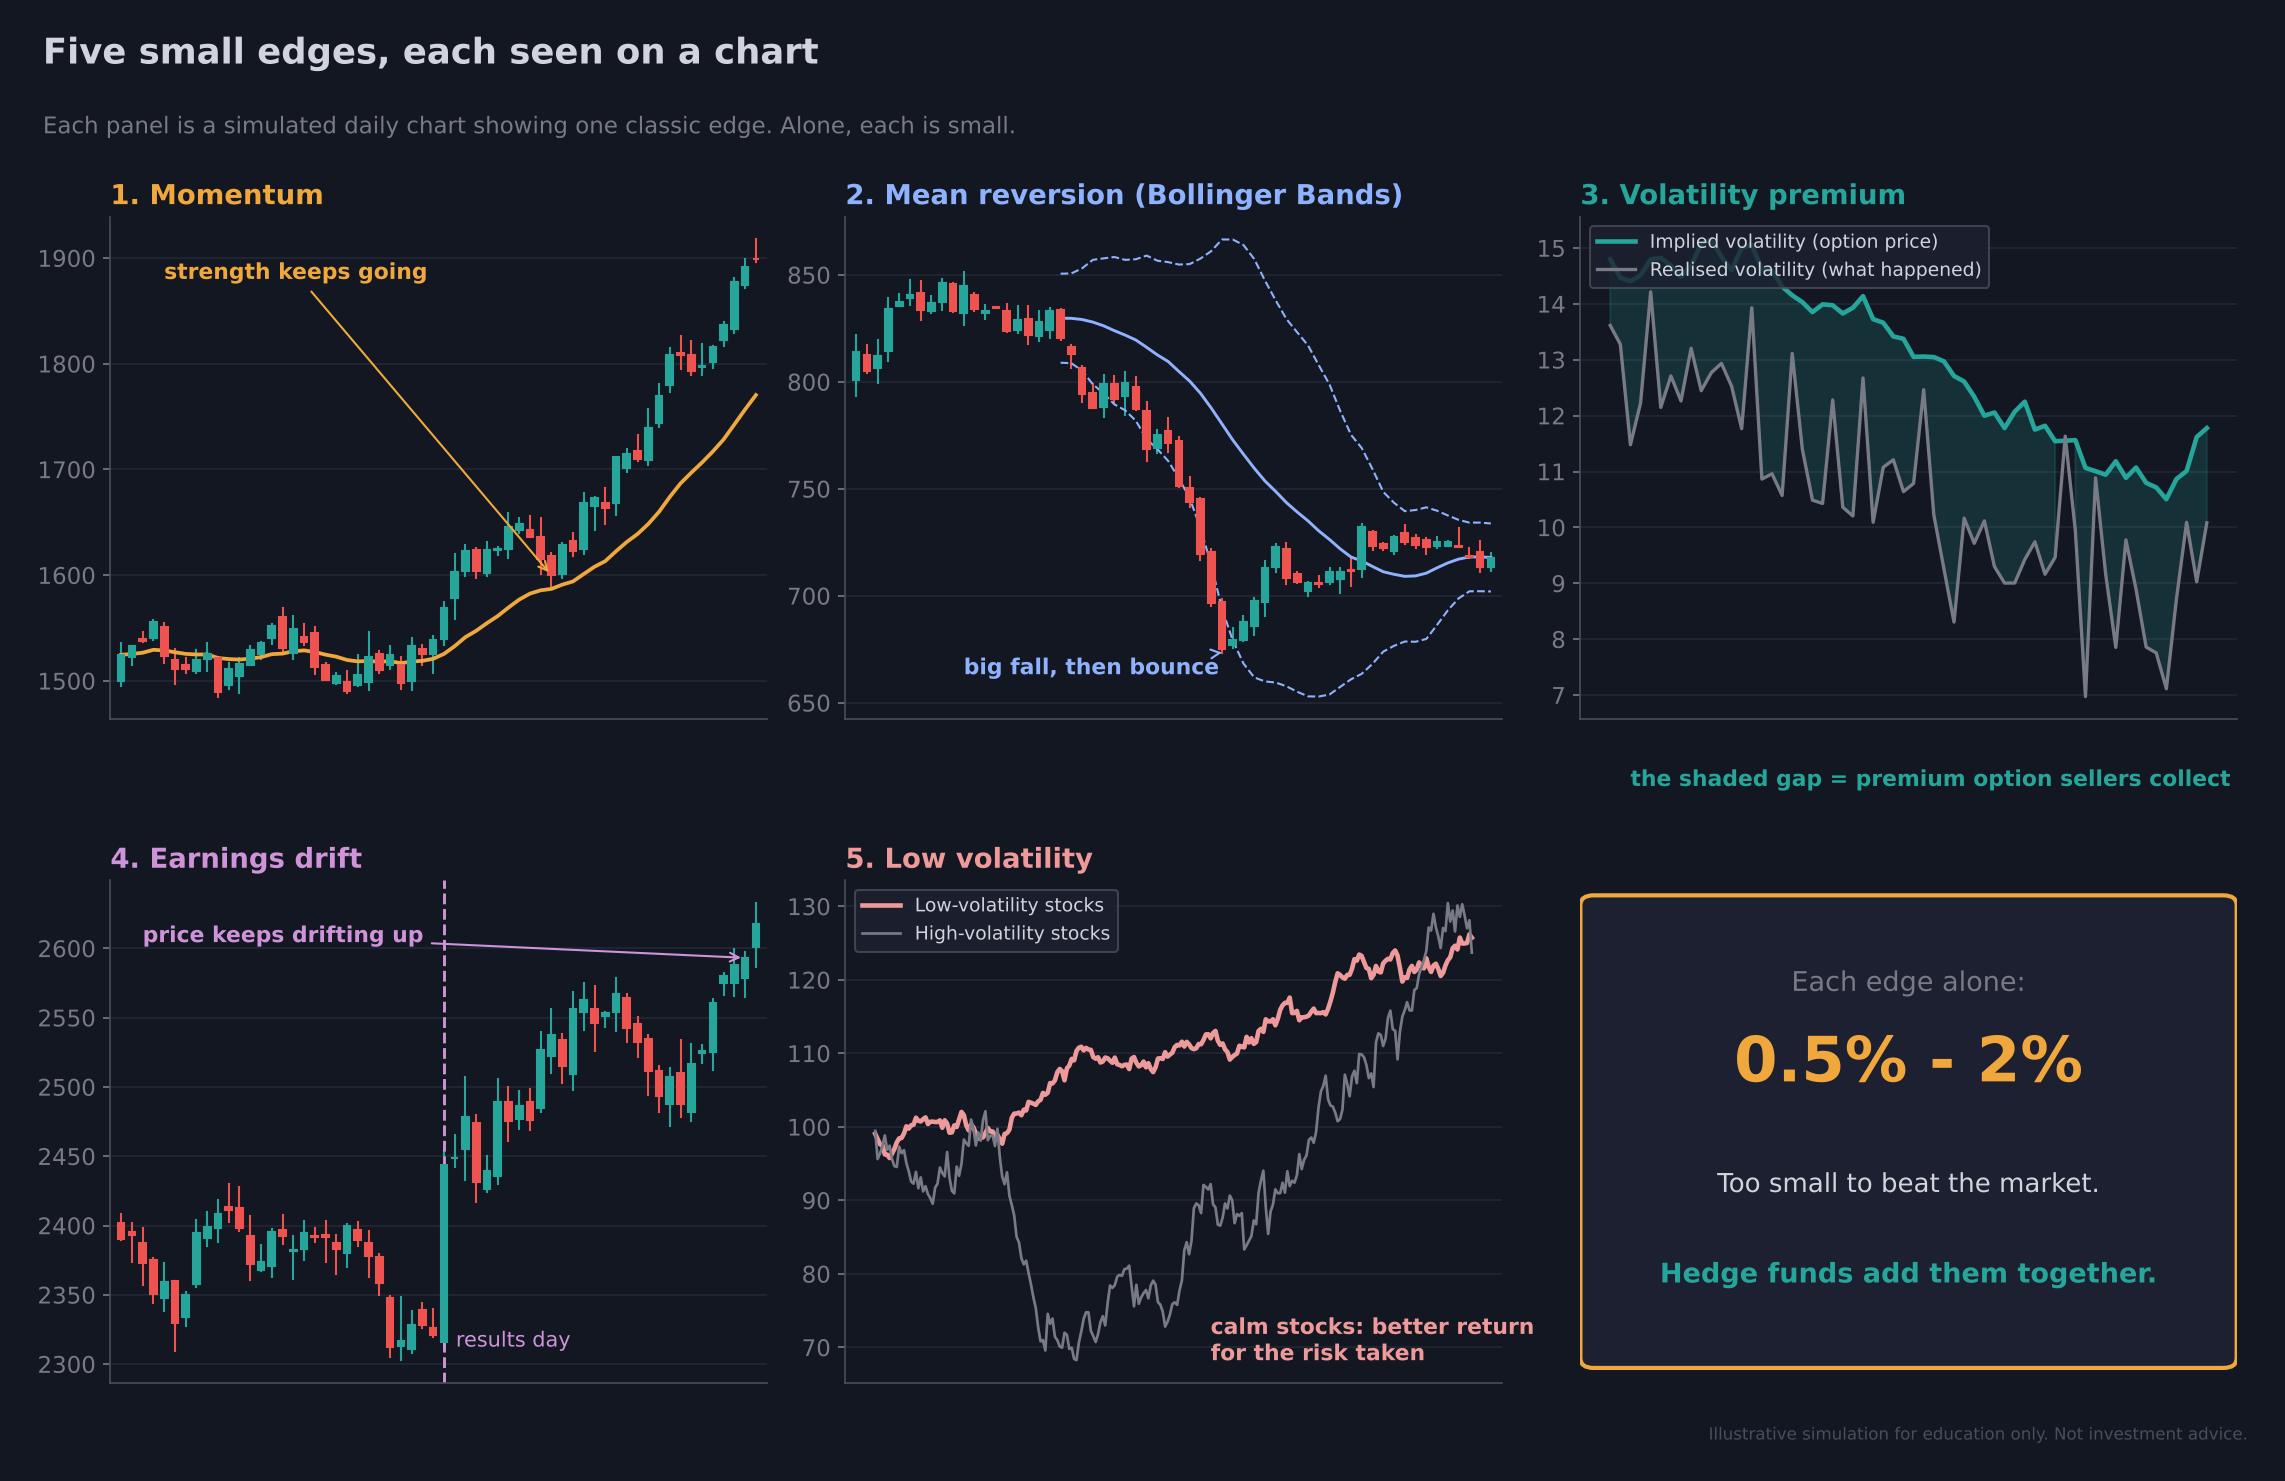
Figure 5: Five small edges, each shown on a chart. Momentum, mean reversion (Bollinger Bands), volatility premium, earnings drift and low volatility. Alone, each one is small.
How it works: two ways to combine
There are many ways to combine edges. The two most common are:
Method 1: Equal weight
With five edges, give each one 20% of the vote and add them up. It is simple and robust.
Method 2: Weight by Information Coefficient (IC)
The Information Coefficient measures how well a signal helped you catch the next move. Each edge has a different IC, so each gets a different weight.
Think of the five edges as board members of a company. With IC weighting:
- Volatility premium gets about 33% of the voting rights
- Momentum gets about 27%
- The others get less, based on their IC
Your entry is then defined by the combined vote.
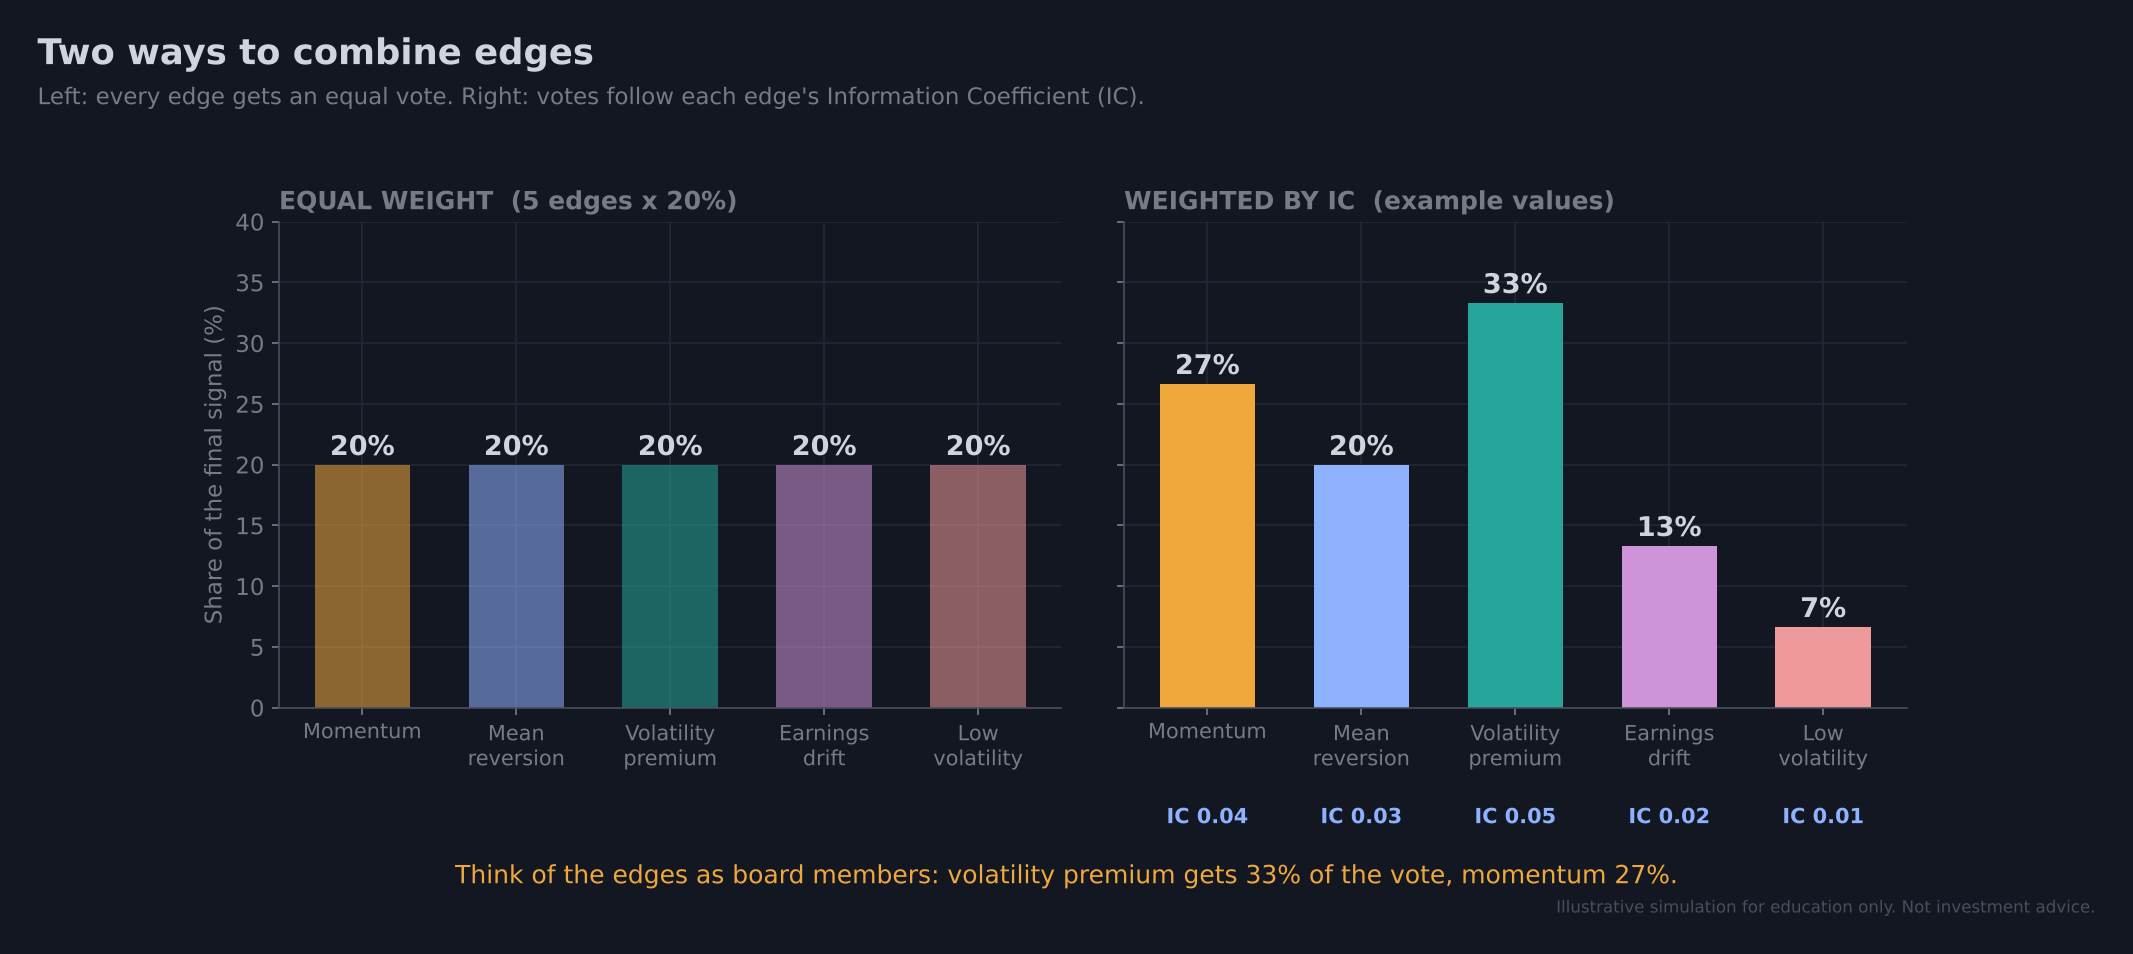
Figure 6: Left, every edge gets an equal 20% vote. Right, votes follow each edge’s IC (example values), so stronger edges get more weight.
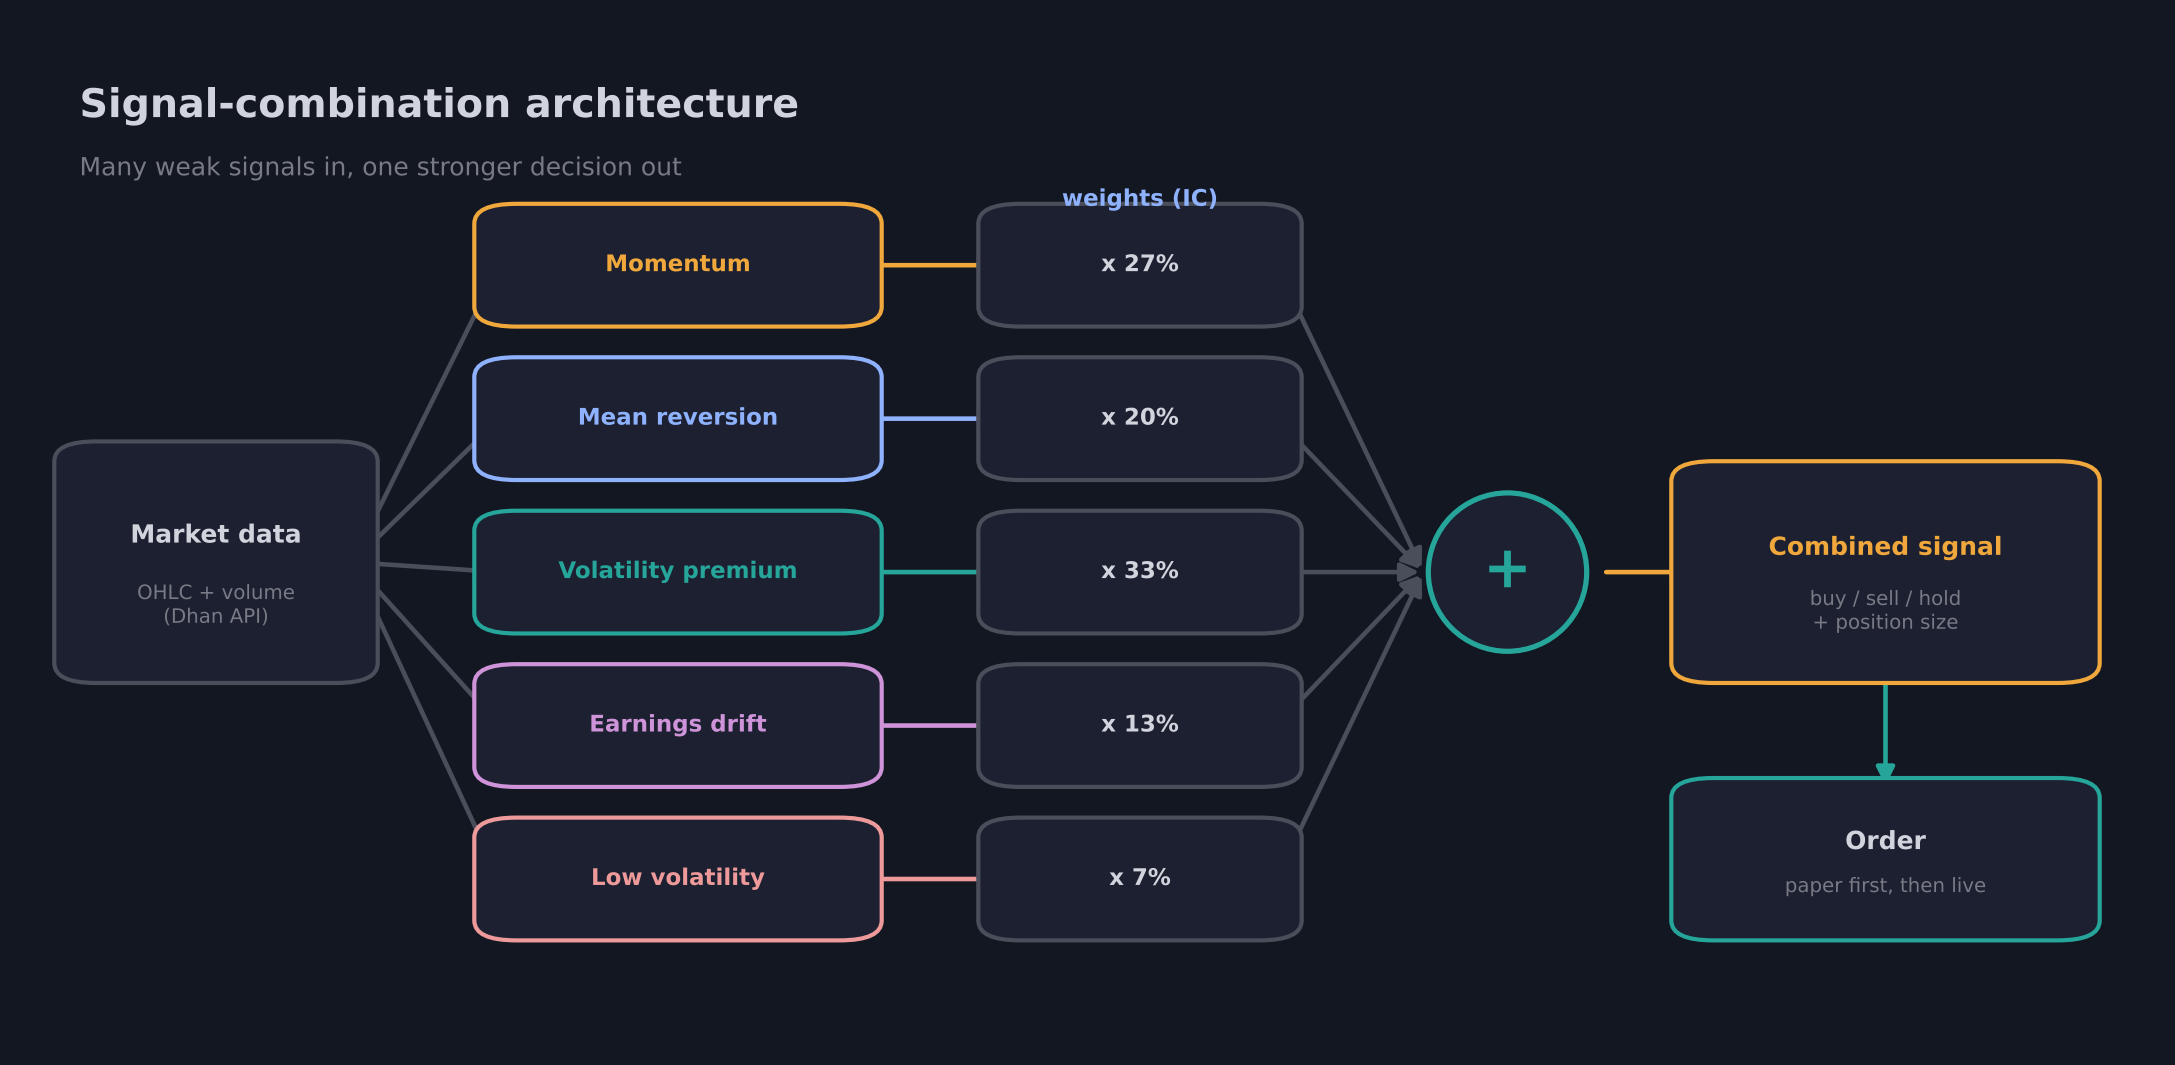
Figure 7: Signal-combination architecture. Market data feeds each edge, each edge is weighted, and the weighted signals are summed into one decision.
Expected result
You now have one combined signal that is stronger and more stable than any single edge.
Tip: If you are not sure how reliable your IC estimates are, start with equal weights. It is the simpler and safer choice.
Step 3: Keep Only the Edges That Are Different
Why this step exists
Combining edges only helps if they say different things. If two edges always agree, you are really placing the same bet twice.
What needs to be done
Check how alike your edges are by measuring the correlation between their returns:
- 1 means they move together
- 0 means there is no link
- Negative means they tend to move in opposite directions
Then keep the edges that are not strongly correlated.
How it works: momentum vs trend
Take two popular edges:
- Momentum: RSI is going up
- Trend: price is going up above the EMA
When RSI is bullish, the EMA trend is usually bullish too. And when price is above the EMA, RSI usually goes above 60. In the example data, these two agree about 62% of the time (a correlation of 0.62). They are saying the same thing.
On the other hand, low volatility has only a very slight connection with reversal, and only a very slight connection with momentum. Those pairs are genuinely different bets.
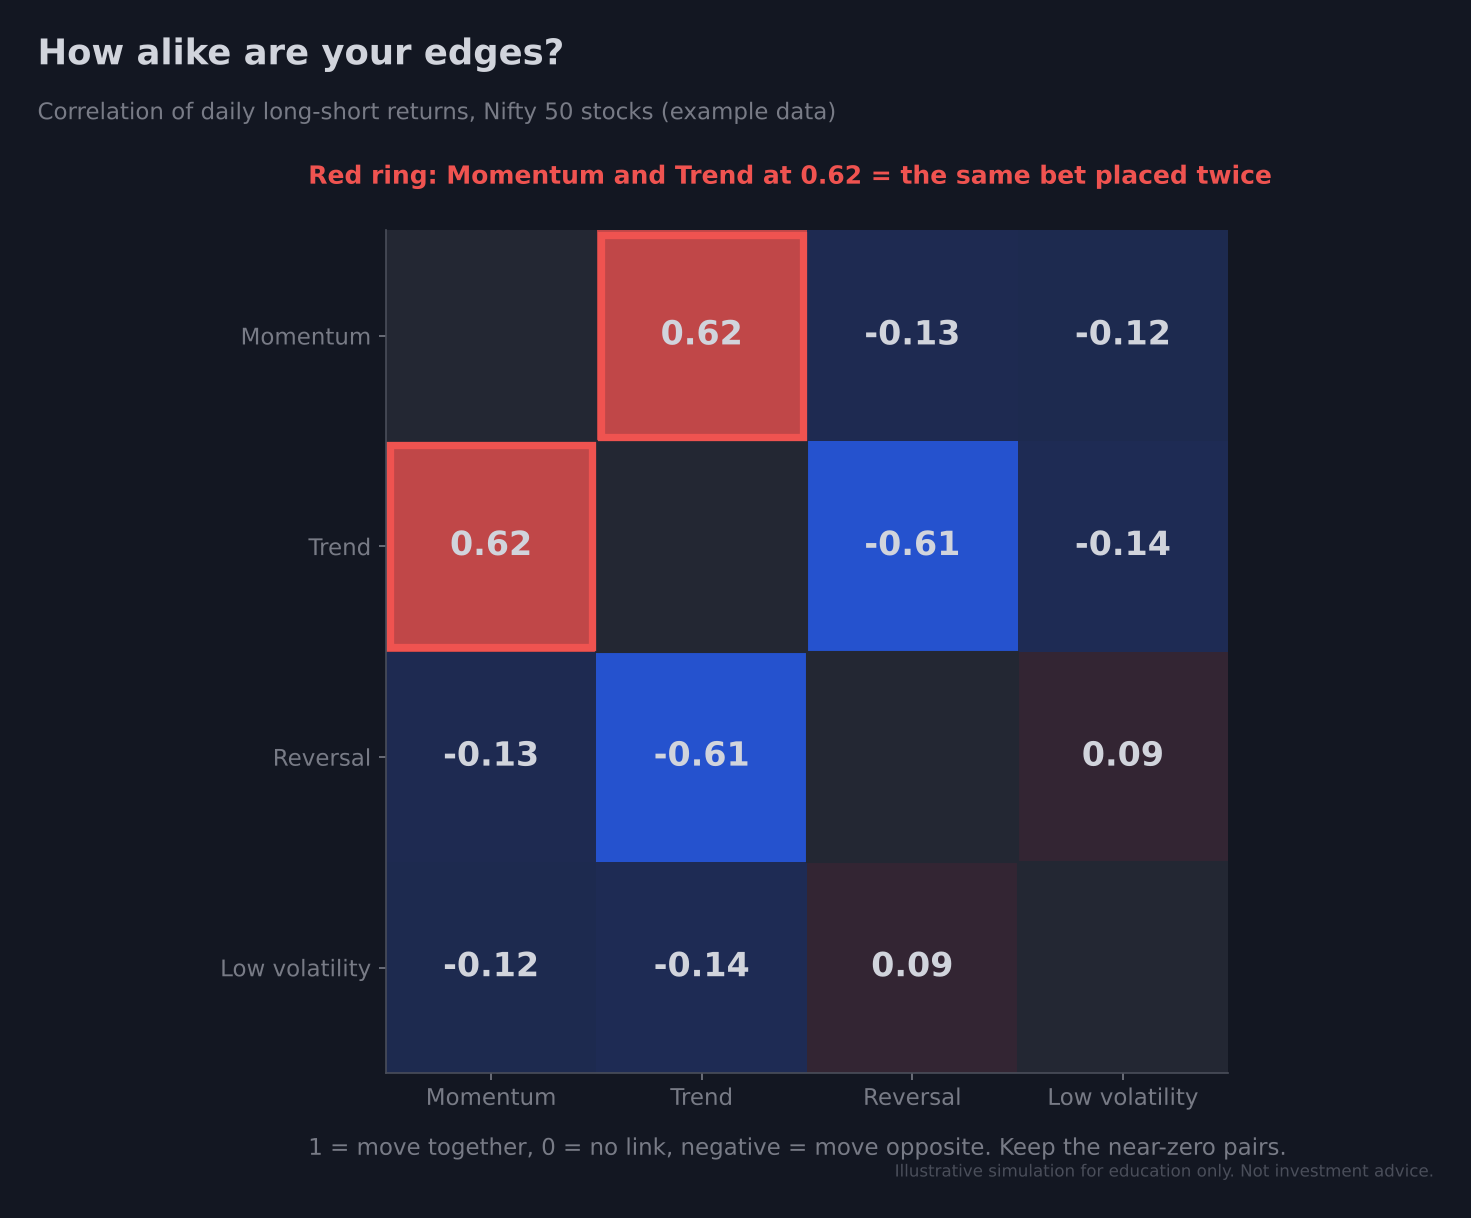
Figure 8: Correlation between four common edges (example data). Momentum and trend at 0.62 are nearly the same bet; the near-zero pairs are the ones worth combining.
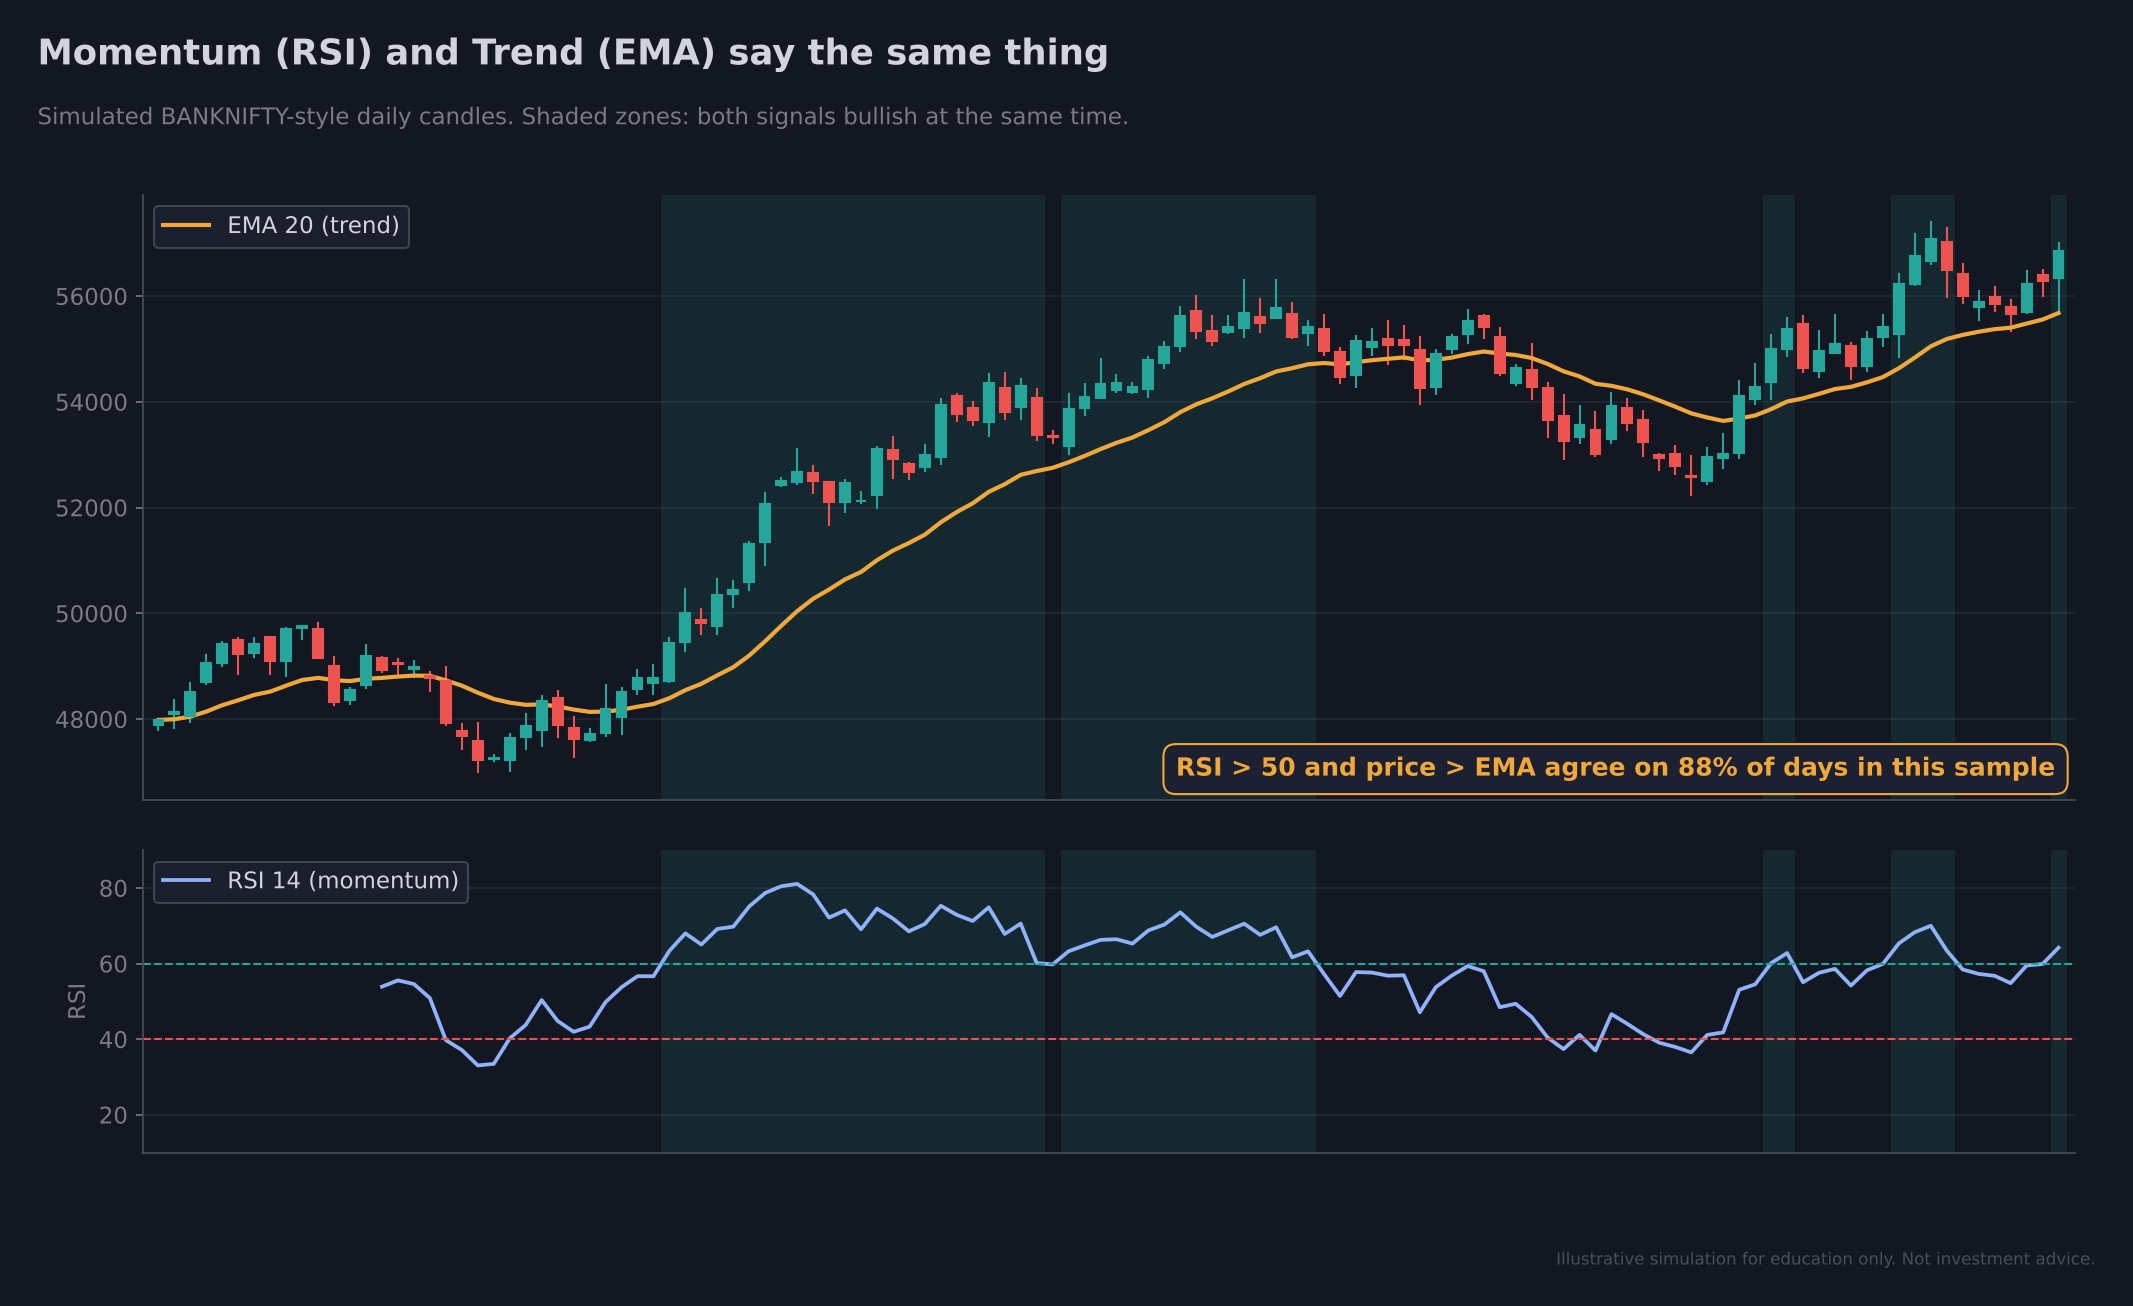
Figure 9: On a chart, momentum (RSI above 60) and trend (price above the EMA) light up in the same zones. Trading both adds risk, not information.
Testing the idea
Hedge funds then test this. Compare two portfolios with the same risk:
- Five alike edges (strongly correlated) behave like one edge.
- Five different edges (uncorrelated) produce a smoother equity curve that is roughly twice as strong.
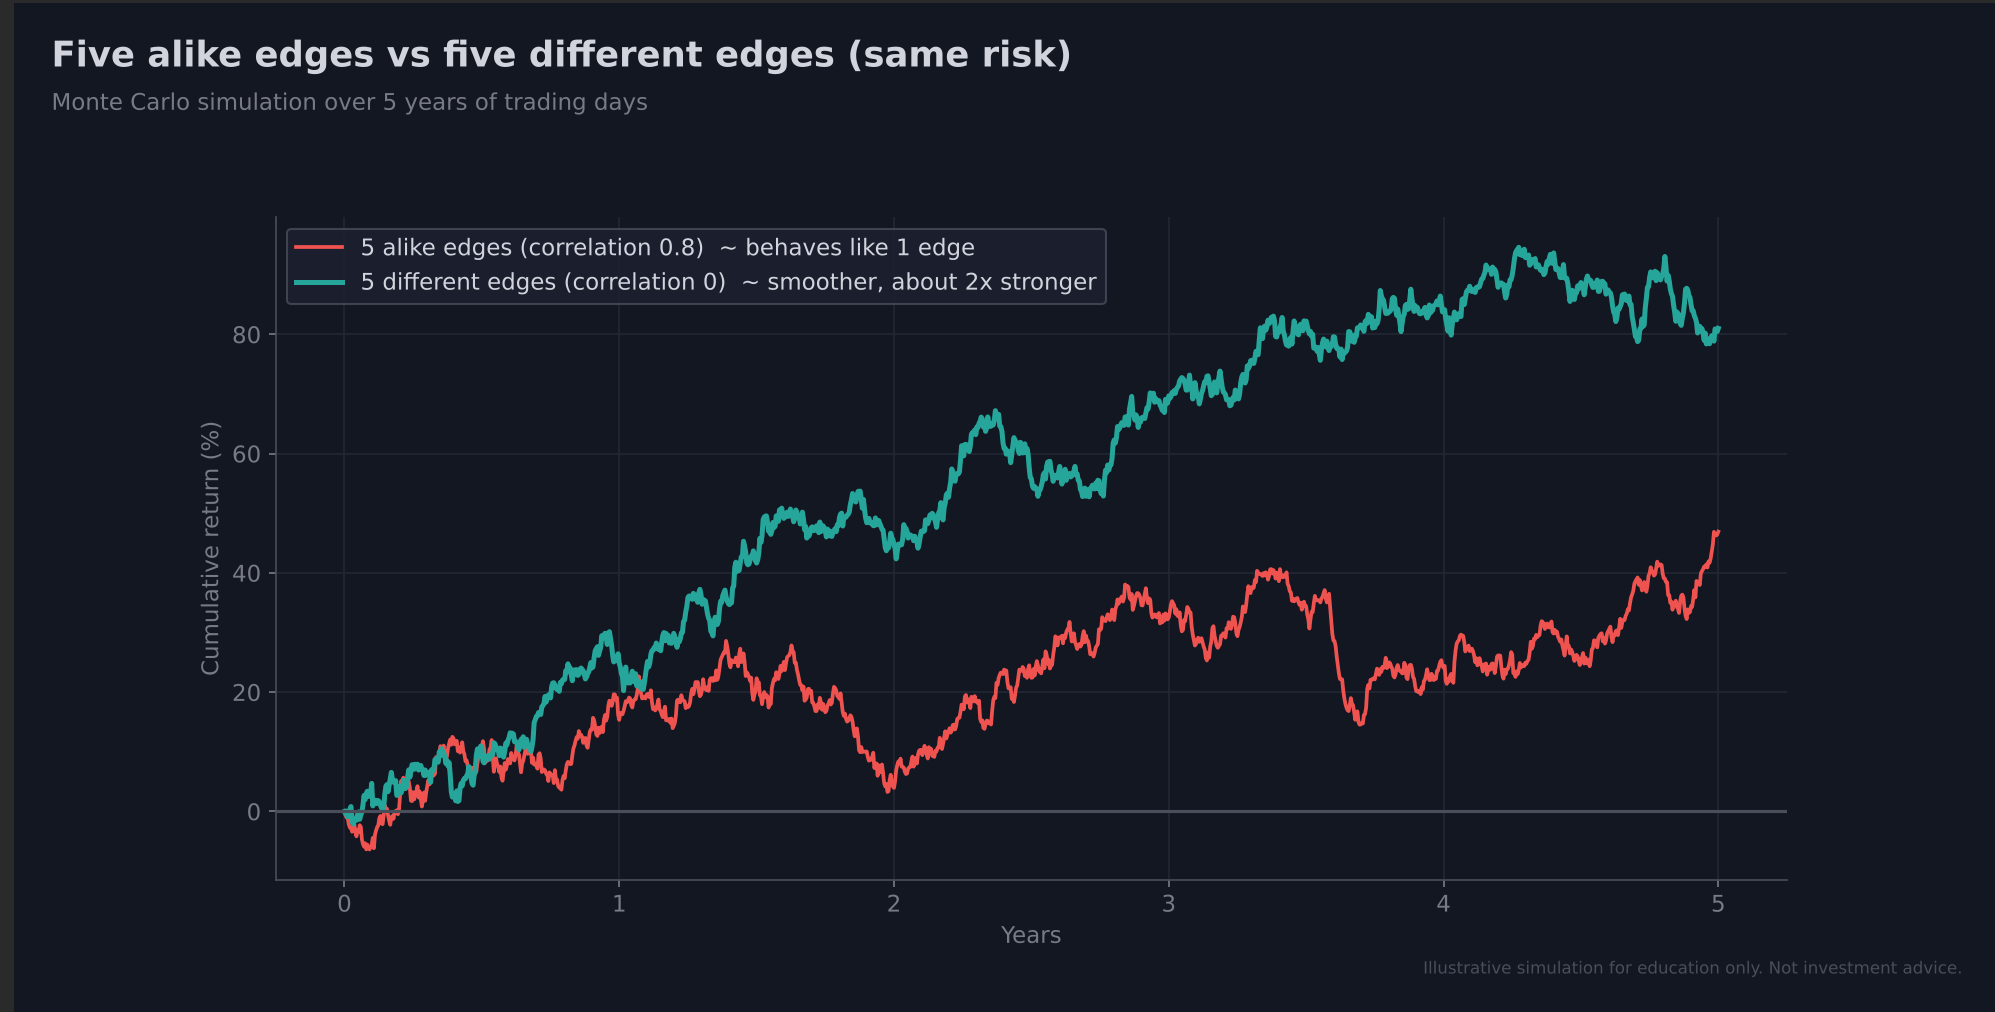
Figure 10: A Monte Carlo simulation over five years. Uncorrelated edges (green) give a smoother, stronger equity curve than correlated edges (red).
Expected result
Your rule set should identify different, non-correlated things. For example, you might work on trend and on open interest, because price and open interest are two different sources of information.
Tip: Keep your bets different, too. Spread across different stocks, sectors and days rather than concentrating everything in one place.
Progress check
| Step | Done |
|---|---|
| 1. Find an alpha | Yes |
| 2. Combine alphas | Yes |
| 3. Keep different alphas together | Yes |
| 4. Many trades or a long time | Next |
| 5. Paper trade first | Later |
Step 4: Take Many Trades, or Give It a Long Time
This is the most critical step, and it may change how you think about the stock market.
The rule: the Law of Large Numbers
The Law of Large Numbers is a mathematical rule. It says:
If you take a lot of trades on your edge, or wait for a long time, the edge actually starts to show.
How it works: a simulation
Suppose you have a strategy with a small, real edge: it wins 51% of the time at a 1:1 risk-to-reward. We run that same strategy 40 different times (40 “runs”) and watch what happens as the number of trades grows. This is a Monte Carlo simulation.
| Number of trades | Rough time frame | Chance you are still NOT in profit |
|---|---|---|
| 30 | about 1 month | 53% |
| 300 | about 4 months | 39% |
| 3,000 | about 10 years (one trade a day) | 14% |
| 30,000 | algo / scalping scale | 0.03% |
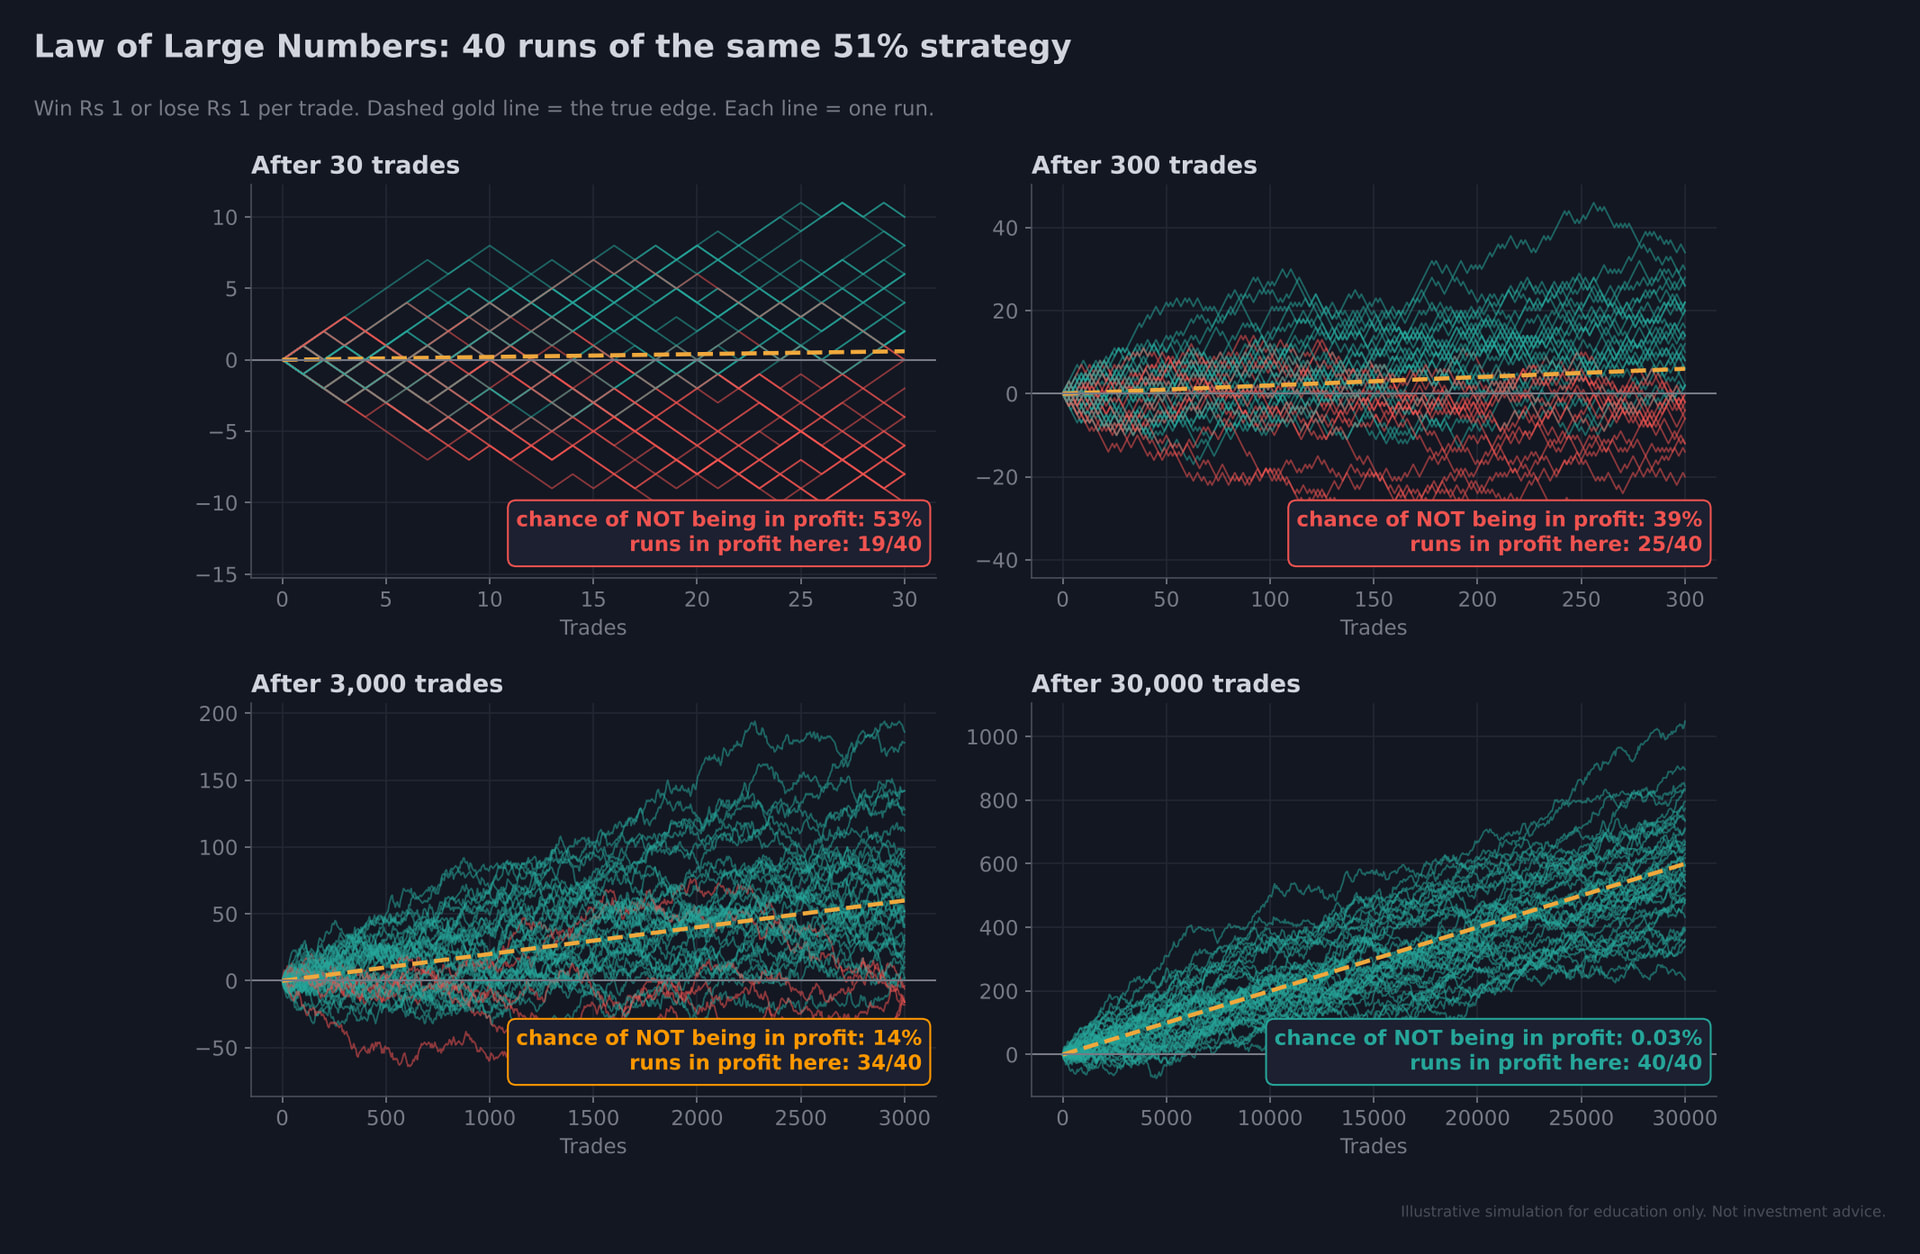
Figure 11: Forty runs of the same 51% strategy. After 30 trades the results are scattered; after 30,000 trades all 40 runs are in profit and hug the true edge (dashed gold line).
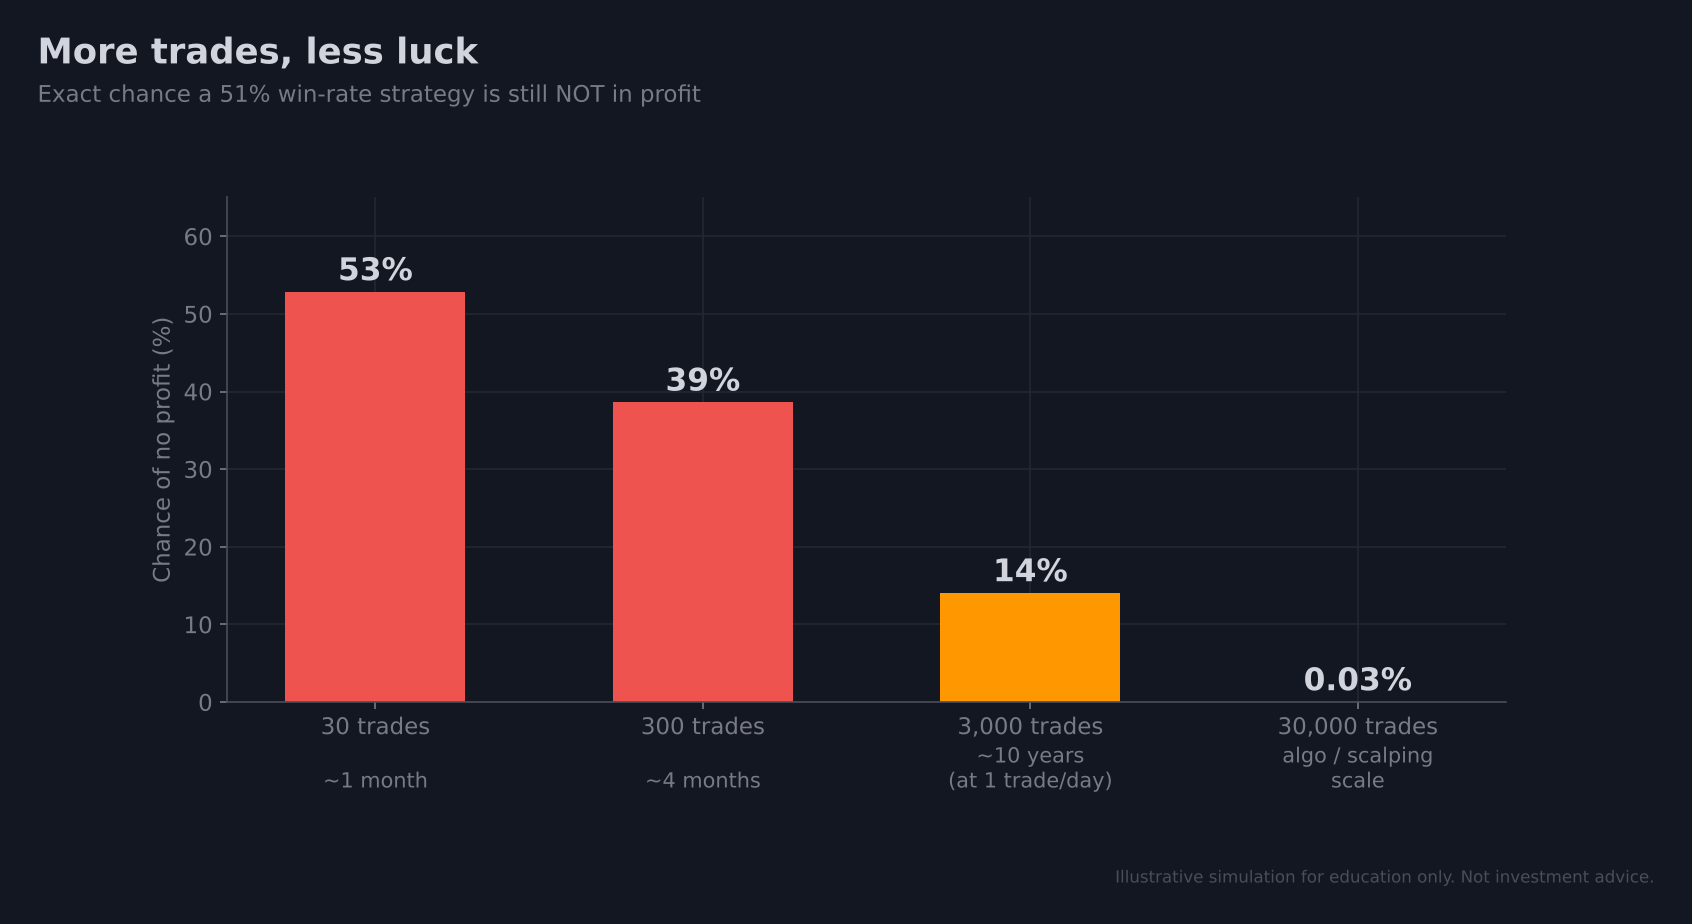
Figure 12: The exact chance that a 51% strategy is still not in profit falls from 53% to 0.03% as the number of trades grows.
What this means
- When you run a strategy for a short time, it can make money or lose money. It is roughly a coin flip.
- Run it for 2 to 4 months and your chances improve.
- Run it for 10 years and your chances improve a lot.
- Run it 30,000 times and the chance of losing money is close to zero.
Expected result
You cannot judge any strategy on only 10 to 15 trades. Either take many more trades or wait a long time. Only then does a strategy show its true colours. If your backtest showed a genuine edge, it will reflect in your results over the long run.
Warning: The law of large numbers only helps if the edge is real and each bet is small enough that no single loss can ruin you.
Real-world case study: a market maker
Market makers are the top breed of the stock market. Firms such as Jane Street, Virtu Financial and Citadel trade enormous volumes and work in billions.
Virtu Financial went public in 2015, and its public figures show the law of large numbers at work:
| Fact | Detail |
|---|---|
| Winning trades | Only about 51 to 52% of its trades make money, close to a coin flip |
| Edge | About 1 to 2% |
| Trades per day | About 53 lakh trades every day (2014 average) |
| Losing days | Just 1 losing day in 1,485 trading days (about 5 to 6 years) |
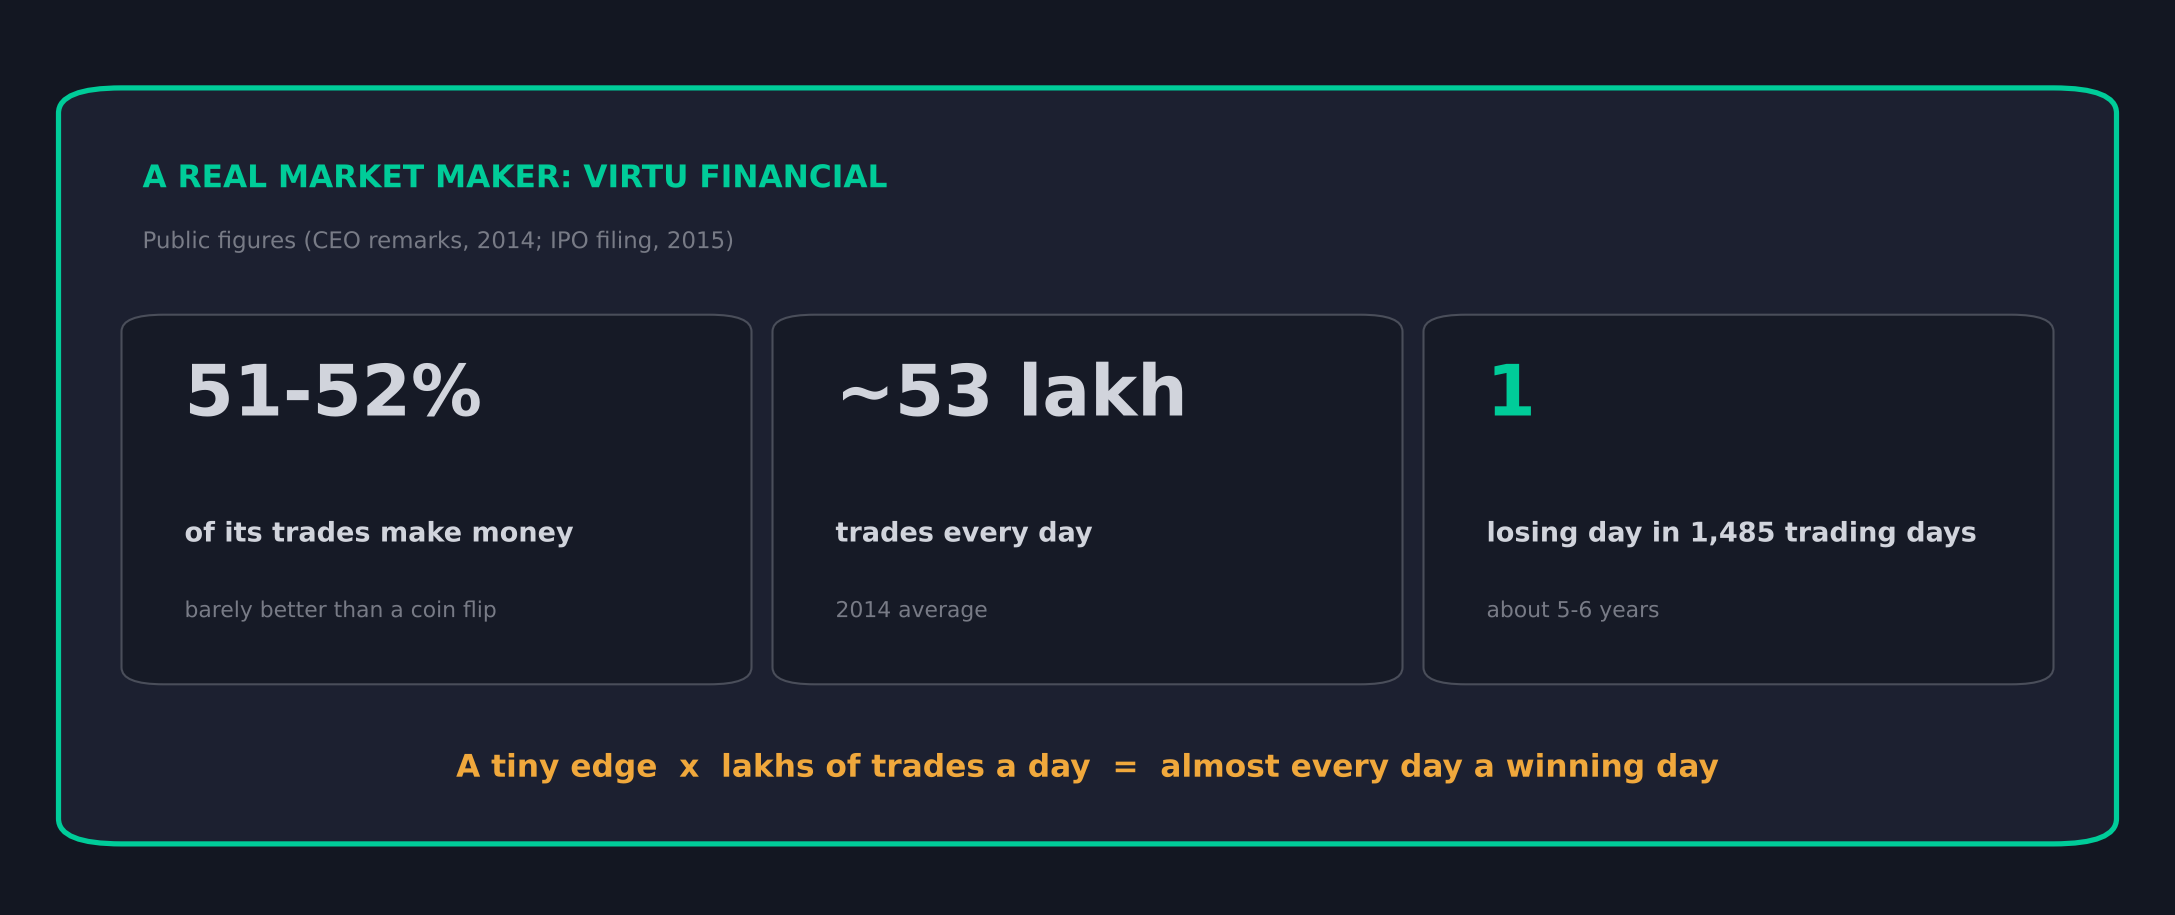
Figure 13: A tiny edge multiplied by lakhs of trades a day produces almost every day a winning day.
How does it do this? Market makers provide liquidity by quoting the bid and ask. Their trades are very small and very short, often lasting 1, 4 or 10 seconds, and even milliseconds, using co-location. Doing the same thing millions of times lets the underlying edge reveal itself.
What a retail trader can do
As a retail trader, you cannot take 53 lakh trades a day. But you can apply the same principle:
- Diversify your positions
- Stay in the market for a long time
- Do not change your strategy every week
- Give it 1, 2, 3 or 4 years and let the edge show
For scalpers: this principle suits scalping well, because scalping runs on a small edge. But you cannot scalp at that scale manually. You need an algo that repeats the same edge again and again, with discipline, across many trades.
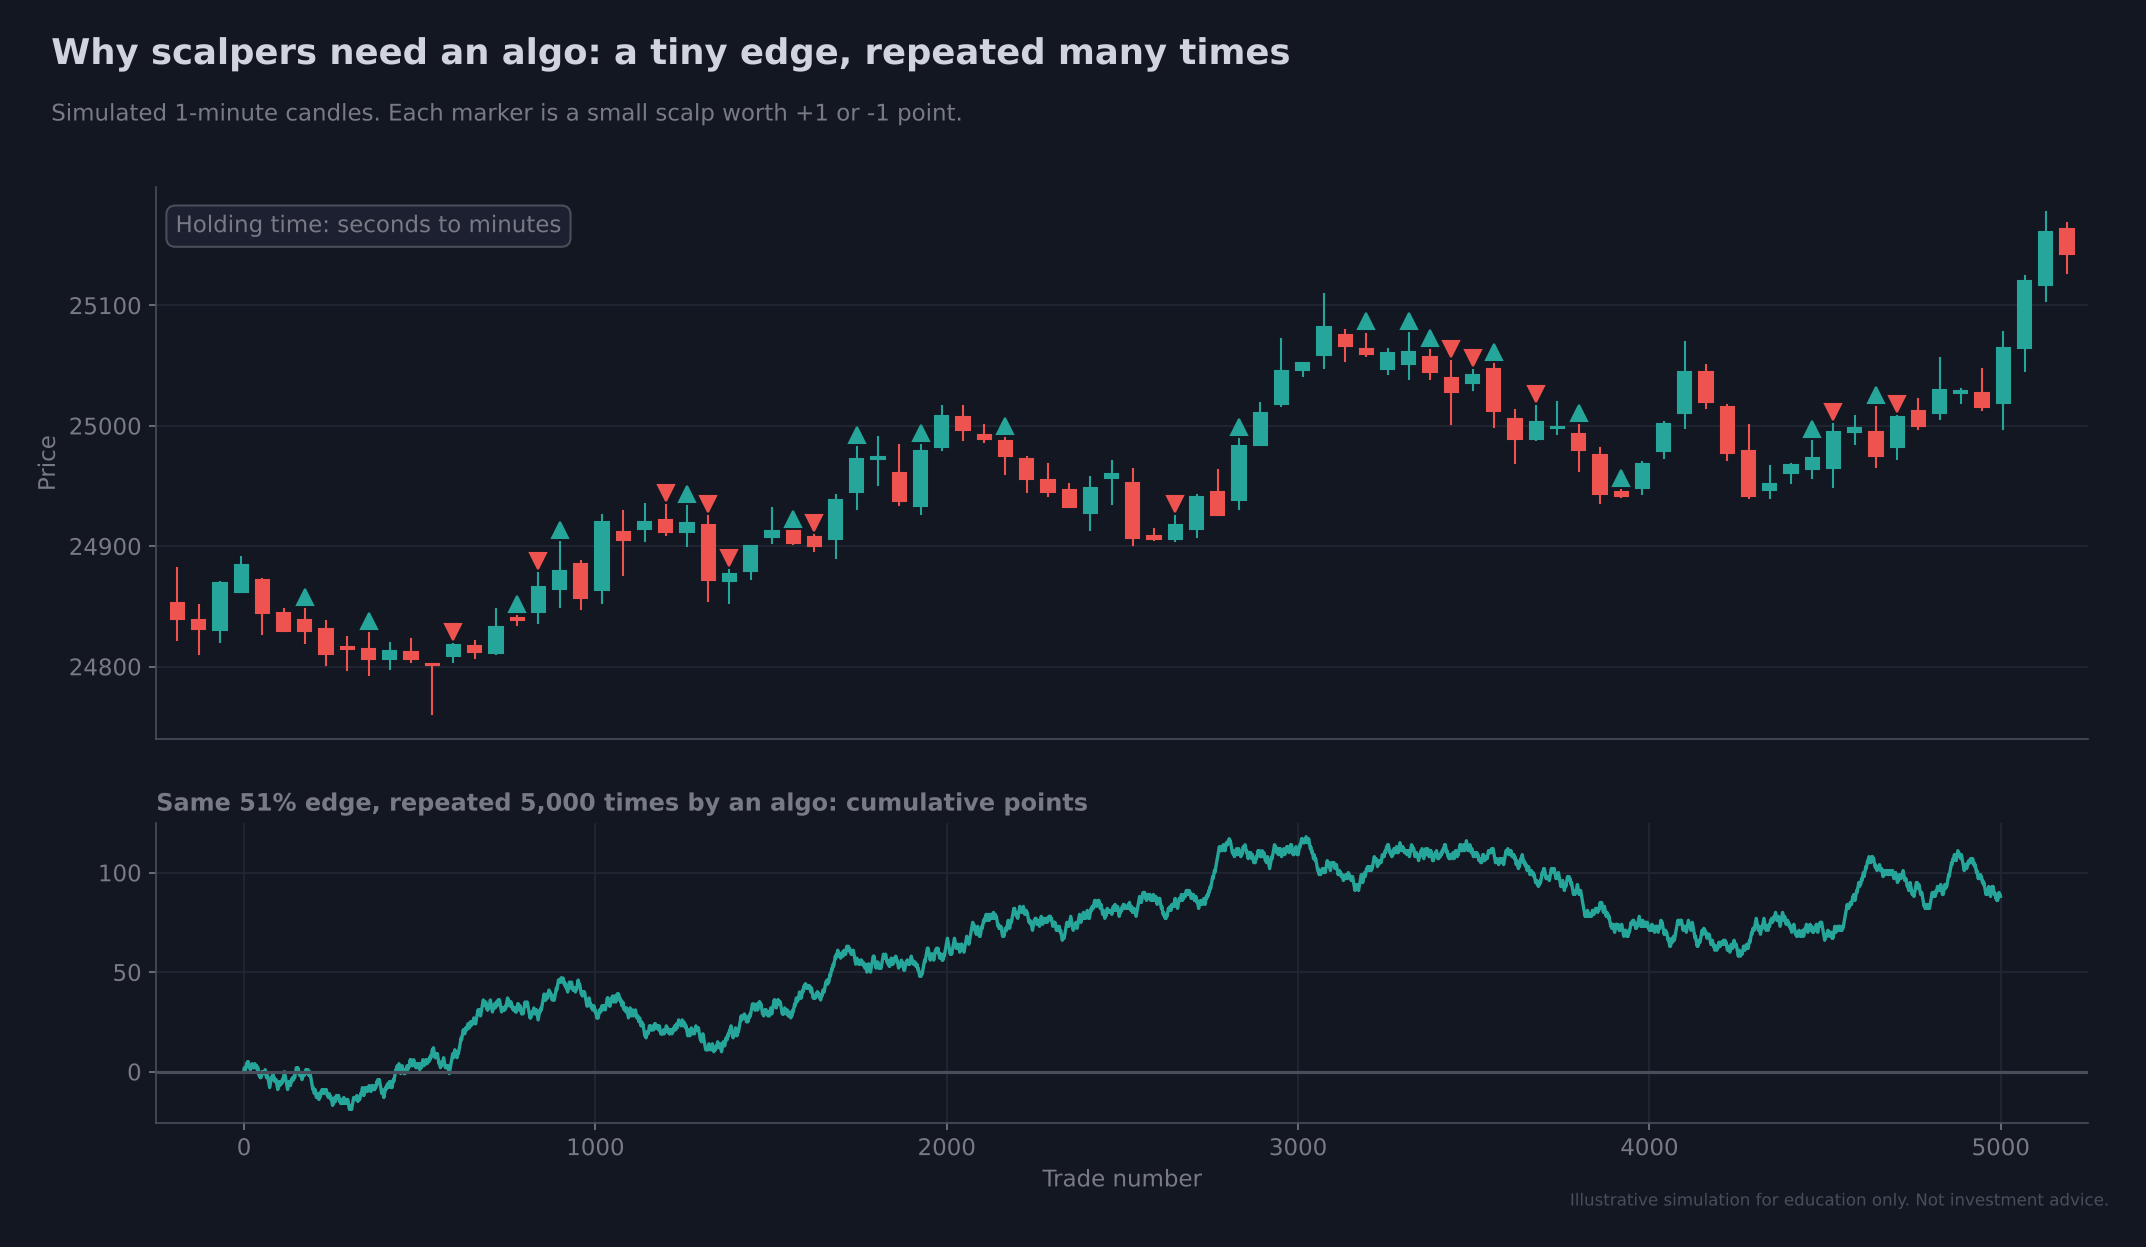
Figure 14: A scalper’s edge is tiny per trade. Repeated thousands of times by an algo, the same 51% edge becomes visible in the cumulative curve.
Step 5: Paper Trade First
So far we have seen the four steps hedge funds follow. Now let us look at how you, as a retail trader, can implement them.
What needs to be done
- Backtest to find your edge.
- Once the backtest passes, start paper trading.
- Only after that, move to live trading with small size.
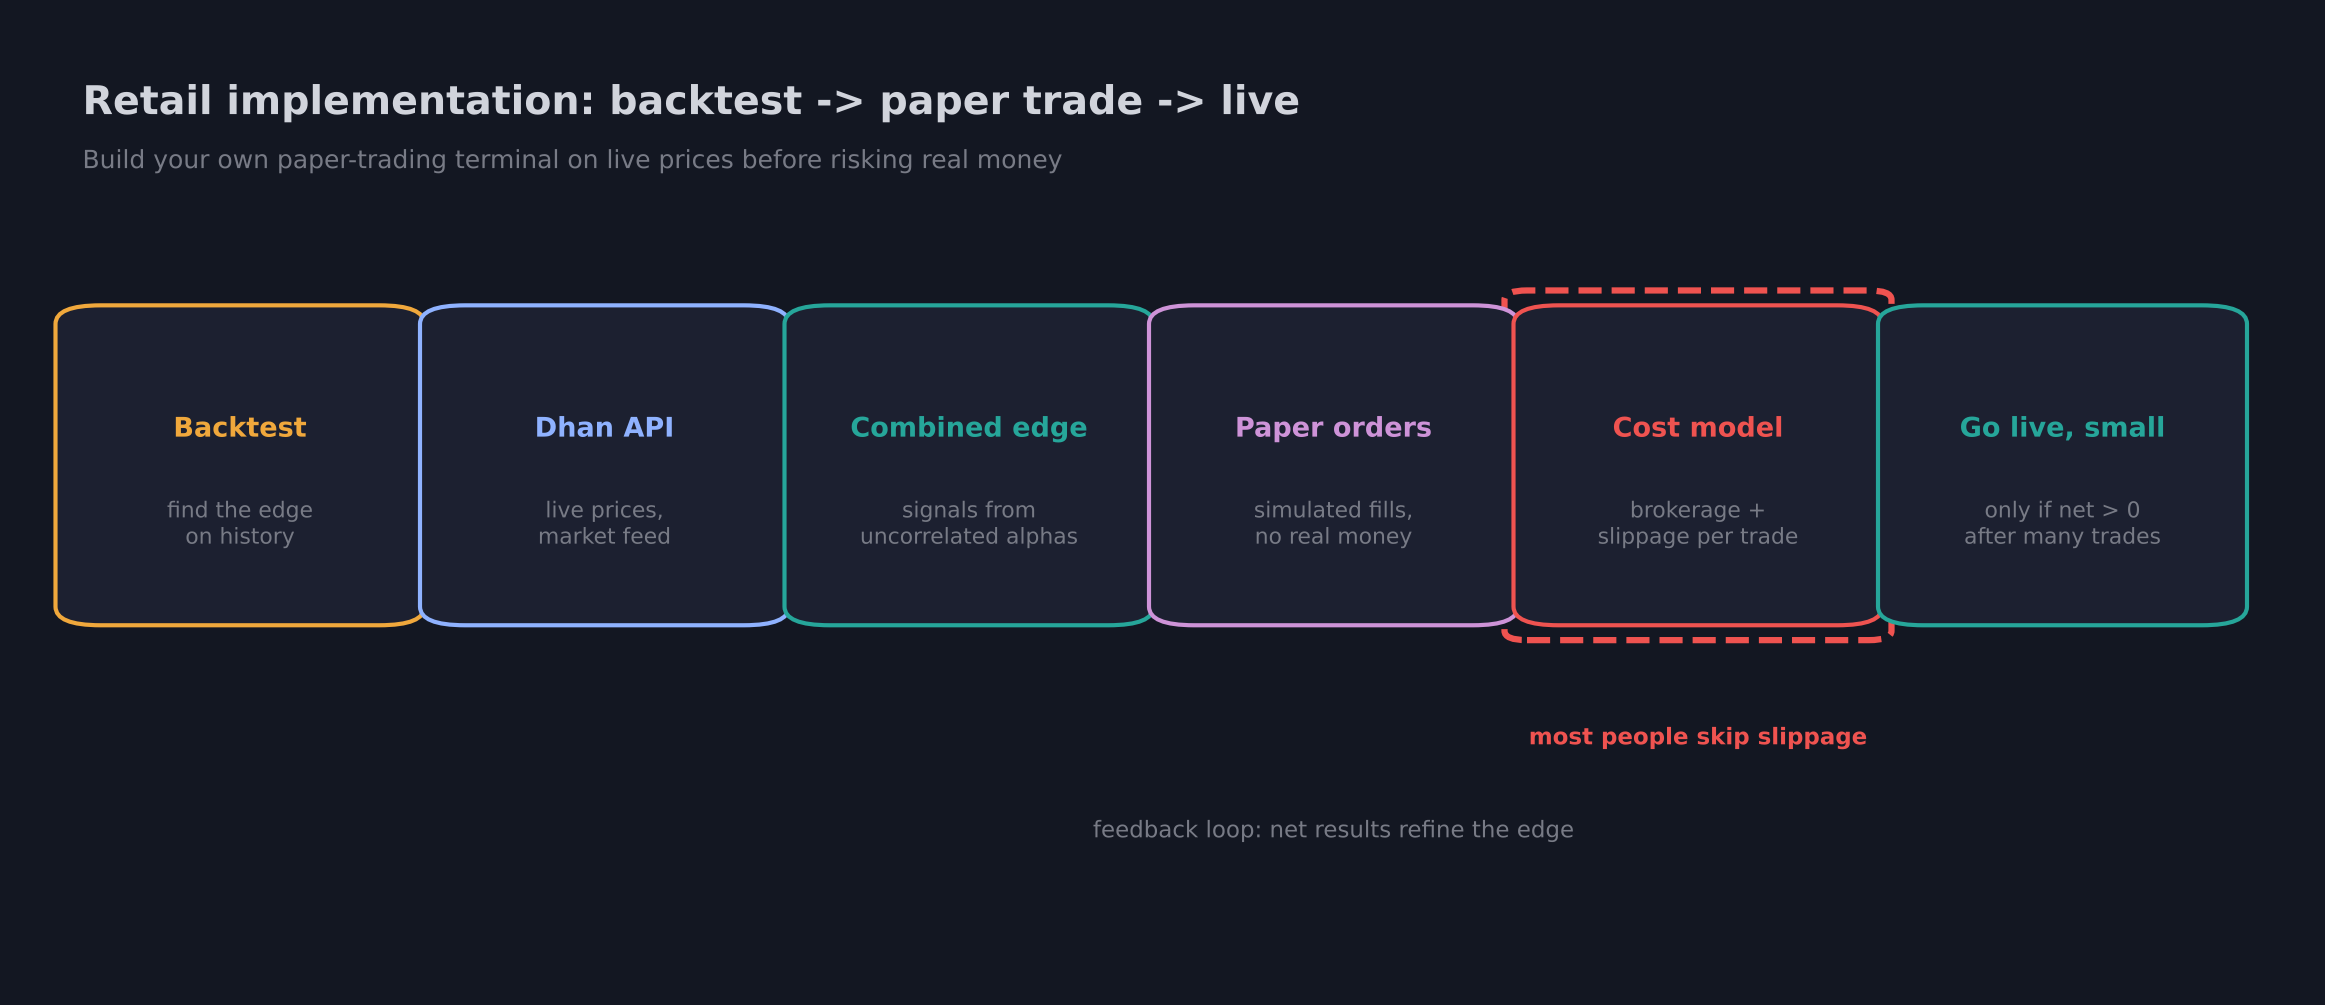
Figure 15: The retail implementation path. The cost model (brokerage plus slippage) is the step most people skip.
Why paper trading matters
Paper trading is not optional. Before you use real money, it shows you how your strategy performs live, without spending anything.
How it works
- Use the Dhan API to pull live prices.
- Build your own paper-trading terminal with Claude. (Building apps with Claude is covered in detail in the earlier videos of this series.)
- Let your combined edge generate signals, and convert every signal into a paper order. No real money moves.
- Take many trades across different scripts (stocks), so the law of large numbers can work.
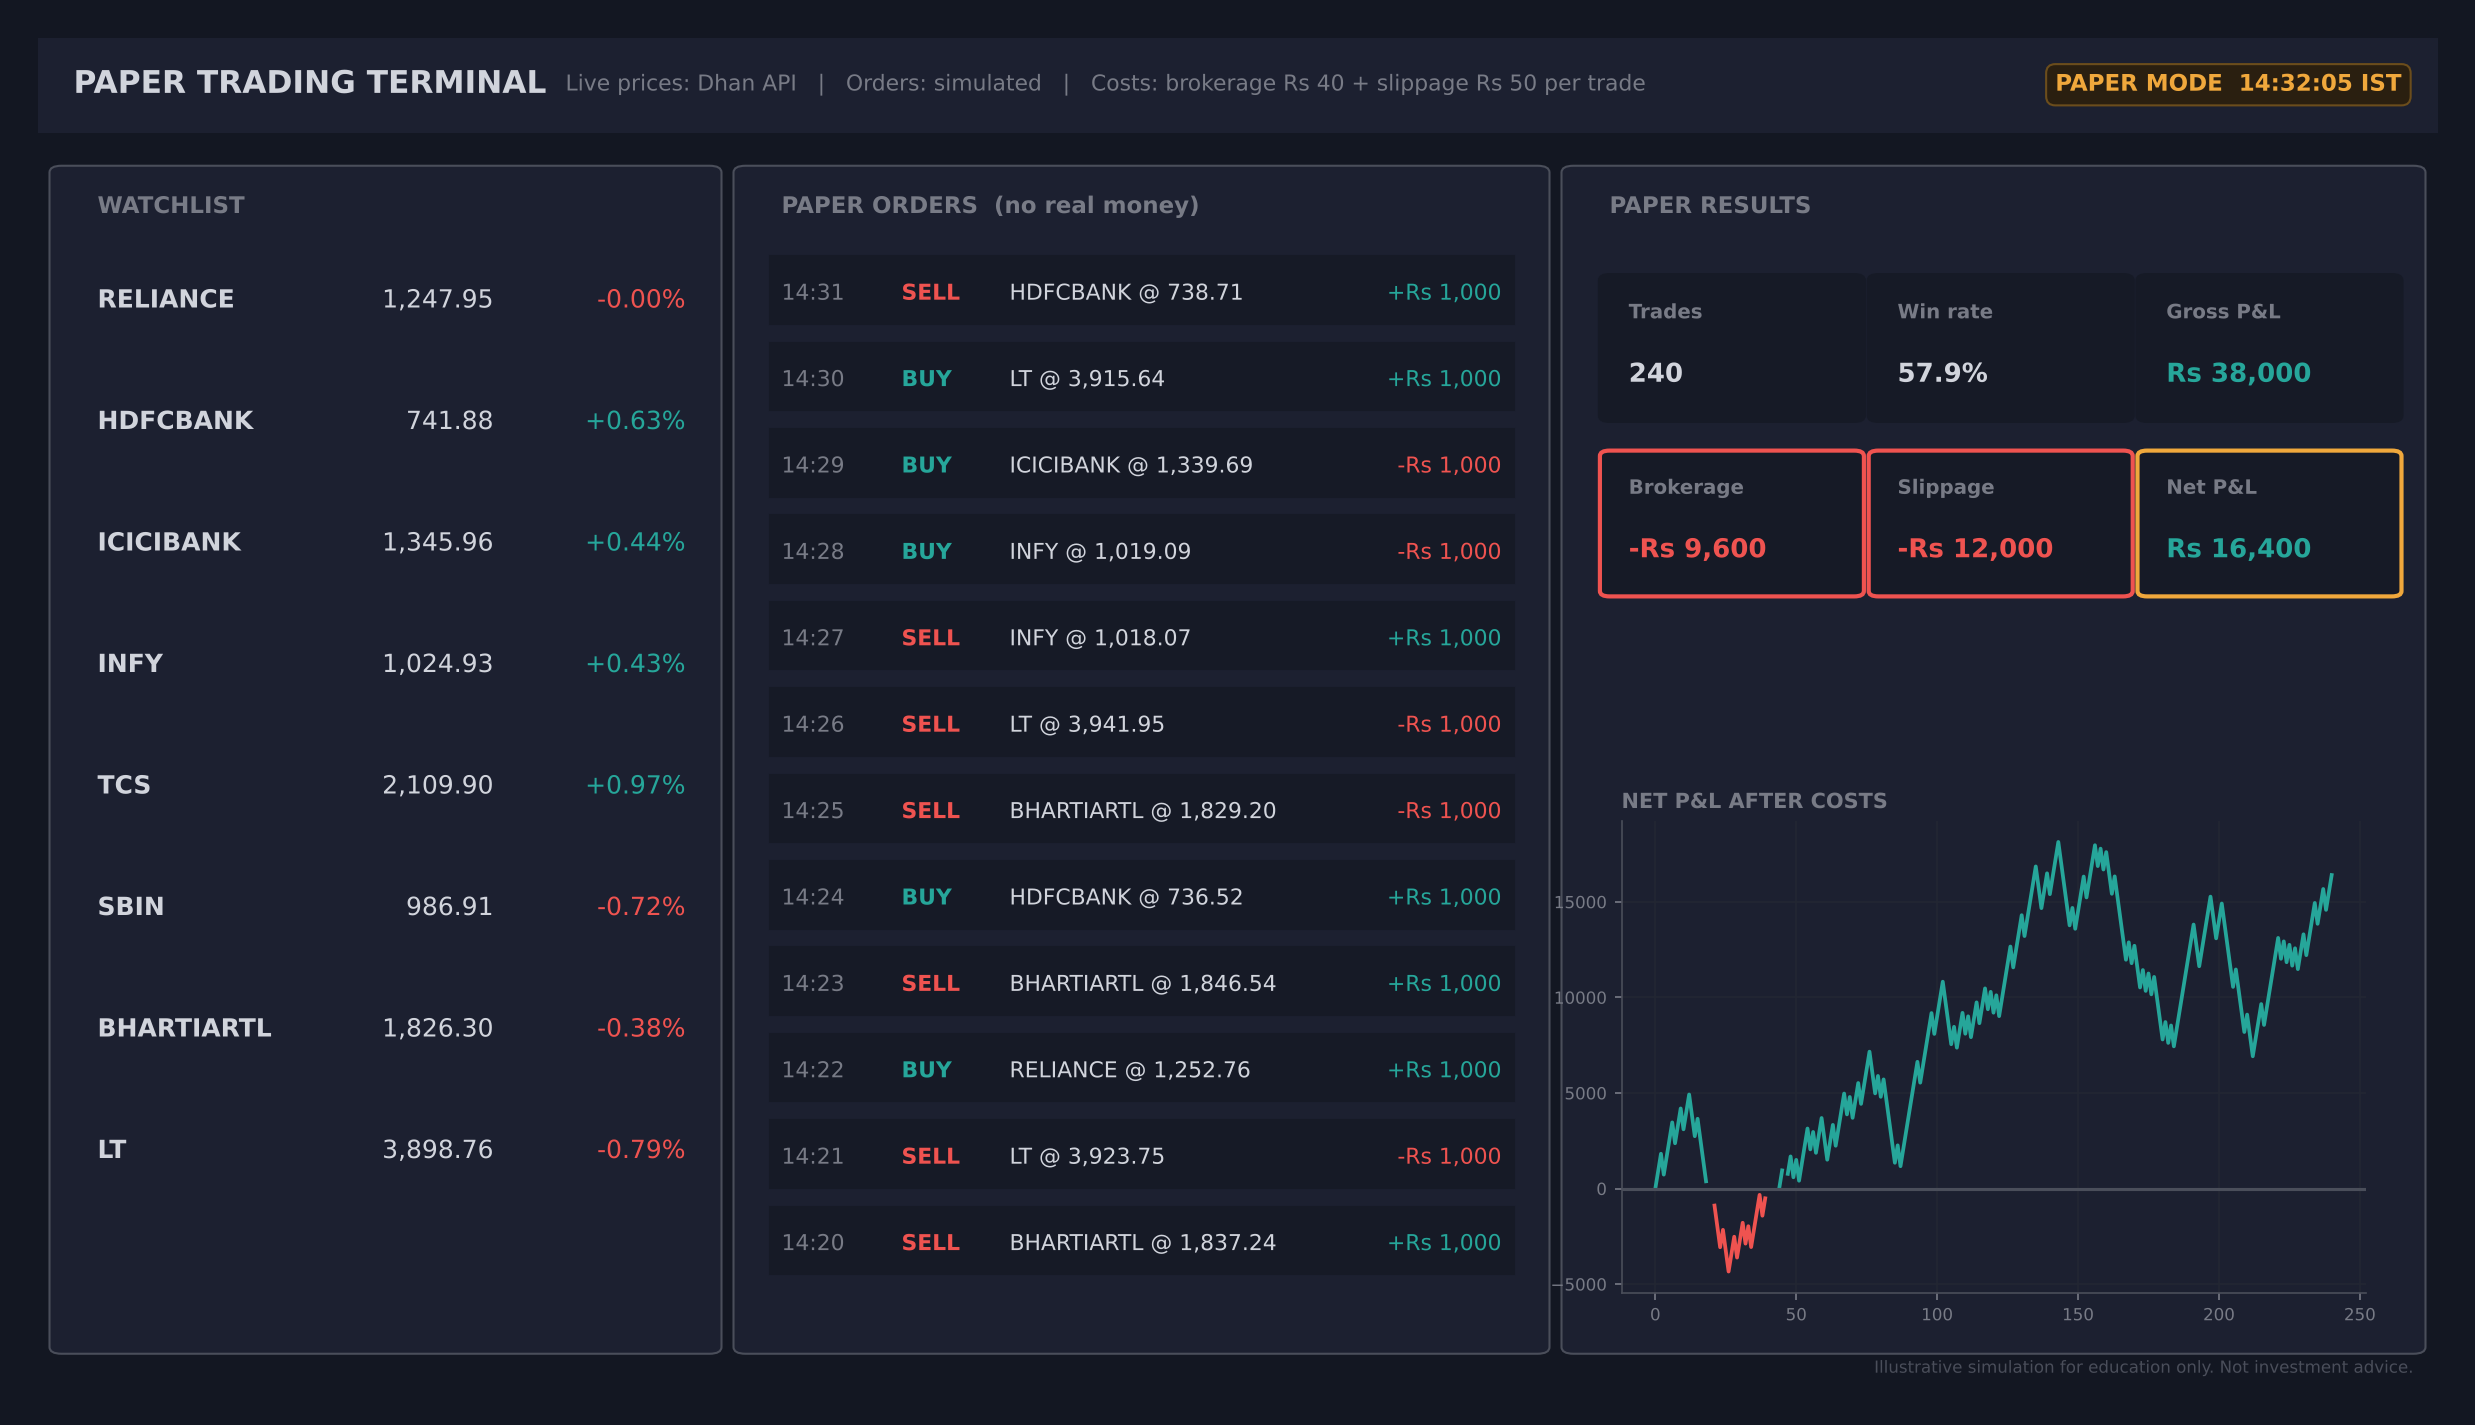
Figure 16: An example paper-trading terminal. Watchlist on the left, simulated orders in the middle, and results after brokerage and slippage on the right.
Note: The terminal above is an illustration. You can build your own version using the Dhan API.
The one rule
While paper trading, track how much brokerage and how much slippage you are paying. After all your wins and losses, whatever is left must be bigger than these costs.
There is only one rule:
Edge - Brokerage - Slippage > 0
If money is still left after cutting both, you have an edge. Because you have included brokerage and slippage, your strategy should perform the same way live.
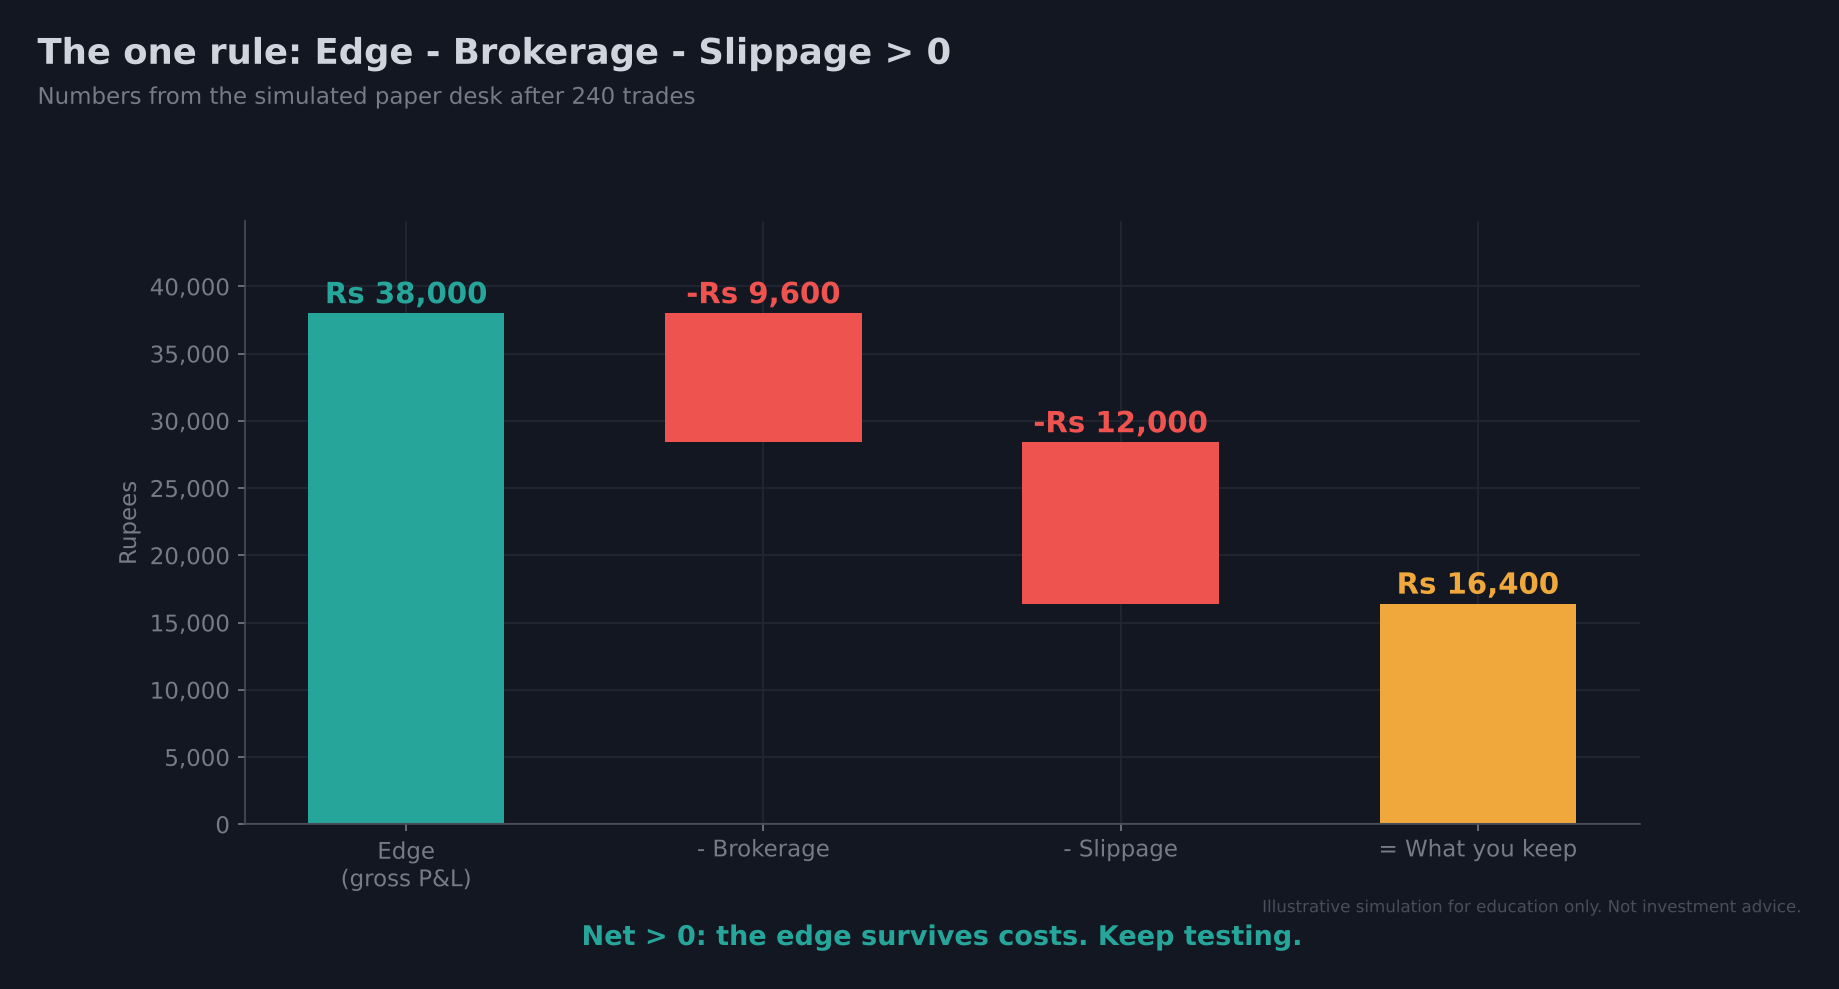
Figure 17: The one rule, using the paper desk’s numbers after 240 trades: Rs 38,000 gross, minus Rs 9,600 brokerage and Rs 12,000 slippage, leaves Rs 16,400.
Warning: Most people count only brokerage. Slippage costs you too. Cutting both is mandatory.
Expected result
After hundreds of paper trades that still make money after all costs, you can start live trading, beginning with small size.
A Simple Way to Understand It: The Business Analogy
Imagine you run a business. Some days you make a profit, some days a loss, and you also pay tax to the government.
Say your yearly turnover is Rs 1 crore, and after cutting all costs you are left with only Rs 1.5 to 2 lakh. That is a thin margin, but it is still an edge.
The difference:
- In a physical business, you cannot repeat that edge again and again quickly.
- In the stock market, a computer can repeat the edge very fast.
If you automate that business process with a computer and run it a thousand times, your margin grows. It is like pressing a time-machine button that fast-forwards time, so your edge starts to show.
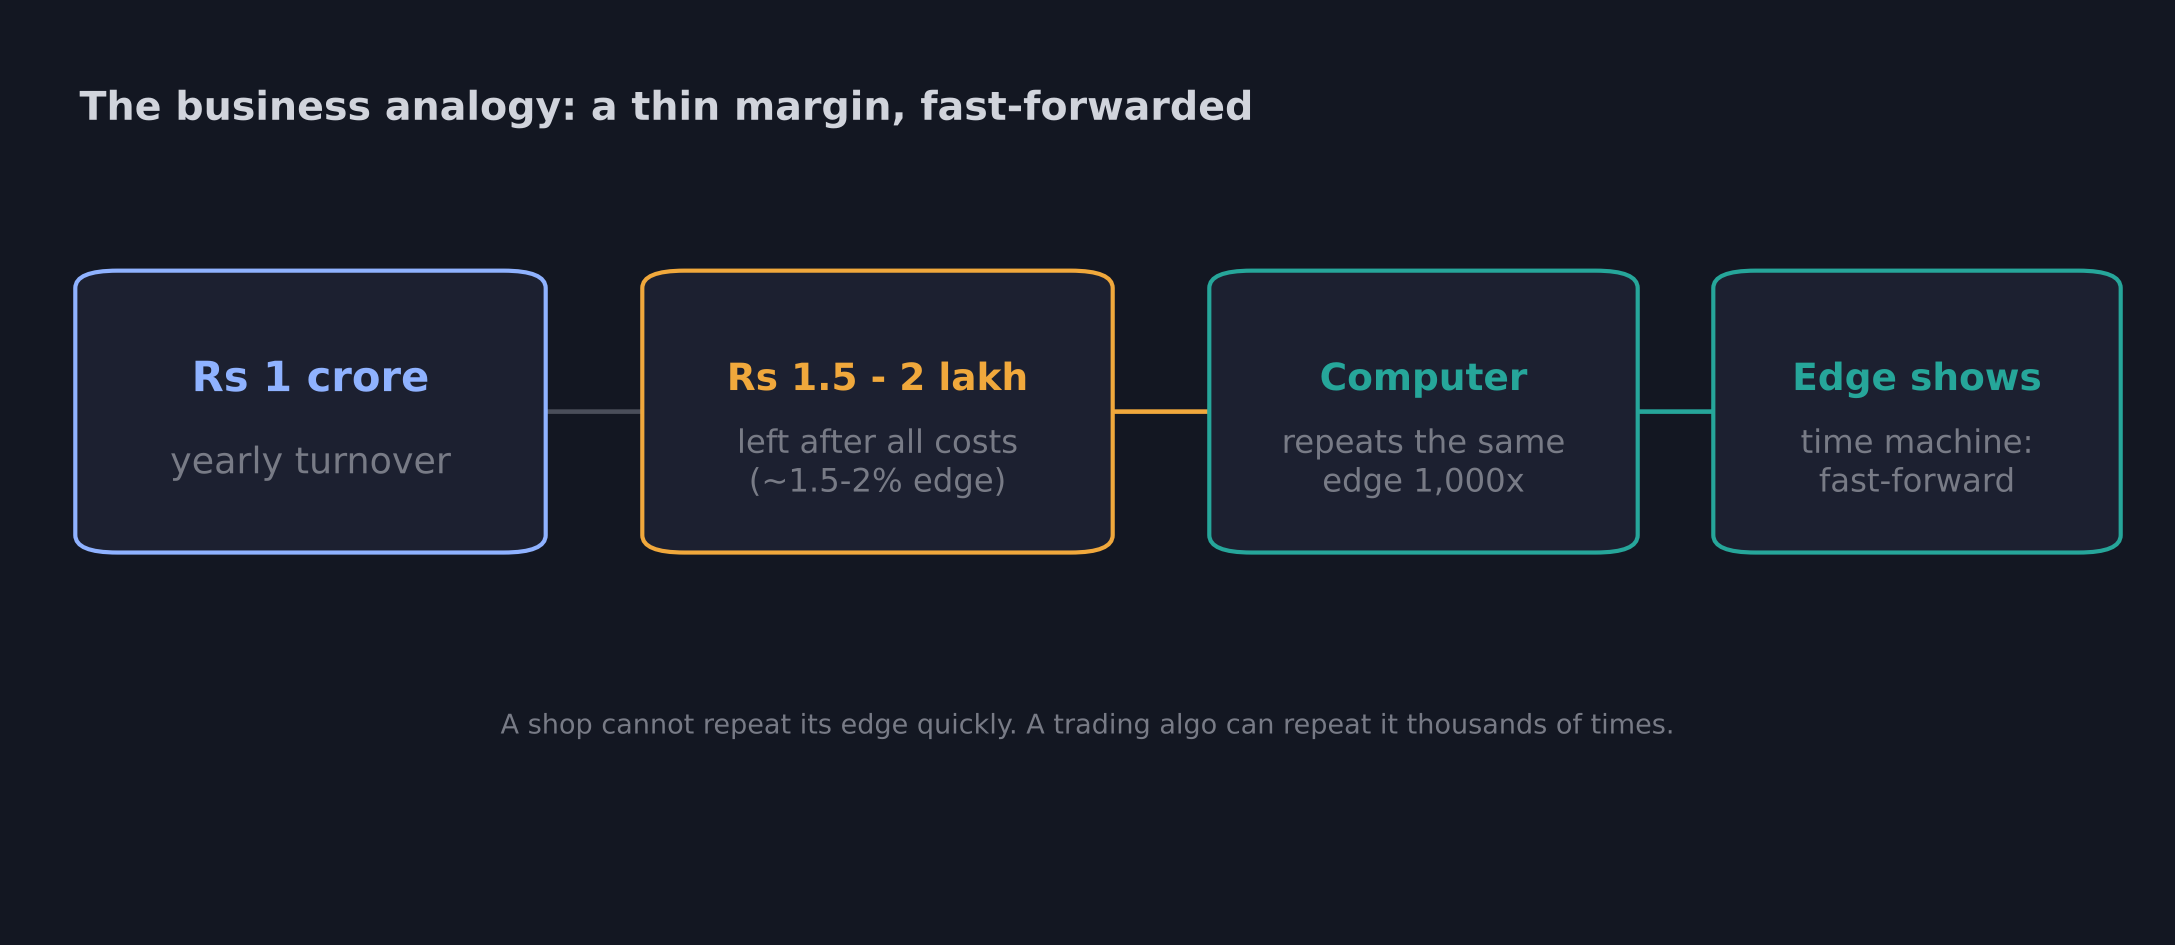
Figure 18: A thin margin becomes meaningful when a computer repeats it thousands of times.
Where to Find Edges: 101 Formulaic Alphas
To start finding edges quickly, you can use a public research paper: “101 Formulaic Alphas” by Zura Kakushadze. It lists 101 real alpha formulas.
Key points from the paper:
- The average holding period of these alphas ranges from about 0.6 to 6.4 days, so from intraday to about a week.
- They are already low-correlated: the average pairwise correlation is about 15.9%, which fits Step 3.
- Their returns are correlated with volatility.
- The formulas use only open, high, low, close and volume data.
For example, one alpha measures the correlation between price and volume over the last 10 periods:
Alpha#6 = -1 * correlation(open, volume, 10)
When price and volume are strongly linked, the market is often trending. Formulas like this are written in a form you can hand directly to Claude to implement.
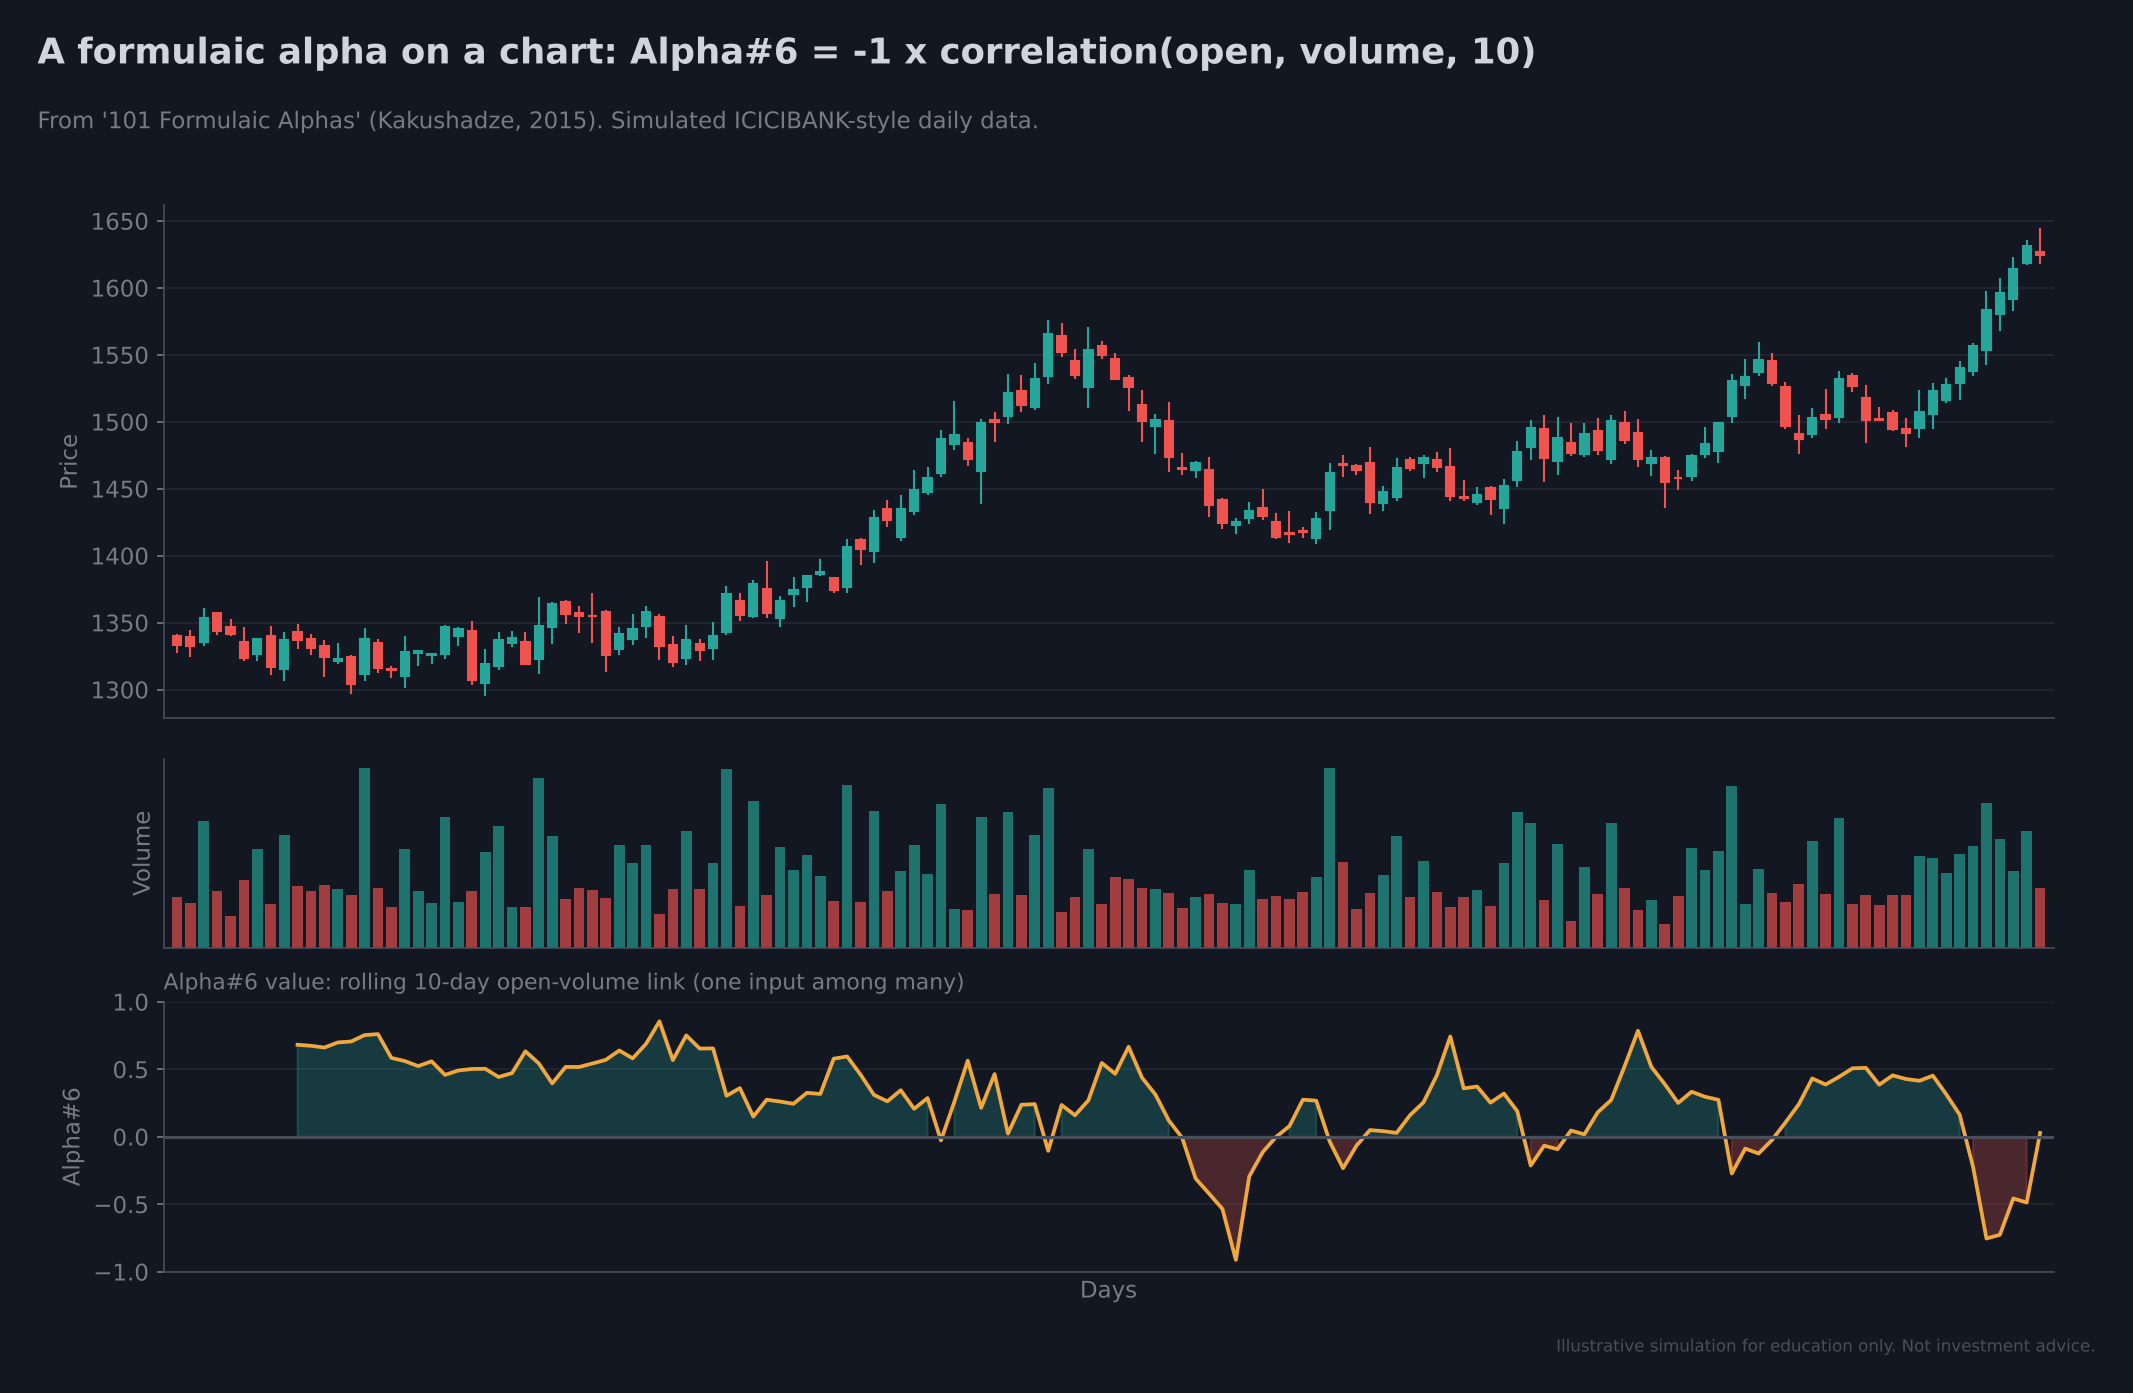
Figure 19: A formulaic alpha on a chart. The bottom panel shows Alpha#6, a rolling 10-day open-volume correlation, as one input among many.
How to use them
- Use these formulas directly, or give the paper to Claude so it understands the edges.
- Combine them with your own logic, such as Supertrend, RSI, Gann, trendlines, head and shoulders or volume breakouts.
- Follow the five steps with Claude to build a portfolio of edges and check whether your strategy is working.
Tip: Treat each formula as one candidate edge. It still has to pass Steps 1 to 5: a positive edge after costs, combined with other different edges, tested over many trades, and paper traded first.
Summary
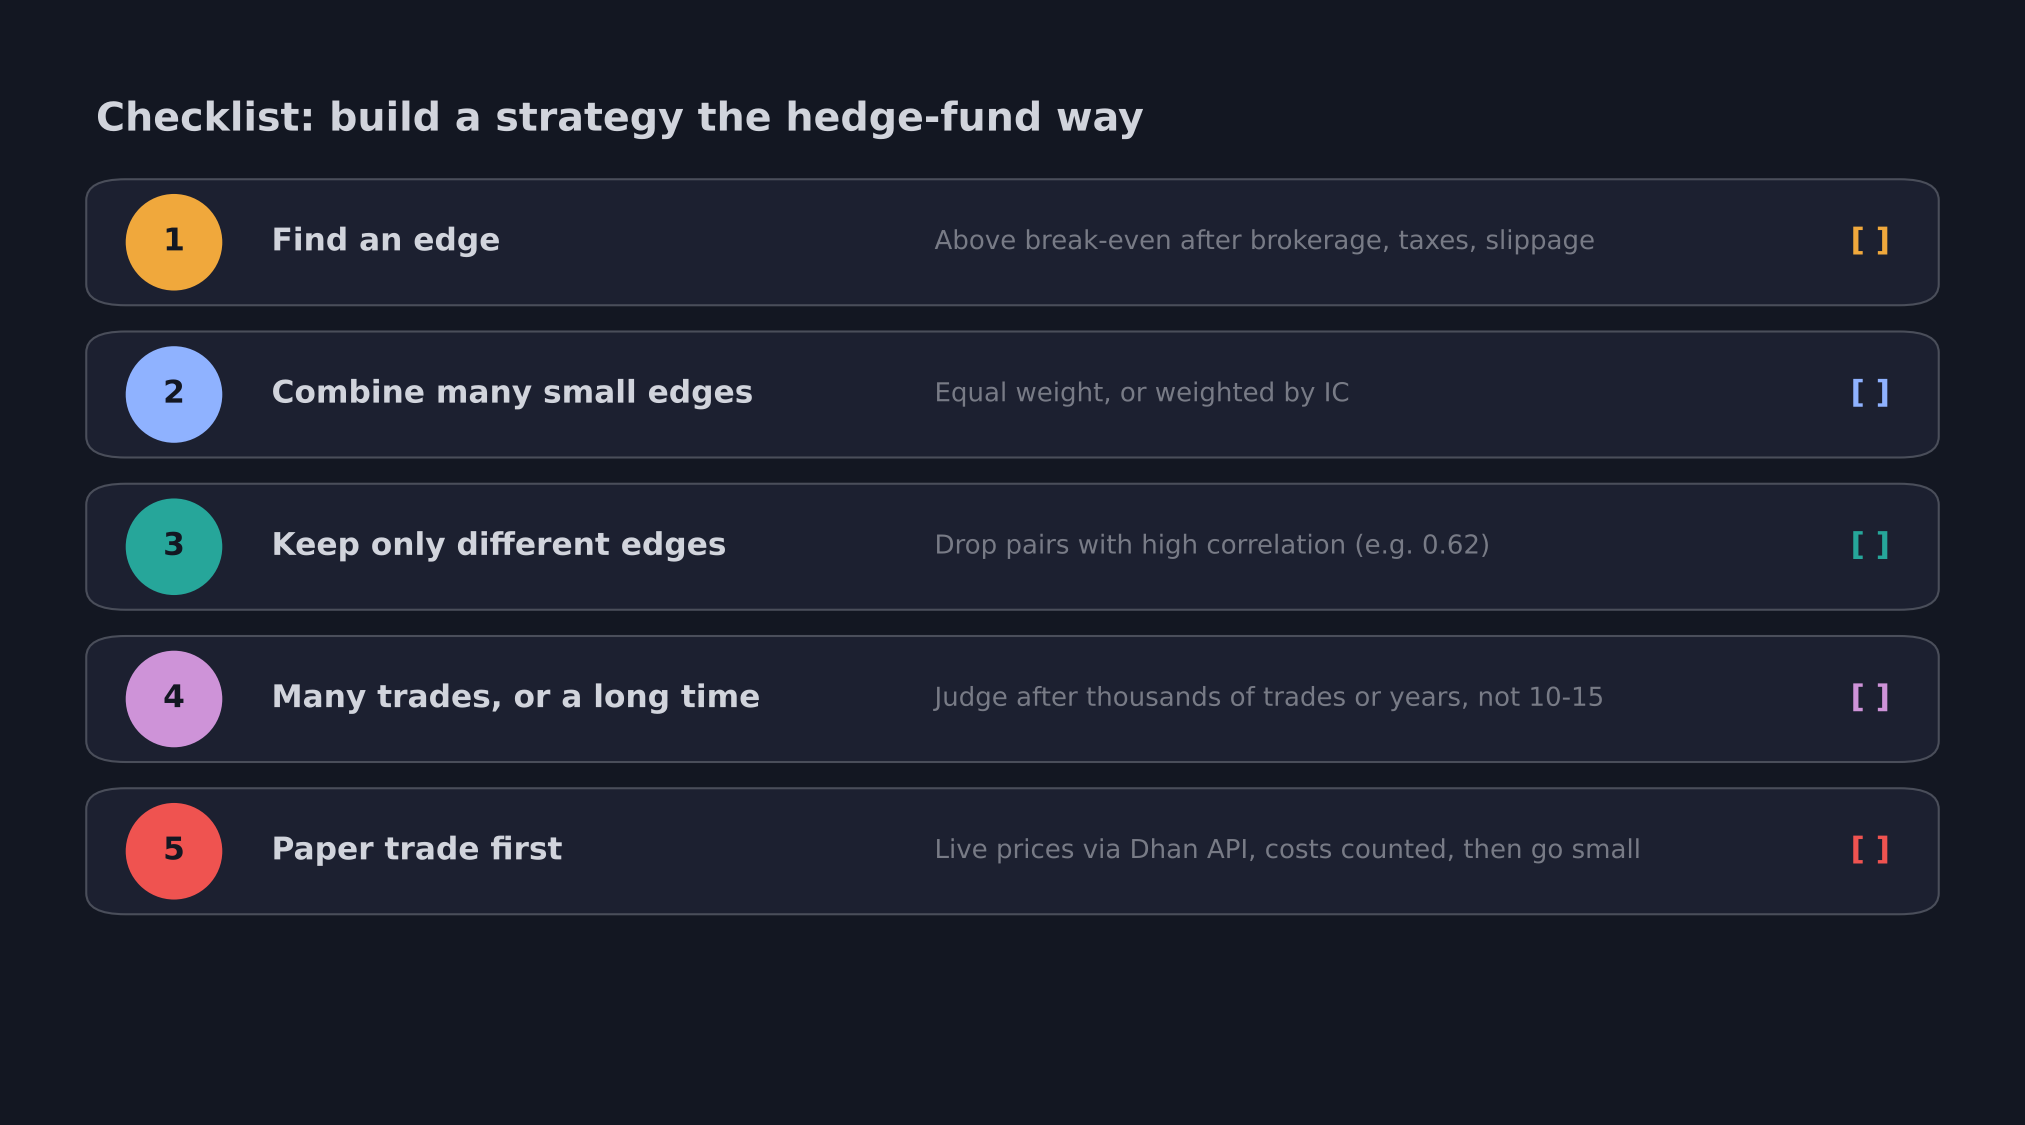
Figure 20: The five-step checklist.
| Step | What to do | Why |
|---|---|---|
| 1. Find an edge | Find logic that wins above break-even after brokerage, taxes and slippage | Every real edge is small, so it must survive costs |
| 2. Combine many edges | Add small edges, with equal weight or weighted by IC | One small edge cannot beat the market |
| 3. Keep them different | Drop edges that say the same thing (for example, momentum and trend at 0.62) | Uncorrelated edges give a smoother, stronger result |
| 4. Many trades or a long time | Judge after thousands of trades or years, not 10 to 15 trades | The law of large numbers makes the edge show |
| 5. Paper trade first | Use live prices from the Dhan API, count brokerage and slippage, then go live small | Edge minus brokerage minus slippage must be above zero |
Hedge funds keep their strategies secret, but their method is open. Find small edges, combine the different ones, give them enough trades or time, and prove them on paper with every cost counted before you risk real money.
Disclaimer: This article is for education only. It is not investment advice or a recommendation. Charts are simulations and illustrations, not promises of returns. Past results do not guarantee future results. Investments in securities markets are subject to market risks; read all related documents carefully before investing.
Resources
- YouTube Video: How Hedge Funds Make Their Trading Strategy
- Research paper: 101 Formulaic Alphas, Zura Kakushadze (arXiv:1601.00991)
- Dhan API documentation: DhanHQ API