Hi @Everyone,
Choosing the right stocks is half the battle in intraday trading. You can have a flawless entry and exit strategy, but if the stock you picked barely moves, there is no trade to make. This article breaks down a simple, algo-driven method — built on a concept called volatility clustering — to automatically shortlist stocks that are statistically likely to keep moving, so you spend your energy trading, not guessing.
Table of Contents
1. The Core Problem With Intraday Stock Selection
2. What Is Volatility Clustering?
3. Direction vs. Volatility: Two Different Things
4. Why Breakout Trades Fail in Sideways Markets
5. The Formula: Volatility Strength
6. Building the Intraday Stock Selection Algo
7. Real Scanner Output — Reading the Results
8. How to Use This Algo in Your Trading
9. Key Takeaways
10. Resources
The Core Problem With Intraday Stock Selection
When you’re trading intraday, the single most important filter isn’t direction — it’s movement. It doesn’t matter how good your setup looks on the chart if the stock refuses to move once you’re in the trade.
That’s the entire objective behind stock selection for intraday: pick stocks where meaningful movement is likely to continue, and skip the ones that are just going to sit still and eat away at your time and capital.
The question is — how do you know, in advance, which stocks are about to move? This is where volatility clustering comes in.
What Is Volatility Clustering?
Volatility clustering is a well-documented market behavior that can be summarized in one line:
A sideways market tends to produce more sideways market. A volatile (trending) market tends to produce more volatility.
In other words, momentum — in the statistical sense — has a short memory that persists. If the last two hours were calm, the next two hours are likely to stay calm too. If the last two hours saw a sharp, wide-ranging move, the next two hours are statistically more likely to continue that wide-ranging behavior.
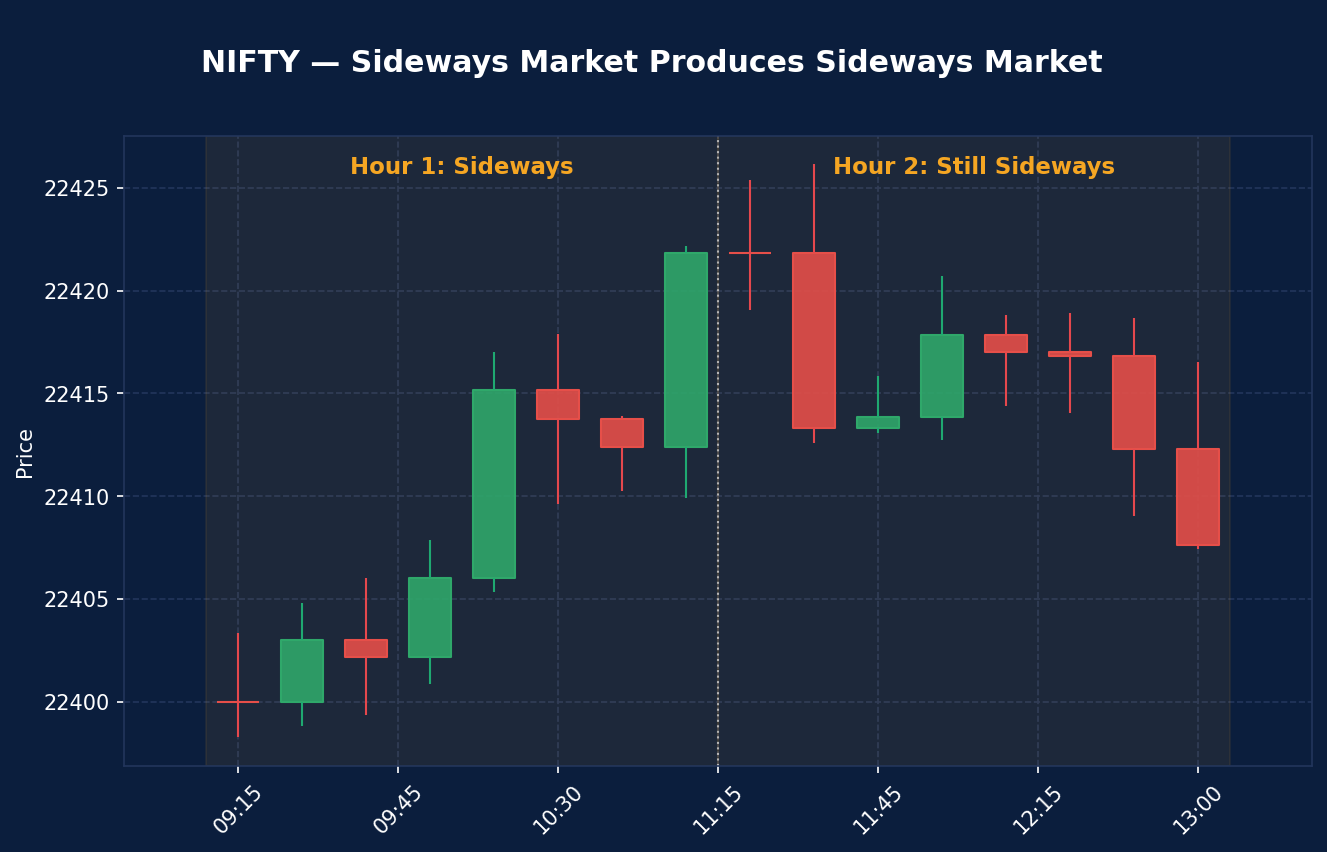
Sideways markets tend to produce more sideways markets — Hour 2 mirrors the calm, range-bound behavior of Hour 1.
Compare that to a market that already showed real movement:
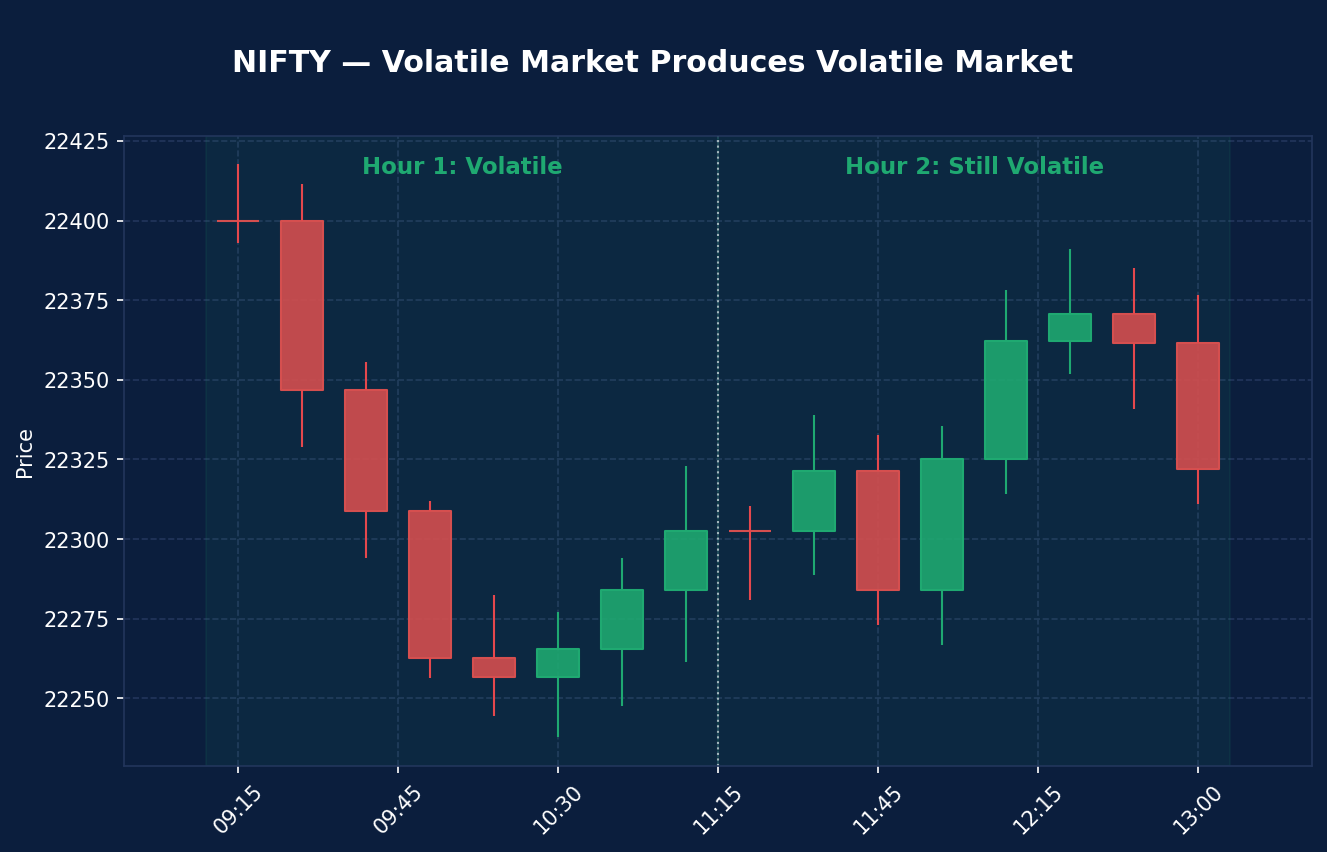
Volatile markets tend to produce more volatility — the wide range from Hour 1 carries into Hour 2.
Tip: This isn’t a prediction of direction — it’s a prediction of magnitude. Volatility clustering tells you a stock is likely to keep moving; it doesn’t tell you whether it will move up or down. You still need a breakout structure or trend signal to decide direction.
Direction vs. Volatility: Two Different Things
It’s easy to conflate “the market is moving” with “I know where it’s going,” but these are two separate dimensions of price action:
| Concept | What It Tells You | Example |
|---|---|---|
| Direction | Whether price is generally moving up or down | An uptrending stock making higher highs |
| Volatility | How wide the range of movement is, regardless of direction | A stock swinging 3% in either direction within an hour |
When a market is genuinely volatile, direction becomes easy to read — the trend is visually obvious, and price commits to a path. But in a quiet, sideways market, traders often try to force a directional read anyway: drawing a support line here, a resistance line there, and waiting for a “breakout.”
The problem is that in a low-volatility, range-bound stock, this produces breakout after breakout that instantly fails — because there was never enough underlying momentum to sustain a real move in the first place.
Why Breakout Trades Fail in Sideways Markets
If you’ve ever taken a breakout trade only to watch price snap back into the range within minutes, you’ve experienced this firsthand. Range-bound stocks generate a constant stream of false breakouts — price pokes above resistance or below support, triggers your entry, and then reverses because there was no real conviction behind the move.
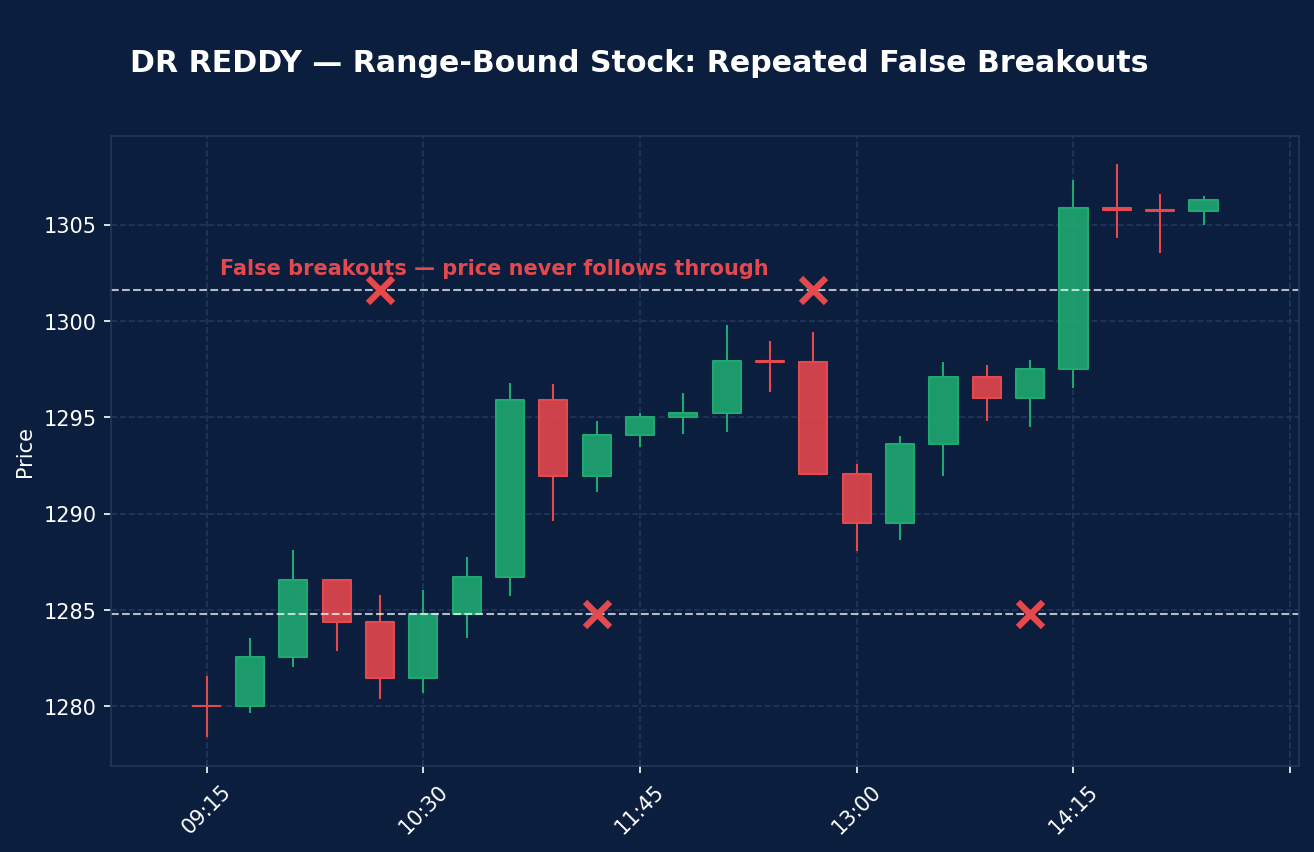
A textbook range-bound stock — every attempted breakout above or below the range fails to follow through, generating repeated false signals.
Warning: Trading breakouts on a stock that hasn’t shown any real movement in the last couple of hours is one of the most common ways intraday traders bleed capital through false entries. The setup can look technically valid on the chart while still being a statistically poor bet.
This is exactly why volatility clustering matters for stock selection, before you even get to your entry strategy. If a stock’s recent range has been tight, don’t fight it — filter it out and move to a stock that has already proven it can move.
The Formula: Volatility Strength
To turn “volatility clustering” from a concept into something you can actually screen for, the algo uses a simple ratio built around ATR (Average True Range).
ATR tells you the expected range a stock typically moves within a given period. If a stock’s ATR is 24 points, you can roughly expect it to travel about 24 points from its reference price over that period — this is your baseline expectation.
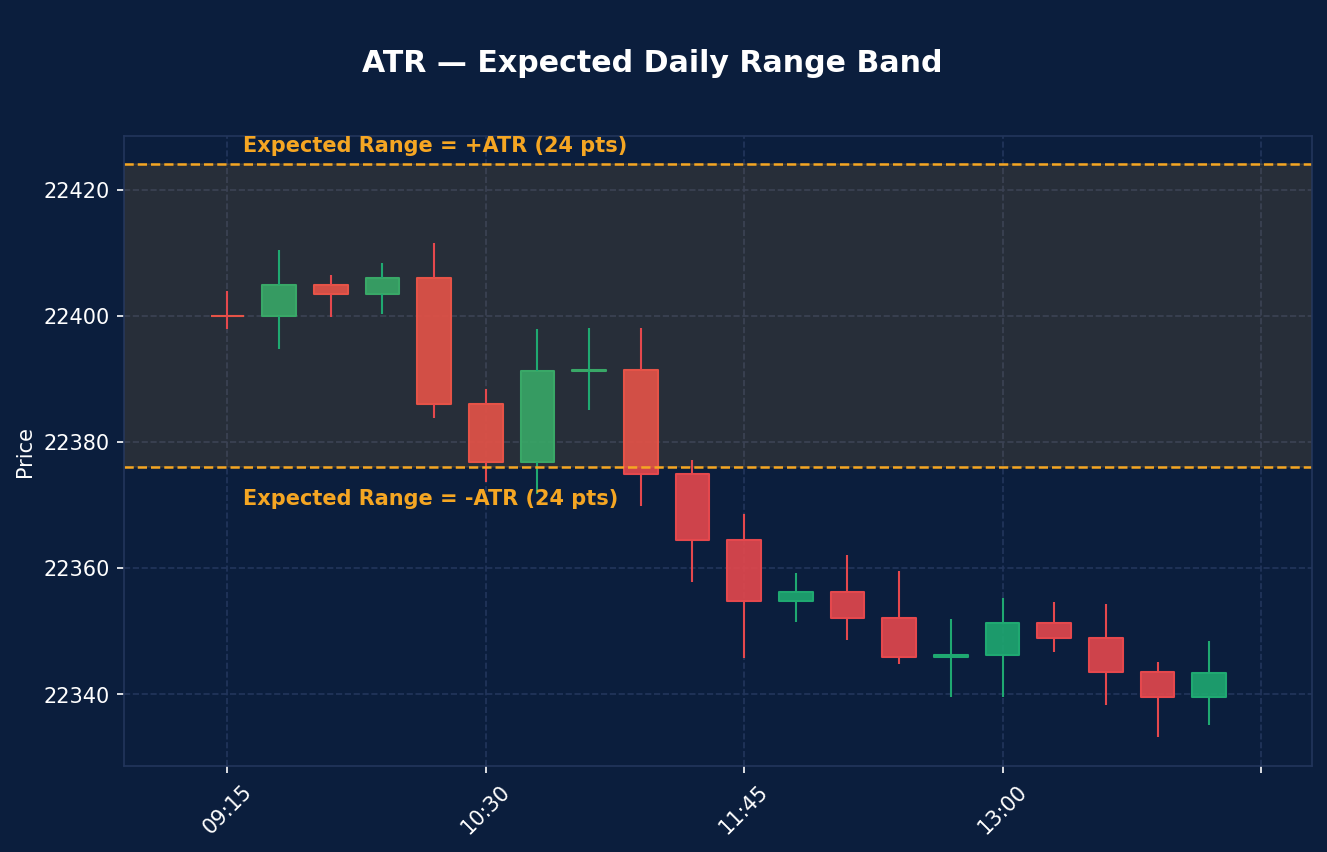
ATR defines the expected trading range — the shaded band shows how far price is statistically expected to travel.
The algo compares this baseline to what the stock actually did in the last two hours of the previous session:
Volatility Strength = (Last 2-Hour Price Movement) ÷ (ATR)
Here’s how to read the result:
| Volatility Strength | Interpretation |
|---|---|
| > 2.0x | Stock moved far more than its normal expected range — strong candidate for continued movement |
| ~1.0x | Stock moved roughly in line with its normal range — average candidate |
| < 1.0x | Stock moved far less than expected — likely to stay quiet, best avoided for momentum trades |
Worked example:
- NIFTY’s last 2-hour move = 48 points
- NIFTY’s ATR = 24 points
- Volatility Strength = 48 ÷ 24 = 2.0x → quite volatile, strong candidate
Now compare that to a quiet session:
- Last 2-hour move = 12 points
- ATR = 24 points
- Volatility Strength = 12 ÷ 24 = 0.5x → the stock isn’t moving anywhere near its usual range — skip it
Note: The “last 2 hours” window used here is 2:00 PM to 3:30 PM (the second half of the trading session). This is a design choice in the demonstrated algo — you can adjust the window depending on when you plan to trade the next day (e.g., using the 10:30 AM–11:00 AM window if you’re selecting stocks mid-morning).
Building the Intraday Stock Selection Algo
Here’s the exact workflow used to build this scanner end-to-end, connecting Dhan’s API with Excel for output.
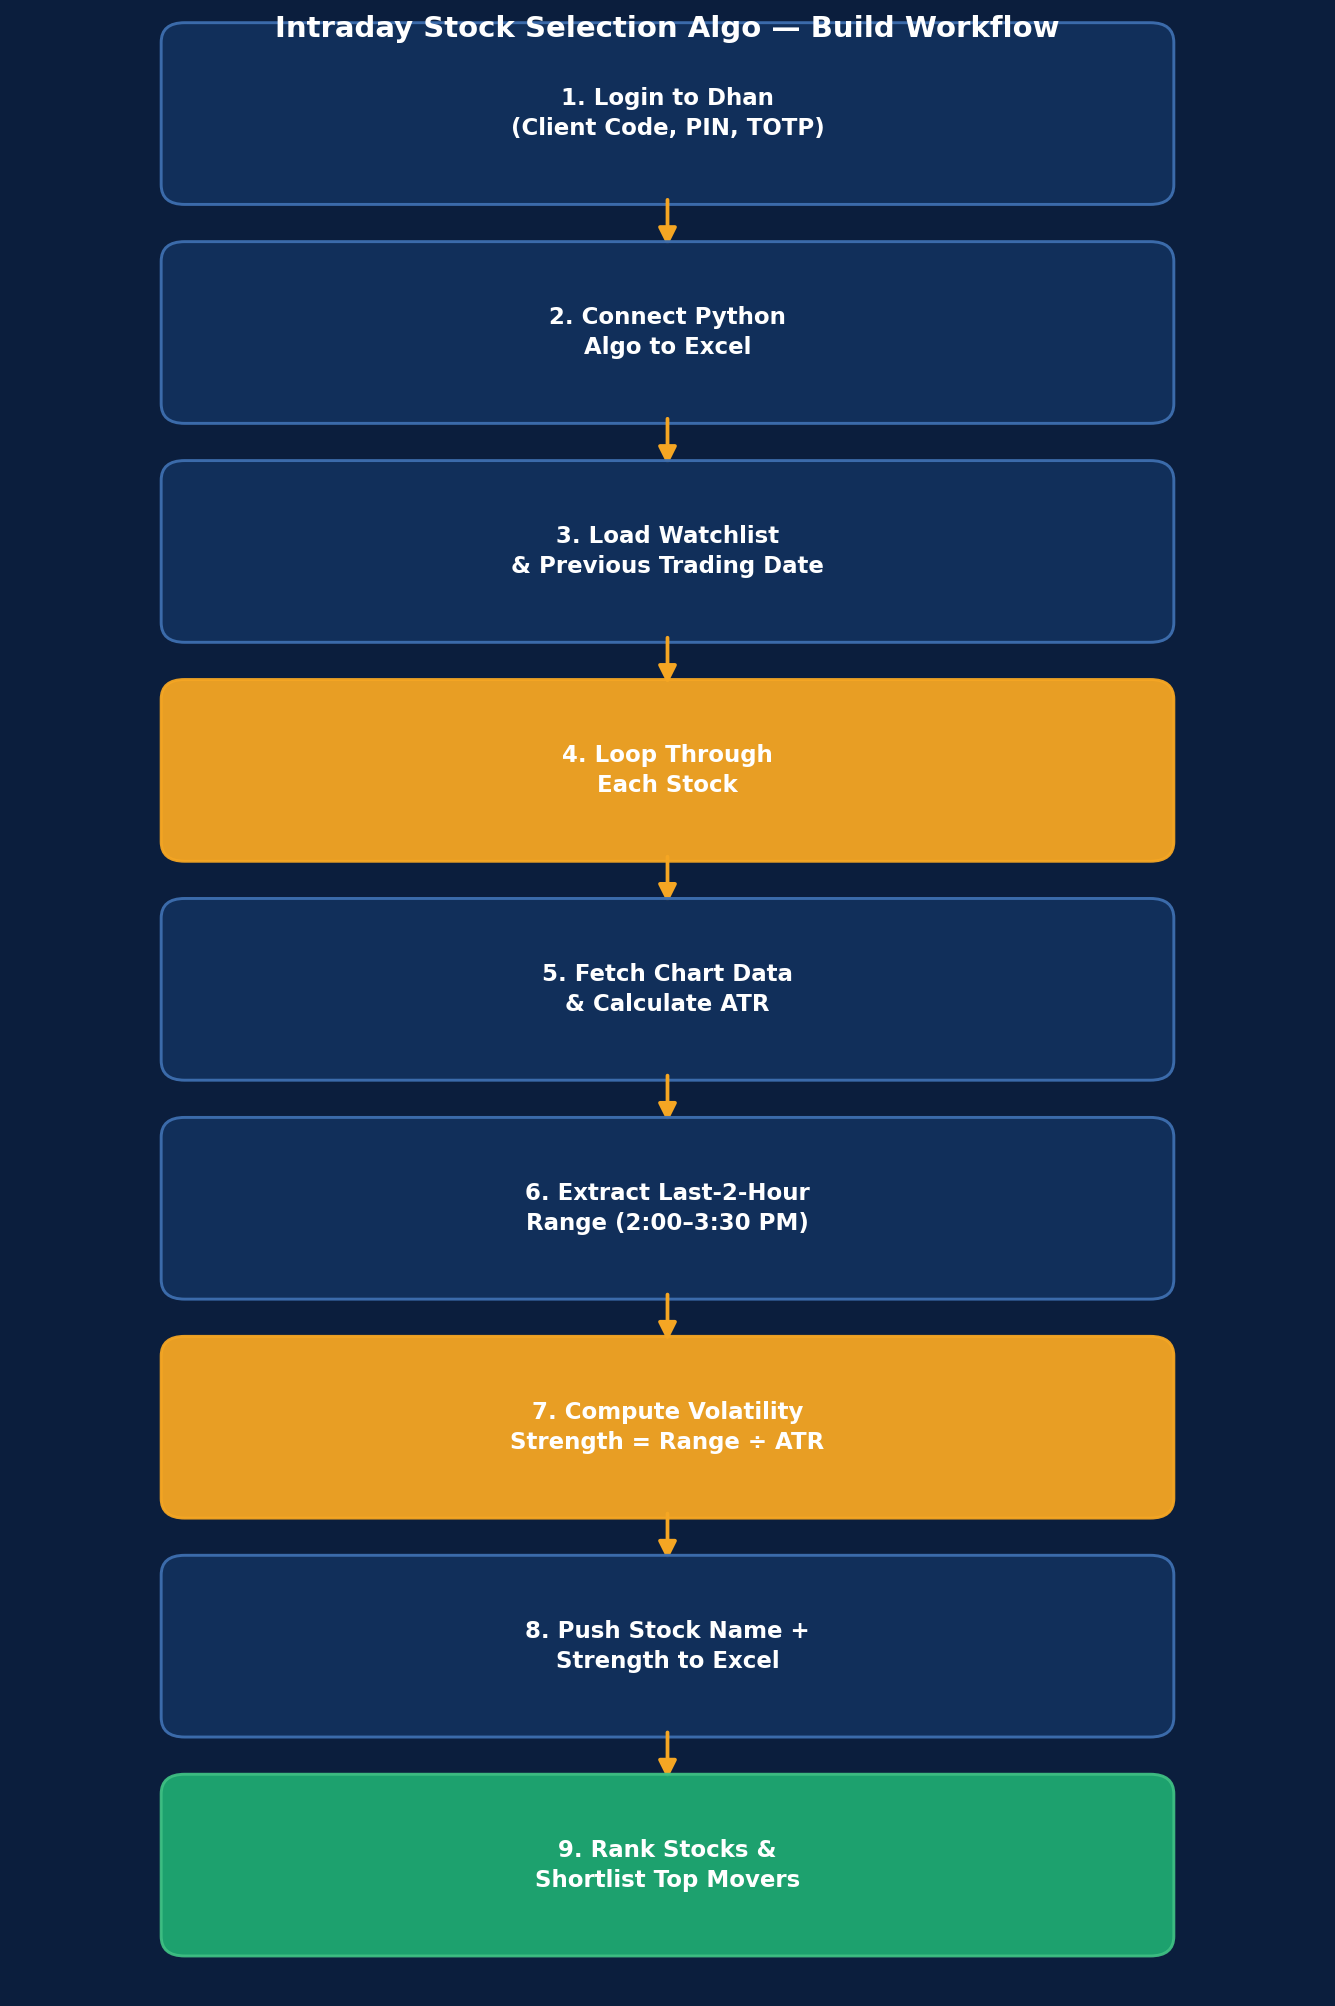
The complete build workflow, from authentication to a ranked, exportable watchlist.
Step 1: Login to Dhan
The algo authenticates using your Dhan Client Code, PIN, and TOTP. This is what allows the script to pull live and historical chart data programmatically.
Step 2: Connect the Algo to Excel
The script is wired up to push its output directly into an Excel sheet. This makes the scanner’s results easy to read, sort, and share — no need to dig through a terminal or notebook output.
Step 3: Load the Watchlist and Reference Date
You feed the algo your watchlist of stocks to scan. It also pulls the previous trading date (for example, if today is being planned for, it references the prior session’s data) since the calculation is based on what already happened, not live intraday data.
Step 4: Loop Through Each Stock
The algo runs through the watchlist one stock at a time — first ICICI Bank, then Trent, then Bharti Airtel, and so on — repeating the same calculation for every symbol.
Step 5: Fetch the Chart and Calculate ATR
For each stock, the algo pulls historical price data and calculates the ATR, which becomes the “expected movement” baseline for that stock.
Step 6: Extract the Last 2-Hour Range
The algo isolates the second half of the previous session — 2:00 PM to 3:30 PM — and calculates exactly how many points the stock moved during that window.
Step 7: Compute Volatility Strength
Using the formula from the previous section, the algo divides the last-2-hour move by the ATR to produce a single number — the Volatility Strength — for that stock.
Step 8: Push Results to Excel
For every stock, the algo writes two values into the spreadsheet:
- Column A: Stock name
- Column B: Volatility Strength
Step 9: Rank and Shortlist
Once every stock in the watchlist has been scanned, you’re left with a ranked list — sort by Column B, and the stocks at the top are your highest-probability candidates for continued movement the next session.
# Simplified pseudocode of the core logic
for stock in watchlist:
    chart = fetch_chart_data(stock, previous_date)
    atr = calculate_atr(chart)
    last_2hr_range = calculate_range(chart, start="14:00", end="15:30")
    volatility_strength = last_2hr_range / atr
    write_to_excel(stock, volatility_strength)
Full working source code for this scanner is available in the code files link under Resources.
Real Scanner Output — Reading the Results
When this algo was run on a real watchlist, here’s what came back:
| Stock | Volatility Strength | Verdict |
|---|---|---|
| Maruti | 4.66x | Extremely volatile — strong candidate |
| ICICI Bank | 2.60x | Volatile — strong candidate |
| Dr. Reddy | ~0.4x (not volatile) | Range-bound — avoid |
| NSE India | ~0.3x (not volatile at all) | Range-bound — avoid |
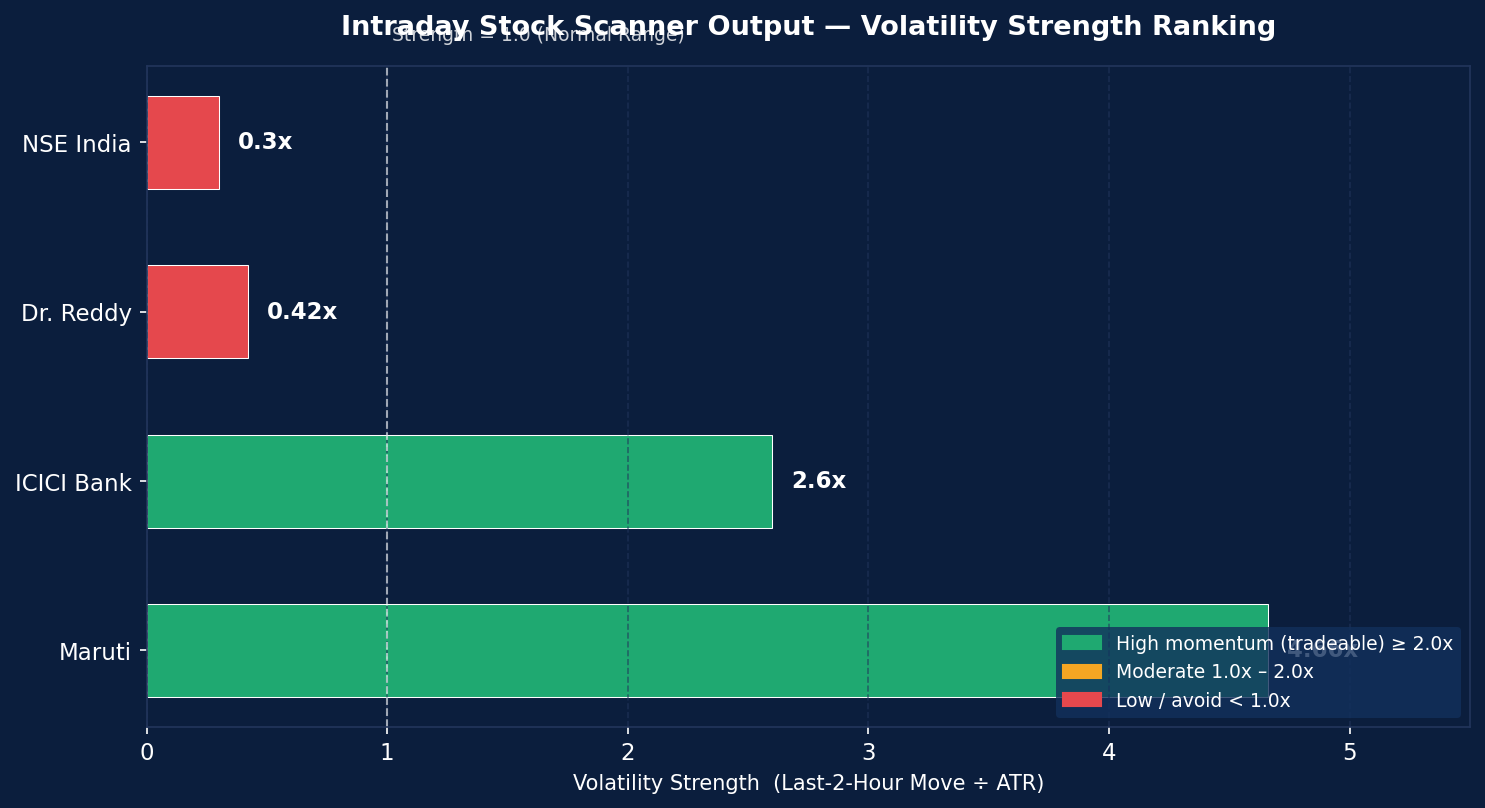
Scanner output ranked by Volatility Strength — the higher the bar, the stronger the case for continued movement.
Maruti is the standout example here. At the time this scan was run, Maruti had already moved roughly 3% in the last two hours of the session — a large move relative to its normal range. True to the volatility clustering principle, the very next session saw Maruti rise nearly 5%. The stock that had already proven it could move, kept moving.
Dr. Reddy, on the other hand, showed almost no volatility in its last two hours. Checking the chart confirmed it — price kept poking above and below a tight range without committing to a direction, and the following session played out the same way: more range-bound, directionless movement.
Quote from the walkthrough: “Volatile market will bring more volatile markets for you.”
Full Live Scanner Output
Here’s the algo run live against a full 50-stock watchlist, with the Volatility Strength written directly into Excel by the script (Column A: stock, Column B: strength):
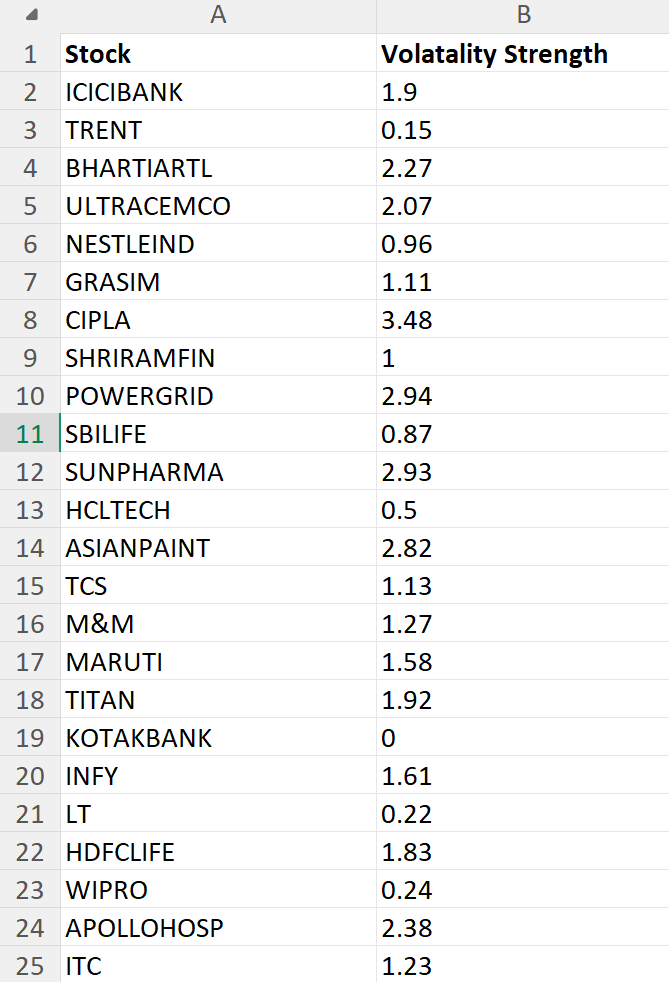
Live scanner output, part 1 — stocks and their computed Volatility Strength, written directly to Excel by the algo.
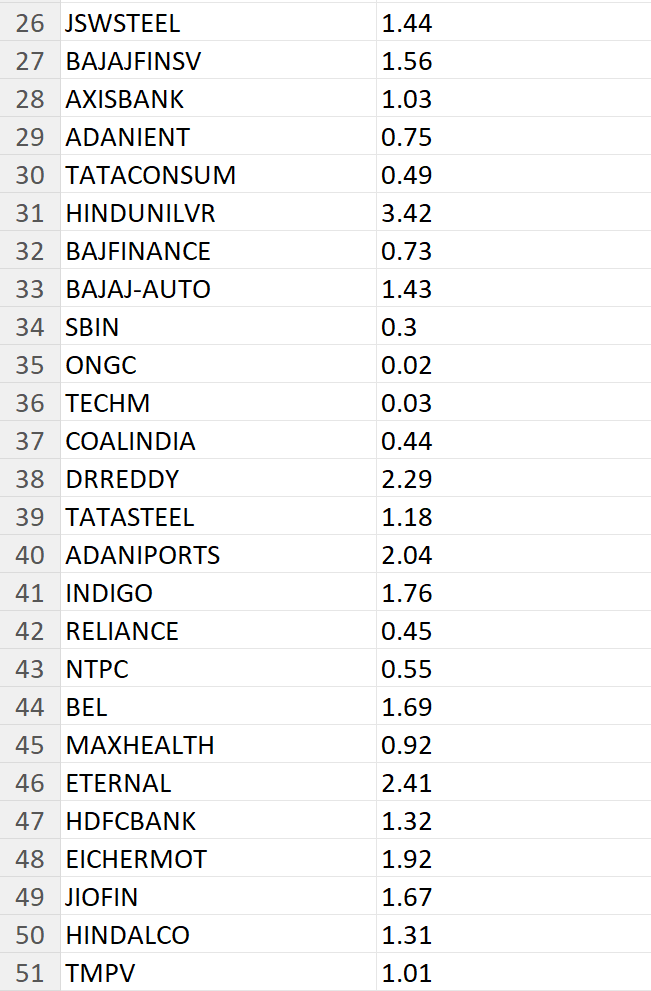
Live scanner output, part 2 — the remainder of the watchlist, ranked the same way.
Pulling the top performers out of this run gives a clear picture of where the momentum was concentrated that session:
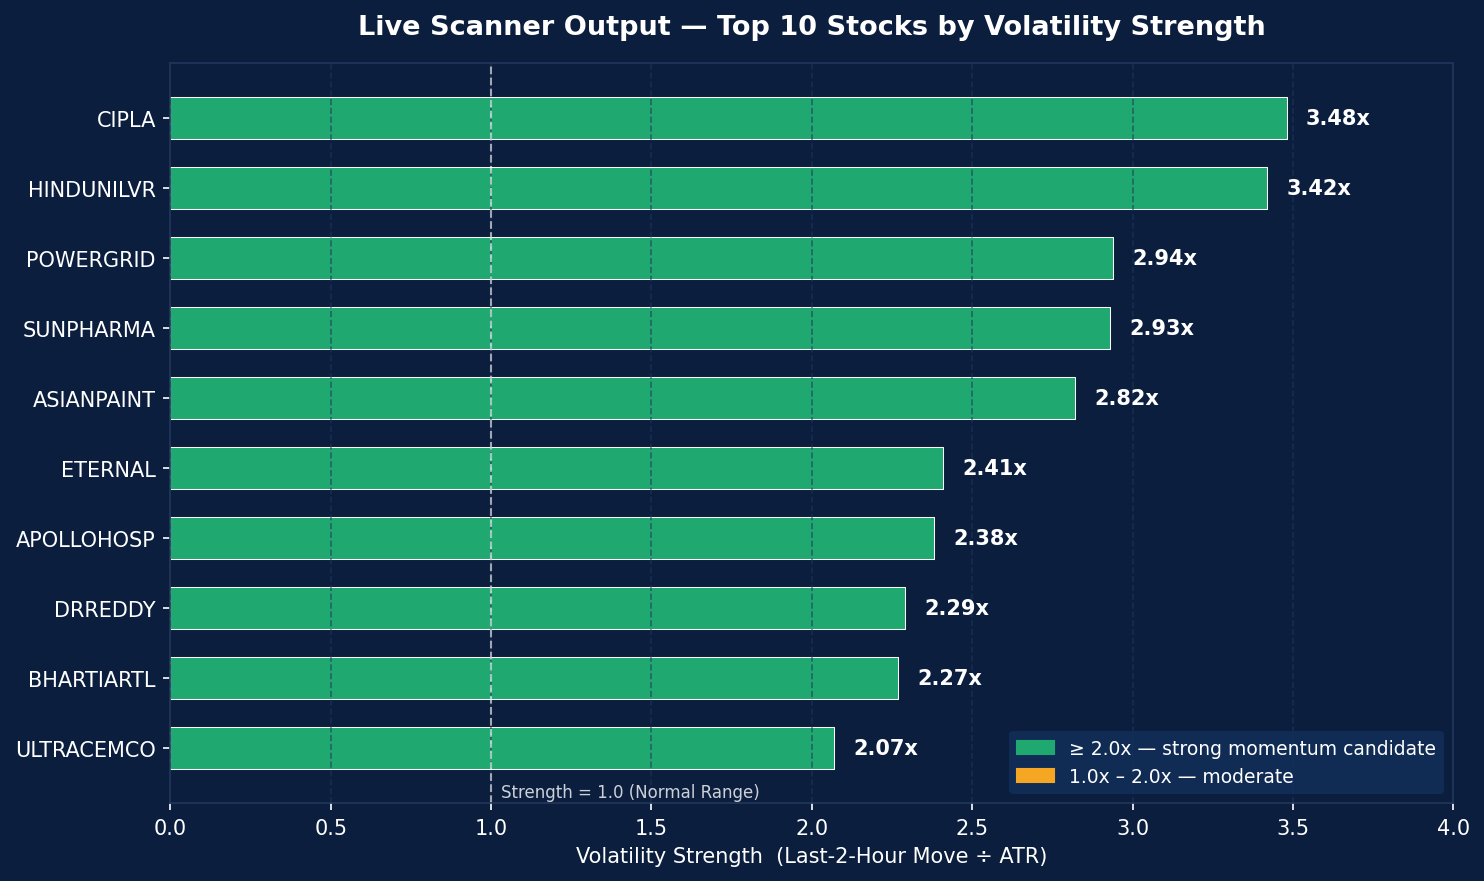
Top 10 stocks from the live run, ranked by Volatility Strength — CIPLA (3.48x) and HINDUNILVR (3.42x) led the watchlist.
How to Use This Algo in Your Trading
This scanner isn’t a complete trading strategy on its own — it’s a filter. Here’s how it fits into a broader intraday process:
- Run the scanner at the end of the day (or at your preferred stock-selection time, e.g., mid-morning) across your full watchlist.
- Shortlist stocks with a Volatility Strength meaningfully above 1.0x — these are the names statistically more likely to keep moving.
- Judge direction separately, using your own breakout structure, trend indicators, or price action rules on the shortlisted names.
- Expect fewer false breakouts on these stocks — because they’ve already demonstrated real movement, breakout signals on them are inherently more reliable than on a stock that’s been sitting flat.
Key Takeaways
- Movement matters more than direction when selecting stocks for intraday trading — a stock that doesn’t move can’t be profitably traded, regardless of your setup.
- Volatility clustering is the underlying principle: sideways markets tend to stay sideways, and volatile markets tend to stay volatile.
- Direction and volatility are separate dimensions — this algo filters for volatility; you still need your own method to judge direction.
- Volatility Strength = Last 2-Hour Range ÷ ATR is the core formula — a value above roughly 2.0x flags a strong momentum candidate.
- Trading breakouts on genuinely volatile stocks produces fewer false signals than trading breakouts on range-bound stocks.
- The full scanner connects Dhan’s API for data and authentication with Excel for a clean, sortable output — built to loop through an entire watchlist automatically.
Have questions about building your own version of this scanner, or want to discuss variations of this algo? Head over to the Made for Trade community, sort the thread by replies, and post your questions there.
Resources
 YouTube Video: Watch the full walkthrough
 Code Files (Google Drive): Download the algo source files
Disclaimer: Investments in the securities market are subject to market risk. Read all related documents carefully before investing.