Most traders start their journey with moving averages like:
• Simple Moving Average (SMA)
• Exponential Moving Average (EMA)
They’re simple, widely used, and effective for identifying trends.
But they also have one common limitation: Lag.
That’s where the Hull Suite Indicator comes in.
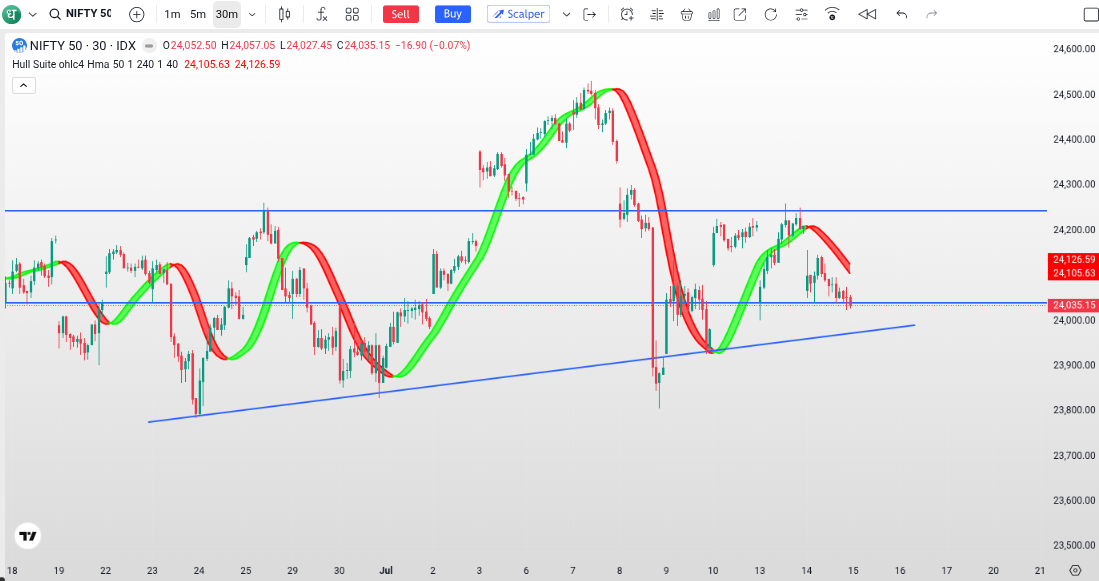
Built around the Hull Moving Average (HMA) developed by Alan Hull, the Hull Suite is designed to provide a faster response to price movements while filtering out much of the market noise that traditional moving averages often produce.
What Is Hull Suite?
Hull Suite is an enhanced visualisation of the Hull Moving Average.
Instead of displaying a single moving average line, it creates a dynamic trend ribbon that helps traders identify:
• Trend direction
• Momentum shifts
• Trend reversals
• Dynamic support and resistance
Many traders find it easier to interpret than using multiple moving averages on the same chart.
Why was the Hull Moving Average Created?
Traditional moving averages involve a trade-off.
SMA
 Smooth trends
 Slow to react
EMA
Faster response
More false signals during sideways markets
Hull Moving Average (HMA)
Alan Hull designed HMA to reduce lag while maintaining smoothness by using a mathematical combination of Weighted Moving Averages (WMA).
The result is a moving average that reacts faster to changing market conditions without becoming excessively noisy.
Hull Suite builds on this concept by making trend changes visually easier to identify.
What Makes Hull Suite Popular?
Unlike many indicators that focus only on crossovers, Hull Suite emphasizes:
Trend Direction
A rising ribbon may indicate strengthening bullish momentum.
A falling ribbon may indicate weakening momentum.
Trend Changes
Instead of waiting for multiple moving average crossovers, traders often watch for:
• Ribbon colour changes
• Change in slope
• Price reclaiming or breaking the ribbon
Dynamic Support & Resistance
During strong trends, the ribbon often acts as an area where traders observe whether price finds support or resistance before continuing.
Where Can It Be Used?
Hull Suite is commonly used across:
• Intraday Trading
• Swing Trading
• Positional Trading
• Stocks
• Indices
• Commodities
• ETFs
The concept remains the same across different markets and timeframes.
Hull Suite Isn’t A Standalone Strategy
One of the biggest misconceptions is treating Hull Suite as a buy/sell signal generator.
Experienced traders often combine it with:
• Market Structure
• Opening Range Breakout (ORB)
• Price Action
• Volume Analysis
• Support & Resistance
• VWAP
The ribbon provides trend context.
Price action helps determine execution.
Why Many Traders Prefer It
Some of the reasons traders use Hull Suite include:
• Faster than SMA
• Smoother than short-period EMA
• Helps visualize trend direction clearly
• Easier to identify trend transitions
• Useful across multiple timeframes
Like any technical indicator, it works best as part of a broader trading plan rather than in isolation.
Now Available On Dhan Charts
Hull Suite & HMA is now available on Dhan Charts. We also did a Strategy video on our DhanHQ YouTube channel.
Whether you trade stocks, indices, or commodities, you can now add Hull Suite directly to your charts and customize it according to your preferred timeframe and trading style.
Let’s Discuss
• Have you used Hull Suite before?
• Which moving average do you rely on the most: SMA, EMA, VWMA, or HMA?
• Do you use moving averages for entries, exits, or trend confirmation?
• If you could combine Hull Suite with one other indicator, which would you choose?
It would be interesting to know how different traders incorporate moving averages into their trading workflow.
Disclaimer:
This post is intended for educational and discussion purposes only. Hull Suite and other technical indicators are analytical tools and should not be used as the sole basis for trading or investment decisions.