Go to the trading view charts - Then go the the indicators and place LUX ALGO - SMART MONEY CONCEPTS !
Backtest it for month atleast !
And start seeing good results in trading ! Happy trading !
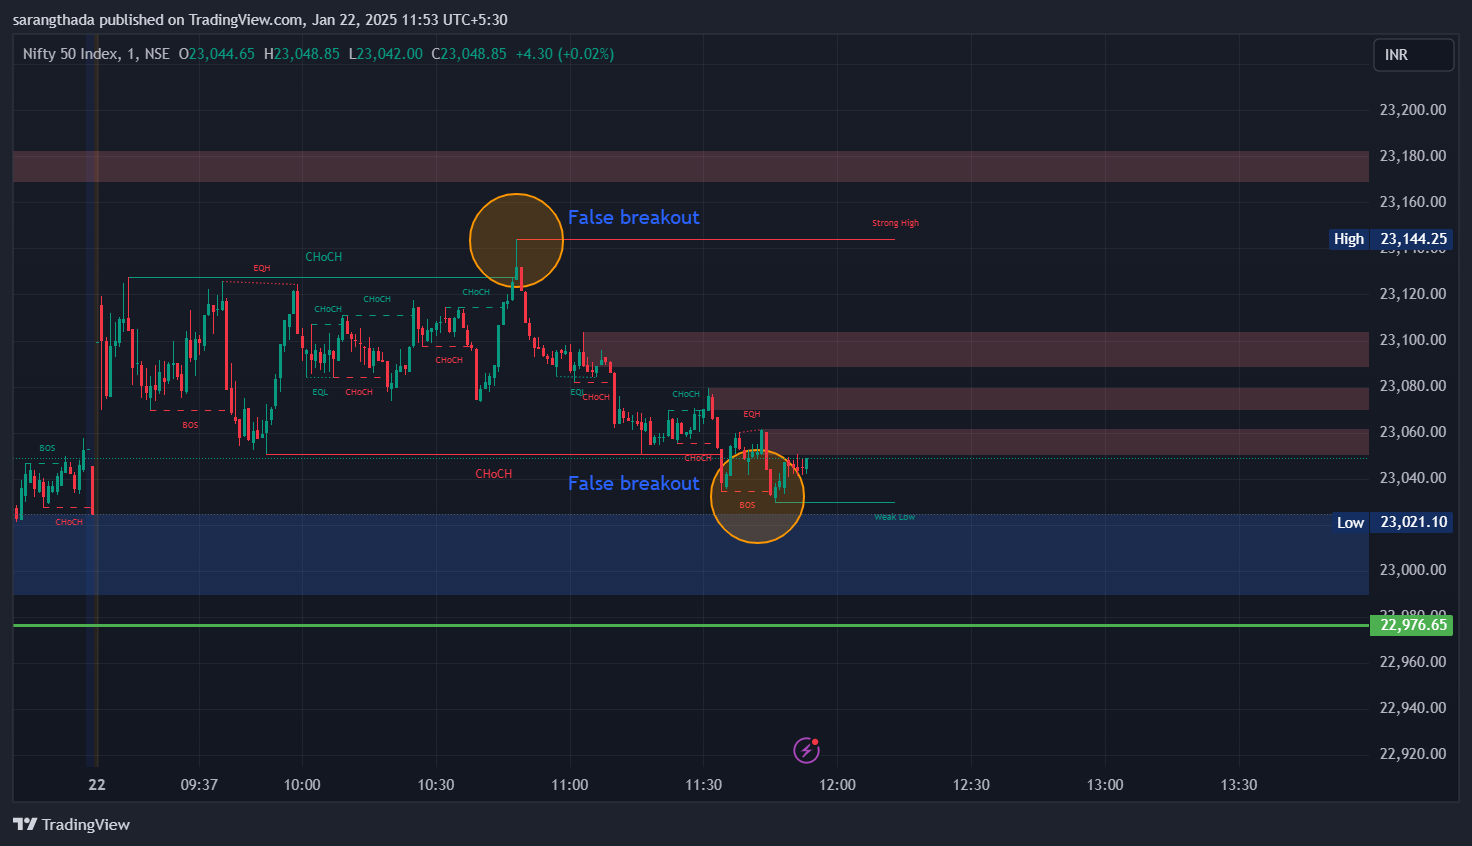
For reference, below is the image !
Go to the trading view charts - Then go the the indicators and place LUX ALGO - SMART MONEY CONCEPTS !
Backtest it for month atleast !
And start seeing good results in trading ! Happy trading !
For reference, below is the image !
I appreciate you sharing this.
It looks like this LUX ALGO publisher has a lot of indicators available.
As I went through the notes, I saw a mention of fair value gap. I remember reading a discussion on the forum a few days ago where someone recommended this indicator for use on the Dhan platform. Maybe they got their lead from these indicators.
I’m really impressed with how quickly all their published indicators computes and loads on the chart, especially compared to some similar ones I’ve used before.
I am trying out the one you mentioned, and it seems quite interesting.
How long have you been using it? What are the key takeaways when using this indicator on our nifty50 futures chart?
Hie ! Good to hear you have found this one !
I am using it since 1.5year and it gives me good results in terms of option buying and scalping tough !
but i would suggest ,Start analysis from higher timeframe to understand range then lower timeframe to trade and you should backtest the algo for atleast month, just to understand the dynamics of system !
It’s superb to use !
Thank you !
Thanks for the insights!
On a different note, I wanted to check with you, if during your exploration of different indicators, have you come across any similar indicators related to analyzing volume for illiquid stocks.
For instance, some small-cap stocks keep hitting upper circuit limits with no volume, after a few days, some liquidity might show up. In some cases, these stocks can remain at upper circuits for a few weeks, while others that gain volume may hit the upper circuit again on the same day, only to drop into lower circuits the next day.
There’s volume that helps maintain a trend and volume that can change it for illiquid stocks.
I’m trying to understand if there are any indicators that could simplify the analysis for these situations.
With upper circuit stocks, I’m struggling to differentiate between good volume and bad volume.
No idea !
But if i got something and relatable to the query.
will definitely share with you !
PS - Be safe and alert while driving the Illiquid stock !
Thanks !
Hey @sarang_thada
Could you please elaborate more in this which TF you are using for option buying and scalping ?
as per my observation S/R are many times broken in lower TF live market.
Hi, Use it in higher timeframe like 15min to 1hr, then mark the liquidity and order block areas on chart !
and do trade smartly with EMA’s help !
Yesterday, I took a quick look at the Fair Value Gap feature inside this indicator.
It actually seems like a pretty interesting tool. I saw that when the nifty50 made a comeback from its lows, the key support areas during the pullbacks lined up with the fair value gaps on the 1-minute chart.
I also checked out a few smaller stocks on the daily chart, and some of them are currently sitting on fair value gaps from a few months ago. It’s fascinating stuff.
I really hope users can share more useful insights like this.