Hello team,
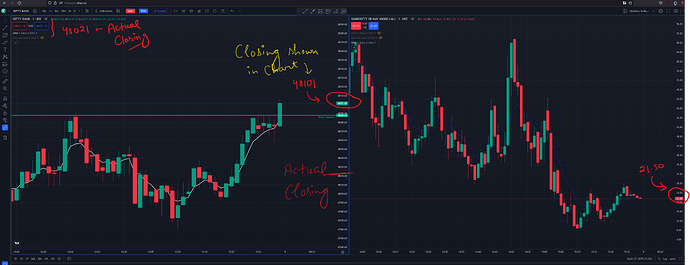
Just look at this chart (BANK NIFTY) during the time 3:15 to 3:30
Left:
Index : BANK NIFTY
Time Frame : 1 min
Right:
8 May 48000 Call (Expiry Day)
Time Frame : 1min
- During the last 5 minutes, the BANK NIFTY index chart is in the range 48070-48090 (if this is the real range the Call premium would have been 70-90 Rs as well, which was not the case. The premium was moving around 20 to 22 )
- Also just look at the close price on Index chart it is 48101, but the Actual Closing price of Index is 48021. Premium chart also confirms the closing price of 48021 (because premium is 21 for 48000 CE)
Can someone explain why is there so much difference in the chart data and the actual closing price in the Index ??
- This is a problem for someone who trades by looking at the chart. Because the chart is telling me that Call premium should be around 80 Rs during the last 5 min, while it was just 20Rs. So a trader will try to benefit from this divergence (Why 80 Rs ? because the market is at 48080)
- But what will happen at the end of market is, he will realise : “oh shit, the premium chart was actually correct and the information on index chart is wrong”
