India’s equity derivatives market is beginning to look different.
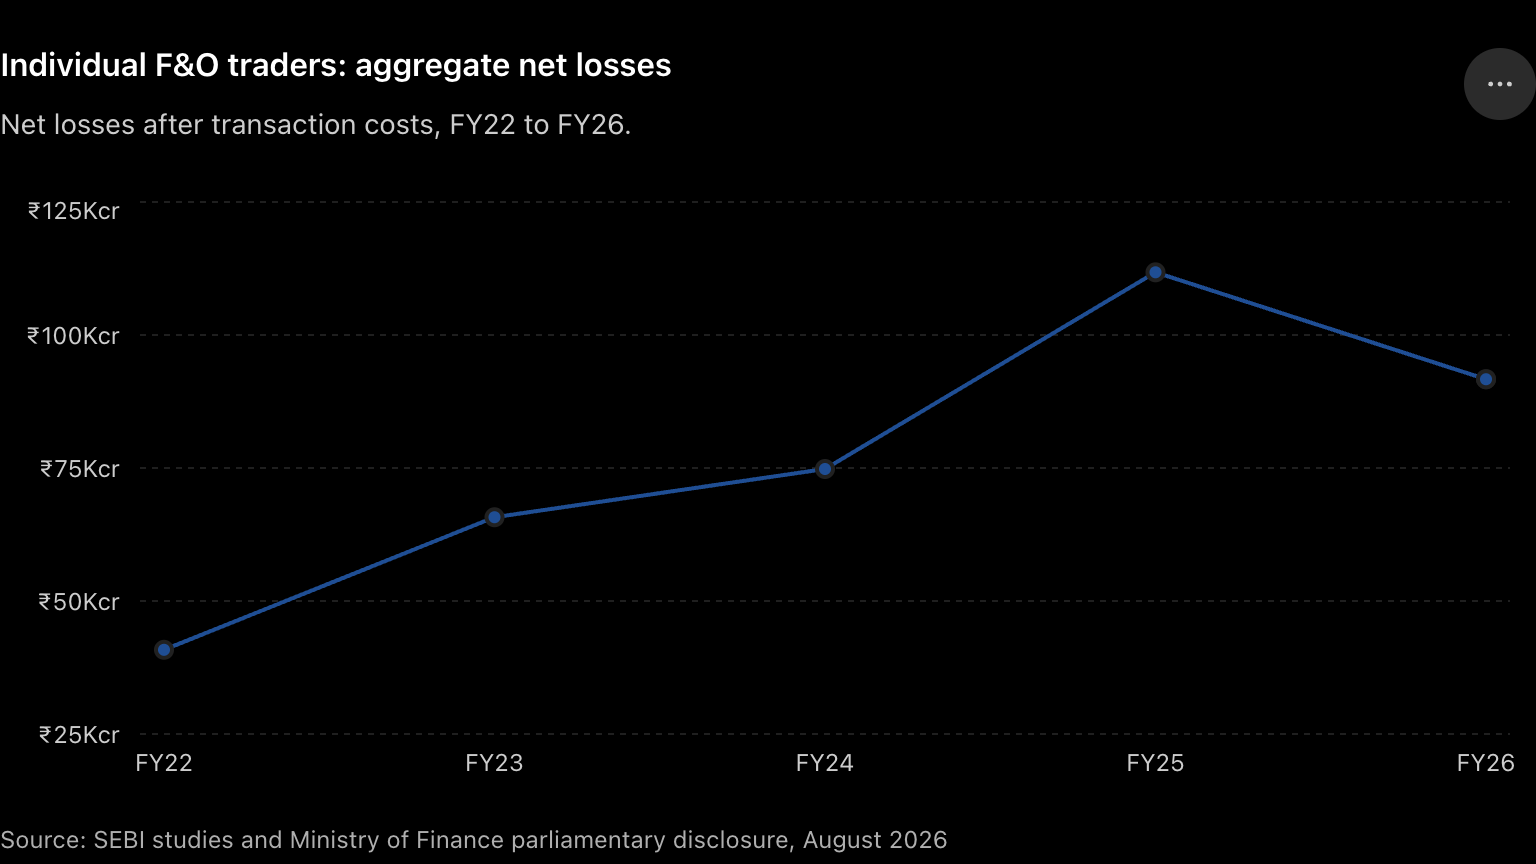
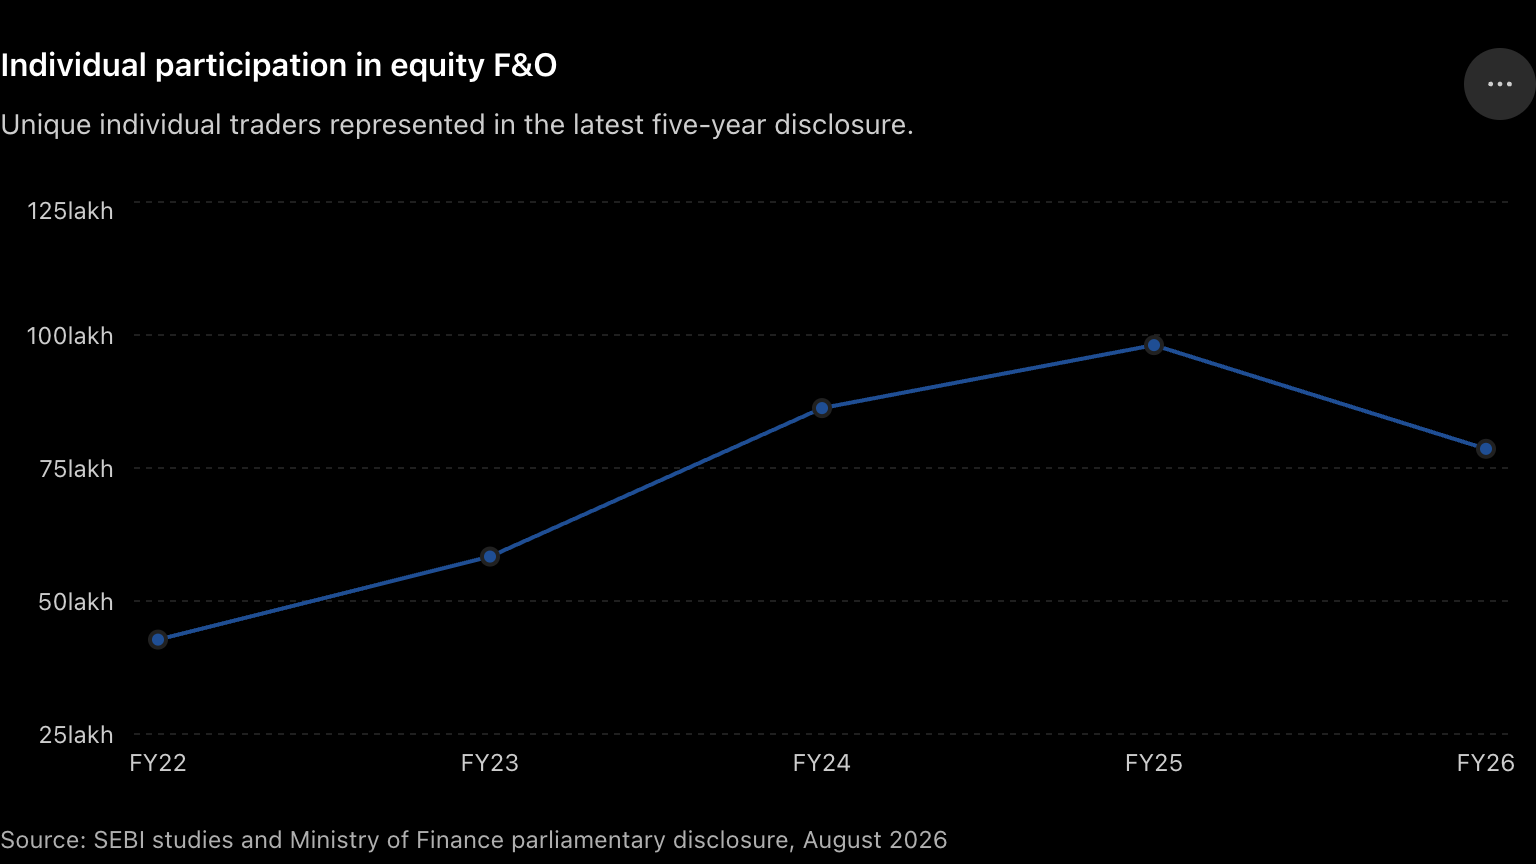
The latest data placed before Parliament shows that the number of individual traders participating in equity futures and options fell from 98.10 lakh in FY25 to 78.60 lakh in FY26. Aggregate net losses also declined, from ₹1,11,788 crore to ₹91,685 crore.
At first glance, this appears to be exactly what regulators intended.
But one number complicates that interpretation.
The average loss per individual trader increased from ₹1,13,913 in FY25 to ₹1,16,654 in FY26.
In other words, fewer individuals traded F&O and the group collectively lost less money, but the average outcome of the trader who remained in the market did not improve.
That distinction is perhaps the most important takeaway from the latest data.
Five years of retail F&O participation
According to the latest figures disclosed by the Ministry of Finance, based on SEBI’s analysis, the evolution of individual participation in equity derivatives looks like this:
| Financial Year | Individual Traders | Turnover | Aggregate Net Loss | Average Loss per Trader |
|---|---|---|---|---|
| FY22 | 42.74 lakh | ₹115 lakh crore | ₹40,824 crore | ₹95,517 |
| FY23 | 58.35 lakh | ₹149 lakh crore | ₹65,747 crore | ₹1,12,677 |
| FY24 | 86.26 lakh | ₹172 lakh crore | ₹74,812 crore | ₹86,728 |
| FY25 | 98.10 lakh | ₹213 lakh crore | ₹1,11,788 crore | ₹1,13,913 |
| FY26 | 78.60 lakh | ₹202 lakh crore | ₹91,685 crore | ₹1,16,654 |
The latest analysis uses data collected from the top 15 brokers in the equity derivatives market, representing approximately 90% of individual investors in the segment. The reported turnover combines notional turnover for futures and premium turnover for options.
[Chart 1: Aggregate losses of individual F&O traders, FY22 to FY26]
The five-year trend is important because FY26 should not be looked at only against the extraordinary peak reached in FY25.
Individual participation increased from 42.74 lakh traders in FY22 to 98.10 lakh in FY25, an increase of roughly 129% in three years. FY26 represents the first substantial reversal of that expansion.
Yet even after the decline, India still had approximately 78.6 lakh individual F&O participants, almost 84% more than in FY22.
What actually changed between FY25 and FY26?
The year-on-year numbers tell a more nuanced story.
| Indicator | FY25 | FY26 | Change |
|---|---|---|---|
| Individual F&O traders | 98.10 lakh | 78.60 lakh | -19.9% |
| Turnover | ₹213 lakh crore | ₹202 lakh crore | -5.2% |
| Aggregate net losses | ₹1,11,788 crore | ₹91,685 crore | -18.0% |
| Average loss per trader | ₹1,13,913 | ₹1,16,654 | +2.4% |
| F&O STT collection | ₹22,225 crore | ₹27,695 crore | +24.6% |
The first three numbers suggest that SEBI’s measures are clearly changing participation behaviour.
The number of individual traders dropped almost 20%. Aggregate losses declined by roughly 18%. Turnover declined much less, by around 5%.
But average loss per trader rose slightly.
This suggests that a significant portion of the reduction in aggregate losses came from fewer individuals participating, rather than from a dramatic improvement in the profitability of those who continued trading.
That is an inference from the data, rather than proof of causality, but it is an important distinction when interpreting the headline that “retail F&O losses have fallen.”
[Chart 2: Number of individual F&O traders, FY22 to FY26]
This intervention did not begin in FY26
The regulatory concern around retail derivatives trading has been building for several years.
SEBI’s September 2024 study found that 93% of more than one crore individual traders incurred losses in equity F&O during FY22 to FY24. Their cumulative losses exceeded ₹1.8 lakh crore over those three years.
The distribution was even more revealing.
Only around 1% of individual traders earned profits exceeding ₹1 lakh after transaction costs during the three-year period. Individual traders collectively incurred approximately ₹50,000 crore in transaction costs, of which 51% was attributed to brokerage and around 20% to exchange fees.
SEBI also found that more than 75% of traders who had suffered losses continued trading despite losses in the preceding years. In FY24, more than 75% of individual F&O traders who reported income had annual income below ₹5 lakh.
There was another important finding.
In FY24, proprietary traders generated around ₹33,000 crore of gross trading profits, while FPIs generated approximately ₹28,000 crore. SEBI reported that 96% of proprietary trader profits and 97% of FPI profits came from entities using algorithmic trading.
This does not establish that algorithmic trading causes retail losses. It does, however, illustrate the type of participants against whom a substantial part of the market operates: professional firms with institutional infrastructure, quantitative systems, execution technology, risk models and considerable capital.
That matters when thinking about what constitutes an edge in a modern derivatives market.
What did SEBI actually change?
Beginning in late 2024, SEBI introduced a series of measures aimed primarily at excessive speculation and concentration in index derivatives.
Weekly index derivative products were rationalised. Tail-risk protection on expiry days was increased. Minimum contract sizes for index derivatives were raised. Option premium collection from buyers was moved upfront. Calendar-spread benefits were removed on expiry days, and position-limit monitoring was strengthened.
Additional changes in 2025 addressed expiry-day concentration and the monitoring of large derivatives positions.
The consequences started appearing quite quickly.
SEBI’s July 2025 study found that between December 2024 and May 2025, compared with the corresponding year-earlier period, index-options turnover declined 9% in premium terms and 29% in notional terms.
Individual derivatives turnover declined around 11%, while the number of unique individual participants declined around 20%.
There is an important academic caveat here.
SEBI itself explicitly noted that causality is difficult to establish, because several variables can affect derivatives volumes simultaneously. Therefore, it would be too simplistic to attribute every decline in FY26 entirely to a particular regulatory intervention.
What can reasonably be said is that the decline occurred after a series of measures specifically designed to change the economics and accessibility of short-term derivatives trading.
Then there is STT
Perhaps the most interesting counter-trend in the entire dataset is Securities Transaction Tax.
While retail participation and aggregate losses declined in FY26, the government’s collection of STT from F&O increased substantially.
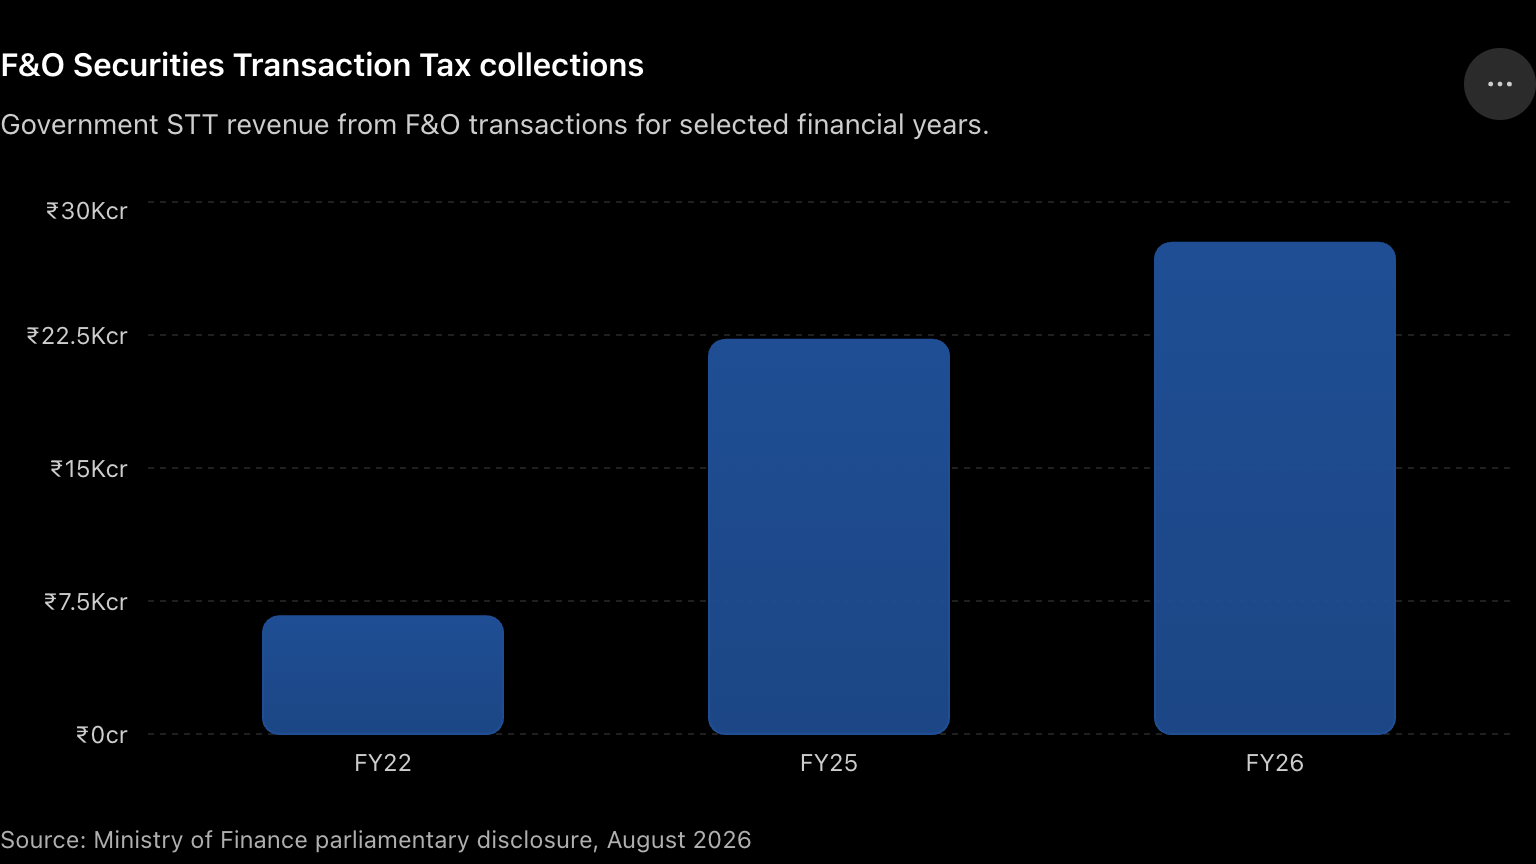
F&O STT collections stood at:
FY22: ₹6,634 crore
FY25: ₹22,225 crore
FY26: ₹27,695 crore
That means F&O STT revenue in FY26 was more than 4.1 times the FY22 level.
Even more strikingly, FY26 collections increased 24.6% over FY25, despite the decline in individual participation and reported derivatives turnover.
Of the ₹27,695 crore collected in FY26, approximately ₹19,802 crore came from options and ₹7,893 crore from futures. Options therefore accounted for roughly 71.5% of F&O STT revenue.
[Chart 3: F&O STT collections, selected financial years]
It may look contradictory for trading participation to fall while transaction-tax revenue rises, but there are two reasons the figures should not be compared mechanically.
First, STT collections cover taxable F&O transactions across the market, whereas the ₹91,685 crore loss figure relates to individual traders in SEBI’s broker sample.
Second, the tax rate itself has increased.
From April 1, 2026, the Finance Act, 2026 raised STT on the sale of futures from 0.02% to 0.05%. STT on the sale of options increased from 0.10% to 0.15% of the option premium, while the rate applicable when an option is exercised moved from 0.125% to 0.15%.
| Transaction | Up to March 31, 2026 | From April 1, 2026 |
|---|---|---|
| Futures sale | 0.02% | 0.05% |
| Option sale | 0.10% | 0.15% |
| Exercised option | 0.125% | 0.15% |
Importantly, the ₹27,695 crore FY26 figure relates to the financial year ending March 2026, so it does not yet capture the full effect of the April 2026 increase.
The impact of the latest tax increase will therefore become visible in FY27 data.
What does this mean for traders?
For an occasional directional trader, a small increase in transaction costs may appear insignificant compared with the potential movement in an option premium.
For a high-frequency trader, scalper or strategy with a relatively thin expected edge, the economics are very different.
A strategy does not need merely to be profitable before costs. Its expected return must consistently exceed brokerage, STT, exchange charges, SEBI charges, GST, stamp duty and slippage.
As trading frequency increases, these frictions compound.
The impact is particularly significant for futures traders, where the sell-side STT rate has increased from 0.02% to 0.05%. That represents a 150% increase in the statutory rate. Strategies targeting very small intraday price movements consequently require a larger gross edge before costs to produce the same net return.
For options sellers, STT on the premium received has increased from 0.10% to 0.15%, a 50% increase in the rate. Traders running strategies that require frequent adjustments, rolls or exits need to incorporate this explicitly into strategy expectancy.
Options buyers are not completely insulated either. A trader who buys an option and subsequently closes the position by selling it incurs STT on that sell transaction. If an in-the-money option is exercised, a separate exercise-related STT framework applies.
Higher transaction costs therefore disproportionately affect strategies built around high turnover and low profit per trade.
This is fundamentally different from a strategy that trades less frequently but seeks a much larger expected movement relative to costs.
The bigger question is not whether F&O is good or bad
Derivatives themselves are not inherently speculative products.
They exist for legitimate economic purposes: hedging, risk transfer, price discovery, portfolio management and capital efficiency. SEBI itself recognises these functions.
The concern arises when instruments designed for risk transfer increasingly become vehicles for repeated short-duration speculation among participants without durable risk management or measurable trading expectancy.
SEBI’s data increasingly suggests that activity and profitability are not the same thing.
In its FY22 to FY24 analysis, the regulator found that higher trading activity among individual options traders was associated with a higher proportion of loss-makers. Among high-value traders, approximately 93% still incurred losses.
This is an important lesson because trading platforms naturally make activity easy to measure.
Number of trades is visible. Turnover is visible. Winning trades are memorable.
What matters economically, however, is something less exciting: net expectancy after every cost over a sufficiently large sample of trades.
A trader can have many profitable days and still operate a structurally loss-making strategy.
One data issue is worth noting
Readers comparing the latest numbers with SEBI’s July 2025 report may notice that FY25 figures are not identical.
SEBI’s July 2025 study, using data from the top 13 brokers, reported approximately 96 lakh traders and ₹1,05,603 crore of net losses in FY25, with an average loss of ₹1,10,069.
The more recent data disclosed to Parliament uses information from the top 15 brokers and reports FY25 at 98.10 lakh traders, ₹1,11,788 crore of losses and an average loss of ₹1,13,913.
For consistency, the FY25 versus FY26 comparisons in this article use the latest parliamentary series.
The difference is also a reminder that these studies are large-sample estimates rather than a perfect census of every F&O account in India.
So, has the regulatory intervention worked?
On one dimension, the evidence is increasingly clear.
Retail participation has fallen. Aggregate retail losses have fallen. Derivatives turnover has moderated. The extraordinary proliferation of short-duration index-option activity has also slowed compared with its earlier trajectory.
But another question remains unresolved.
Are the traders who remain in F&O becoming better traders?
FY26 does not yet provide evidence of that.
The average reported loss increased from approximately ₹1.14 lakh to ₹1.17 lakh per trader.
That means the next phase of India’s derivatives story should probably be judged not simply by how many traders leave F&O, or how much turnover declines, but by whether the economics of the remaining participant base improve.
The objective of a mature derivatives market should not be the elimination of speculation. Speculation provides liquidity and facilitates risk transfer.
The objective should be a market where participants understand the risks they are assuming, transaction costs are incorporated into strategy design, leverage is treated carefully, and traders evaluate themselves on long-term net expectancy rather than isolated winning trades.
India’s F&O market is clearly changing.
Whether India’s F&O trader changes with it may ultimately be the more important question.
For traders in the community: have the larger contract sizes, fewer expiries and higher transaction costs changed the way you trade? Have you reduced frequency, changed position sizing, moved to different strategies, or noticed a meaningful difference in your net trading costs?
Sources
Ministry of Finance data disclosed to the Rajya Sabha on August 11, 2026, covering individual participation, losses, turnover and F&O STT collections, as reported by Moneycontrol and Business Today.
SEBI, Analysis of Profits & Losses in the Equity Derivatives Segment, FY22-FY24, September 2024.
SEBI, Comparative Study of Growth in Equity Derivatives Segment vis-à-vis Cash Market after Recent Measures, July 7, 2025.
National Stock Exchange, Circular NSE/FATAX/73524, March 31, 2026, detailing revised STT rates effective April 1, 2026.
The aggregate numbers tell us what is happening to India’s F&O market, but they do not tell us how traders themselves are adapting to it. That is the part I would genuinely like to understand from this community.
Has the F&O reset changed the way you trade? Are you trading less frequently, becoming more selective, changing strategies because of higher costs and larger lot sizes, or has your approach remained largely unchanged?
To make it easier, you can simply reply with what best describes you:
- Trading less
- Changing my strategy
- Higher costs have affected my profitability
- No meaningful change
- Reduced/ stopped F&O
It would be interesting to see whether the experience of traders here matches what the aggregate data is showing.