The Choppiness Index: Good or Great?
The Choppiness Index is a tool used in financial markets to measure the market’s trendiness or choppiness. It is a crucial tool for traders to perform financial analysis and assess the stability of market conditions.
Join us as we break down the Choppiness Index, offering real-world examples to help you understand how it works. We will also cover the pros and cons, giving you a comprehensive view of whether the Choppiness Index is good or great for your trading style.
What Is the Choppiness Index?
The Choppiness Index is a technical analysis indicator used in financial markets to measure the choppiness or lack thereof in a security’s price movement. It is computed by dividing the Average True Range (ATR) by the total price range of the selected period.
Developed by Australian trader E.W. Dreiss, it ranges from 0 to 100, with higher values indicating a choppy or sideways market and lower values suggesting a trending market.
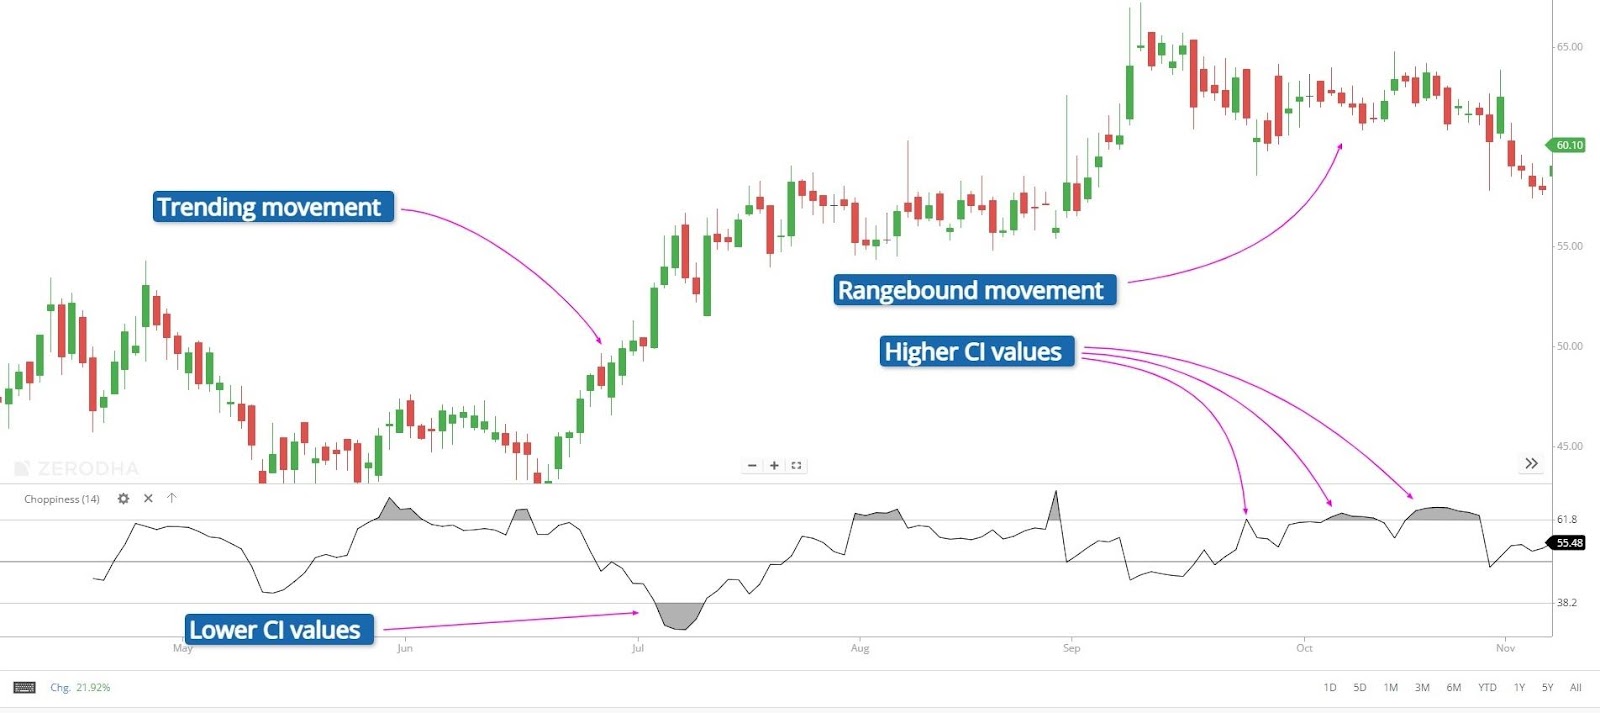
For example, a CI of 61.8 or higher suggests a choppy period, while a CI of 38.2 or lower may indicate a strong trend.
Here are some general interpretations of the CI:
- 61.8 or higher: Signals a choppy market
- 38.2 or lower: Indicates a trending market.
- 38.2–61.8: Suggests a choppy or sideways market.
The Choppiness Index can also provide insights into when a trend is likely to reverse, but can only be effective in that regard when used in tandem with other other indicators.
What Are the Pros of the Choppiness Index?
Here are some pros of using the Choppiness Index:
- Early Detection of Market Change: Catches the early stages of a market change
- Breakout Opportunities: Helps traders trade based on potential breakouts rather than chance.
- Improved Understanding of Market Dynamics: This can help traders better understand market dynamics.
- Adaptability to Different Market Conditions: Can help capitalize on potential opportunities in both trending and ranging market conditions.
The Choppiness Index is similar to the Average Directional Movement Index, as both are developed to gauge a trend’s strength and movement direction.
What are the Cons of the Choppiness Index?
The Choppiness Index is a non-directional, lagging indicator that describes recent price trends. It can be helpful in all asset classes but is more suitable for higher volatility conditions. However, here are some potential drawbacks or cons associated with using the Choppiness Index that traders need to know:
- Not a directional indicator: The CI cannot be used to predict future price direction.
- Not suitable for all markets: The CI is more suitable for higher volatility conditions, like in stock index trading.
- Not suitable for trend traders: Many traders focus on trading trends, so when a choppy market is present, trend traders struggle to make money.
Whether the Choppiness Index is helpful, whether it is good, or great for your trading strategy depends on your individual preferences.
Conclusion
The Choppiness Index serves as a valuable tool, helping you gauge market trends and potential volatility. Its simplicity and effectiveness make it a good choice if you are seeking to navigate financial markets.
While it may not be the ultimate solution, its contribution to decision-making and risk management is undeniable. When used in combination with other indicators, the Choppiness Index proves to be a great asset.