Dear Traders,
At Dhan, we understand that Options Traders view markets differently from other market participants - they need to be informed, have all insights in real-time, ability to view data in depth, build strategies, hedges and track much more along with market movements - which is why we built Options Trader by Dhan as an in-depth platform for option traders to begin with.
With time, we have enhanced Options Trader both on app and web, and we continue to make your experience better everyday. Yes, reading the market right is everything - and so much that comes down to how clearly, and how quickly, traders can see what the market is actually doing.
This is the thinking behind every tool we have built in recent days for options trading on Dhan: the Straddle Chart, Straddle Chain, ATM IV, Option Chain, and Volatility Skew. Each one exists to give you a sharper, faster read of the market. The clearer your analysis, the sharper your decisions.
Open Interest or OI sits right at the centre of the analysis. It tells you where positions are building and where they are unwinding, where the market is committing money, and where it is stepping back. But analysing OI on a mobile screen has never been a seamless experience. To track total OI, intraday shifts, PCR trends, and real-time buildup, traders have been forced onto the web or across different apps, stitching the picture together manually. That is slow. And on mobile, speed is the entire point.
Today, we are changing that.
Introducing: Advanced OI Analytics on Options Trader App
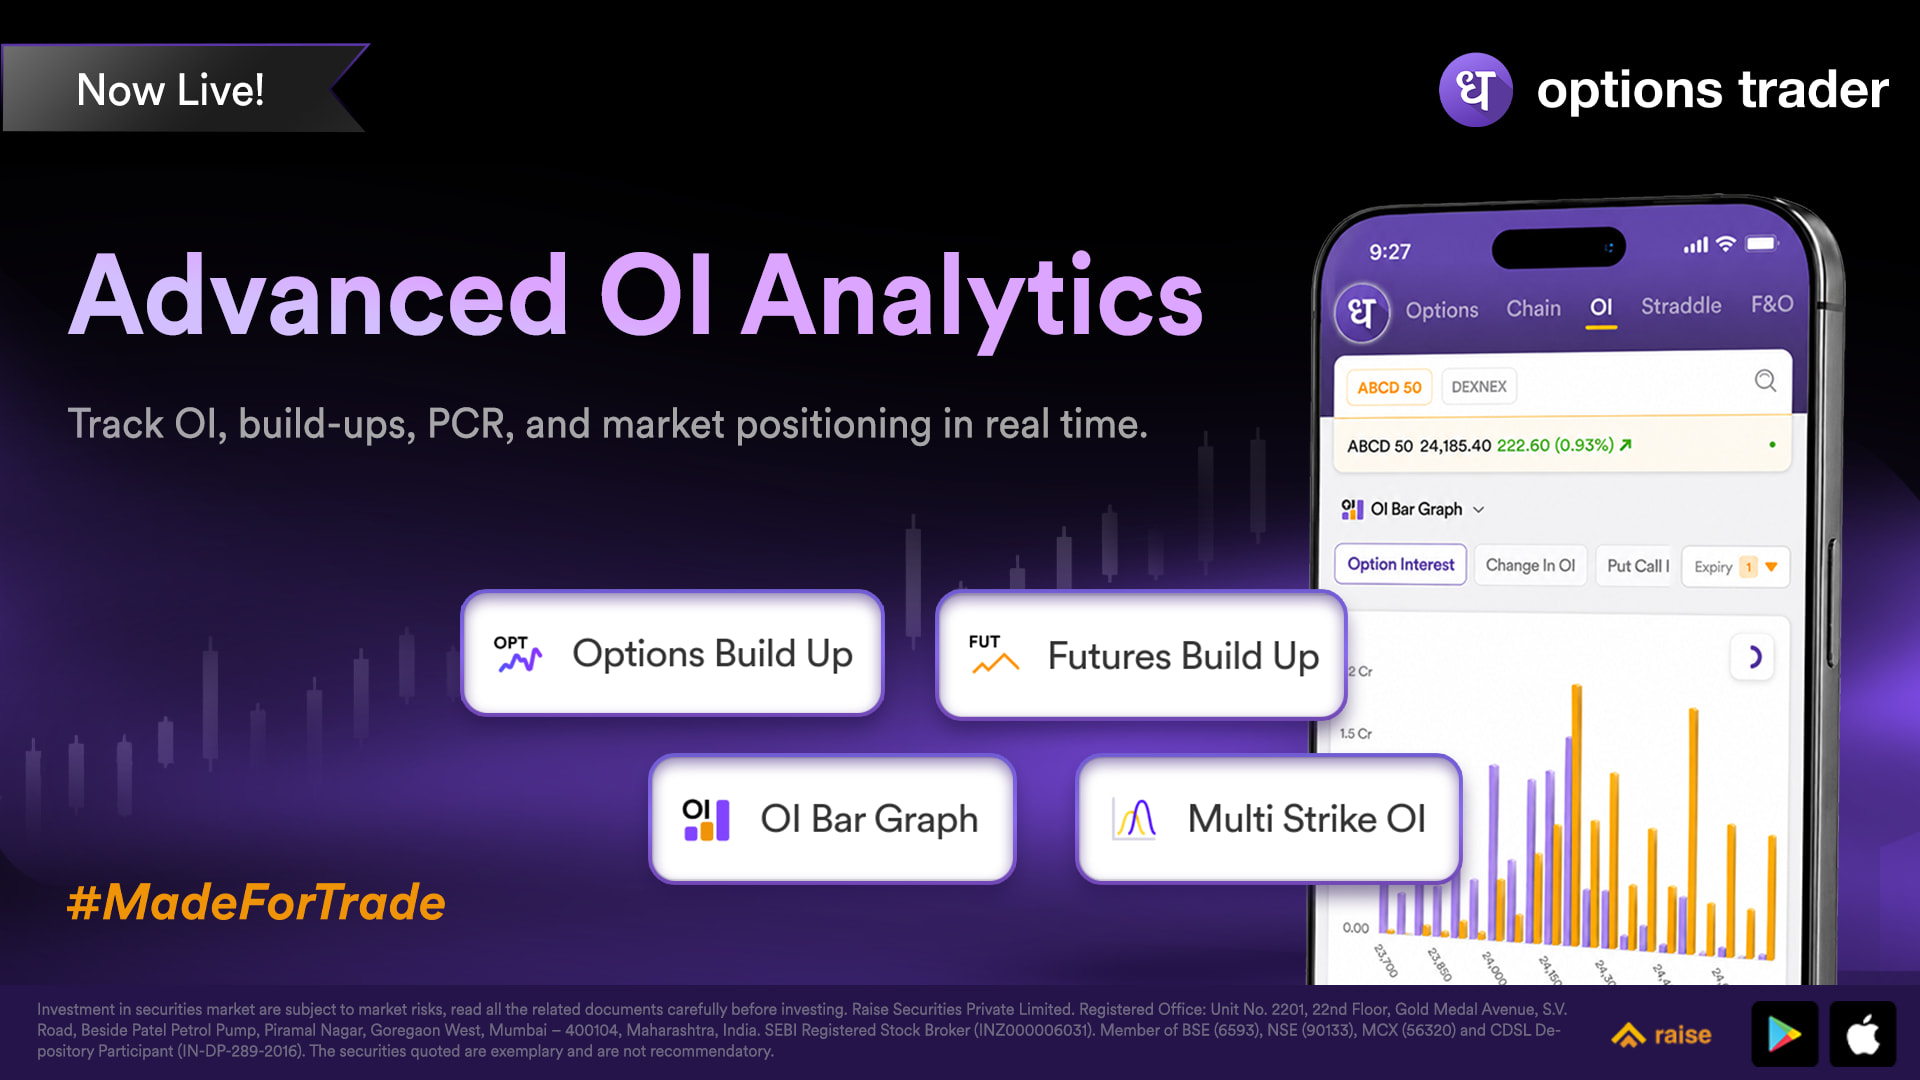
We have brought every dimension of Open Interest analysis into one unified section, directly on your mobile screen. No switching apps, no jumping to the web, no manual correlation of data. A complete, real-time picture of market positioning, so you can read sentiment and act on it, all from the palm of your hand.
Here is what is now live:
-
OI Bar Graph
Tap on the chart to see strike-wise Call and Put OI, Change in OI, PCR, and Volume PCR in a clean visual layout. Select multiple expiries, adjust the strike range with a simple slider, and toggle between live intraday and historical EOD data. You can also track position changes across short intervals — the last 5, 15, 30, or 60 minutes — with custom reference points, so you can see exactly where positions are shifting through the day. -
Options Buildup
Analyse real-time buildup — Long Buildup, Short Buildup, Long Unwinding, and Short Covering — strike by strike, directly from the app. Use the Chain view for strike-wise trends across the board, the Contract view to drill into a single strike over custom intervals, or the Historical Price and OI chart to see how positioning has evolved over time. -
Futures Buildup
Scan every F&O stock with real-time buildup, volume, and price change on a single screen. Filter by Nifty 50, Bank Nifty, or Nifty sectors to quickly see where OI activity is flowing, and pull interval-wise buildup data for any futures contract you are tracking. -
Multi-Strike OI
Select multiple strikes and plot their OI together on one chart, alongside the underlying price of the index, stock, or commodity. This makes it far easier to spot key support and resistance levels on the fly, and to read positioning skews — without switching between screens.
All of this runs on live OI updates across indices, F&O stocks, and commodities. And we have kept it flexible: strike ranges, intervals, and reference points are all yours to customise, so the analysis fits the way you trade.
A few of these capabilities are things you simply will not find on most mobile platforms today:
-
Futures and Options Buildup on smaller timeframes: Most tools give you buildup at the level of the day. We let you read it in tighter intervals, so you catch shifts as they happen, not after they are done.
-
Intraday OI and OI Change: A live, moving view of OI through the session, not just an end-of-day snapshot.
-
A past bar graph of strike-wise OI: The ability to go back and study how strike-wise OI bar graph looked historically, not only where it stands right now.
Advanced OI Analytics is now live on the Options Trader App. Go to the Insights tab at the bottom of the screen and tap on the OI section in the top bar to access it.
Like many features, this was also inspired by suggestions from the Dhan community. We will continue to build with this community. Please use it and share your feedback
Happy Trading,
Jai