Hi Traders,
Understanding how the market is priced at any given moment is one of the most important skills in options trading. At Dhan, we have built tools to bring all of this to you in real time. Features like the Advanced OI Analytics, and the Advanced Option Chain are all designed around one core belief: to provide the data you need to plan and execute your next trade. Volatility is at the heart of options pricing, and it is something we keep returning to as we build.
We know that options traders track Implied Volatility closely, but following ATM IV through the day is not straightforward. As the market moves and the underlying crosses strike levels, the ATM strike shifts. Tracking IV at that new strike, and then the next, requires constant manual switching on the Option Chain. There is no way to see how ATM IV has trended through the session, or across recent weeks, in one continuous view. We asked ourselves: why should a trader piece this together manually when the data is right there?
Introducing At-The-Money IV Chart on Options Trader Web
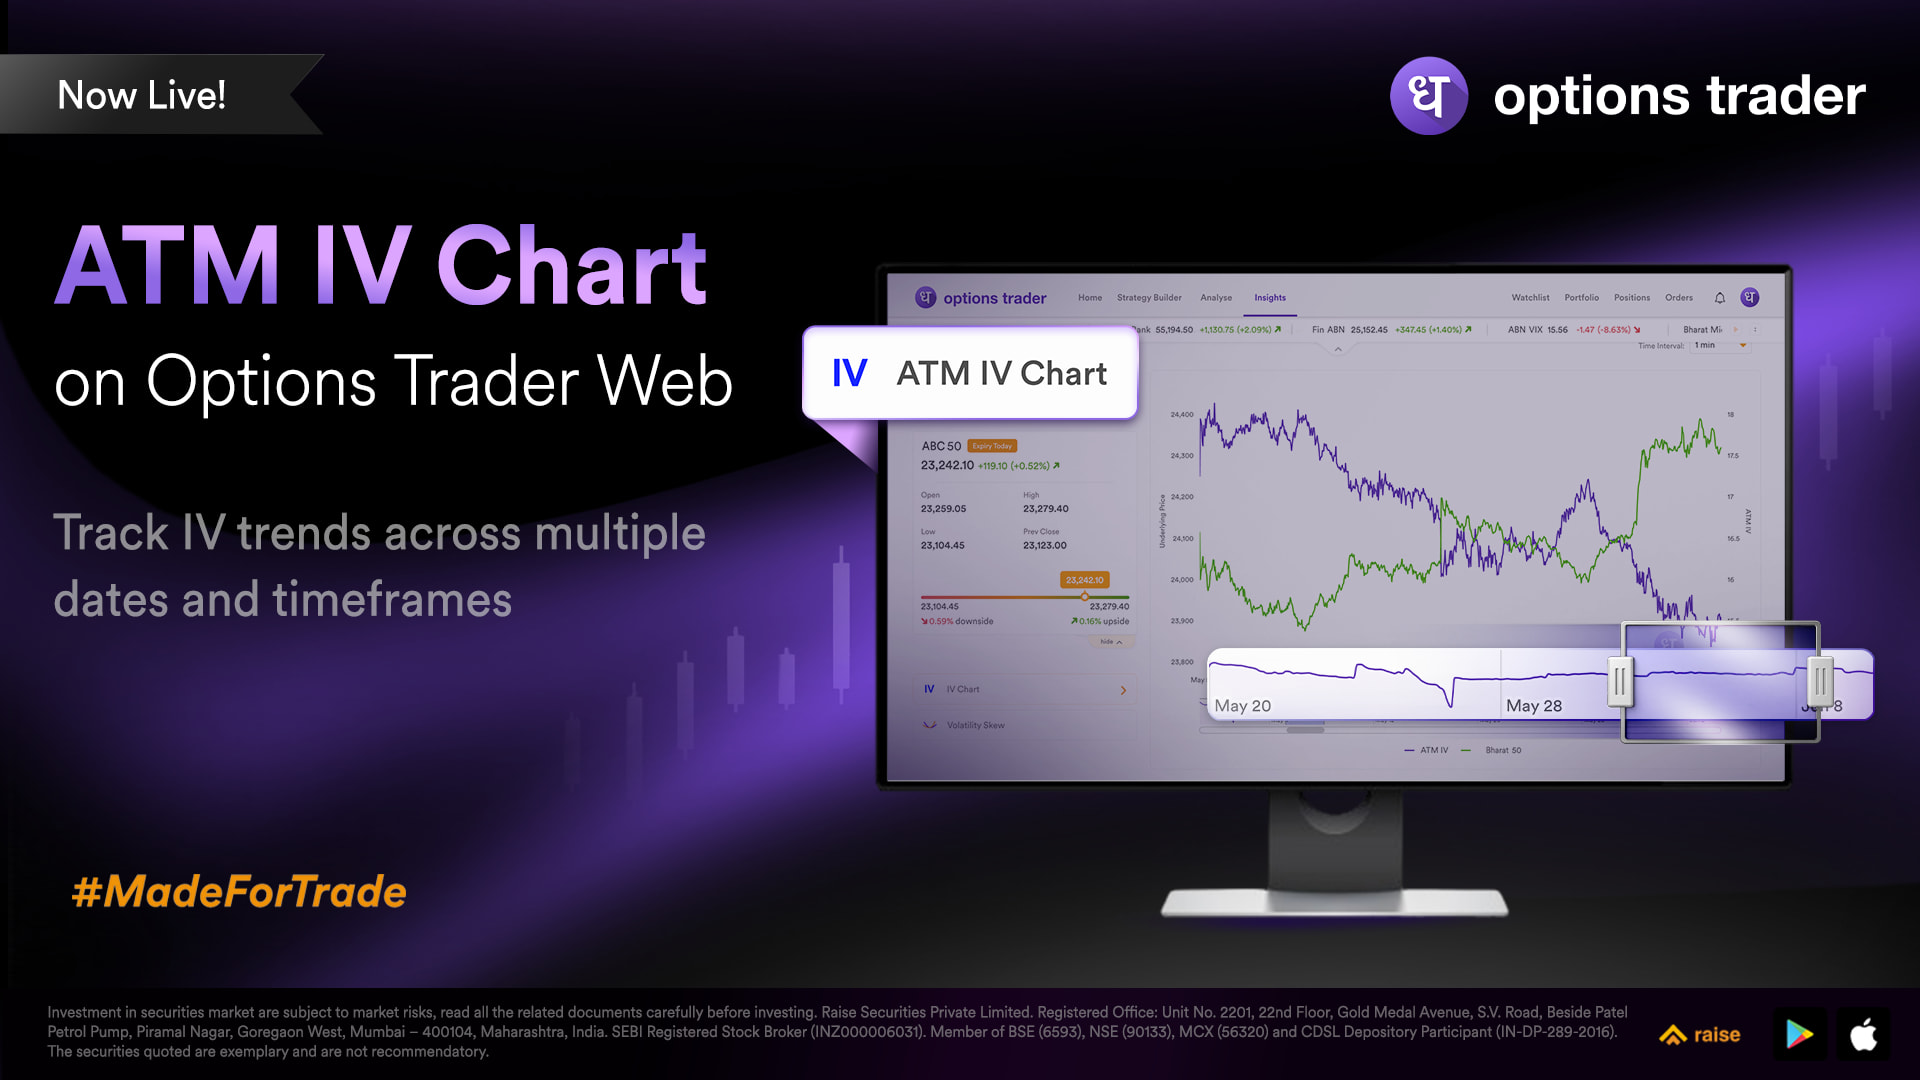
The ATM IV Chart gives you a real-time, continuous view of implied volatility at the ATM strike, overlaid with the underlying spot price, so you can see how volatility is behaving relative to price action without any manual tracking.
● Auto-ATM IV: The chart automatically identifies and tracks the ATM strike as the spot price moves. When the underlying crosses into a new strike, the IV updates to reflect the new ATM. You always see the most relevant volatility number, with no manual switching required.
● Multiple Timeframes: Analyse ATM IV trends across 1-minute, 5-minute, 15-minute, 30- minute, and 60-minute intervals. Whether you are watching intraday volatility spikes or tracking a broader trend through the session, pick the view that fits.
● Auto-Refresh: The chart updates live throughout the trading session, so you are always looking at the latest IV data without needing to reload or manually refresh the page. ● Backdated Data: Go beyond today’s session. With up to 45 days of historical data, you can study how ATM IV has behaved around past events, expiry cycles, and different market conditions, giving context to what you see in the live session.
The ATM IV Chart brings together live volatility tracking and historical context in one clean view, making it easier to read whether the market is pricing in more risk or less, and to time entries and exits around volatility shifts.
ATM IV Chart is now live on Options Trader Web. Head to options-trader.dhan.co, go to Insights - > IV Chart and start tracking how implied volatility moves with the market today.
This was built from feedback from traders who wanted a cleaner, continuous way to track volatility without switching between strikes. Do let us know how it is working for you and what else you would like to see.
Happy Trading,
Jai Supreeth
Disclaimer :- https://dhan.co/advertisement-disclaimer/