Hello Traders! 
At Dhan, we continue to build and ship platforms, products, features and capabilities that make a difference to your life as a Trader and enhance your trading experience.
We built DEXT T3 - The Trading Terminal grounds-up with the same thought process. And now every feature we build for DEXT T3 starts with one question - what information gap is quietly costing traders edge every single day?
For option traders, one gap has always stood out. The option chain has every number you need - OI, Delta, Gamma, strike after strike - but none of the answers. You can see the data. You can’t see the story it’s telling. Reading the option chain properly means opening every strike, multiplying OI by Greek by spot by lot size in your head, comparing call side against put side, and guessing where the market might pin, break, or accelerate.
It’s the kind of reading that a trading desk does as routine. For everyone else, it’s slow, easy to get wrong, and basically impossible to do live while the market is moving.
That gap ends today.
Introducing: Greeks Exposure on DEXT T3.
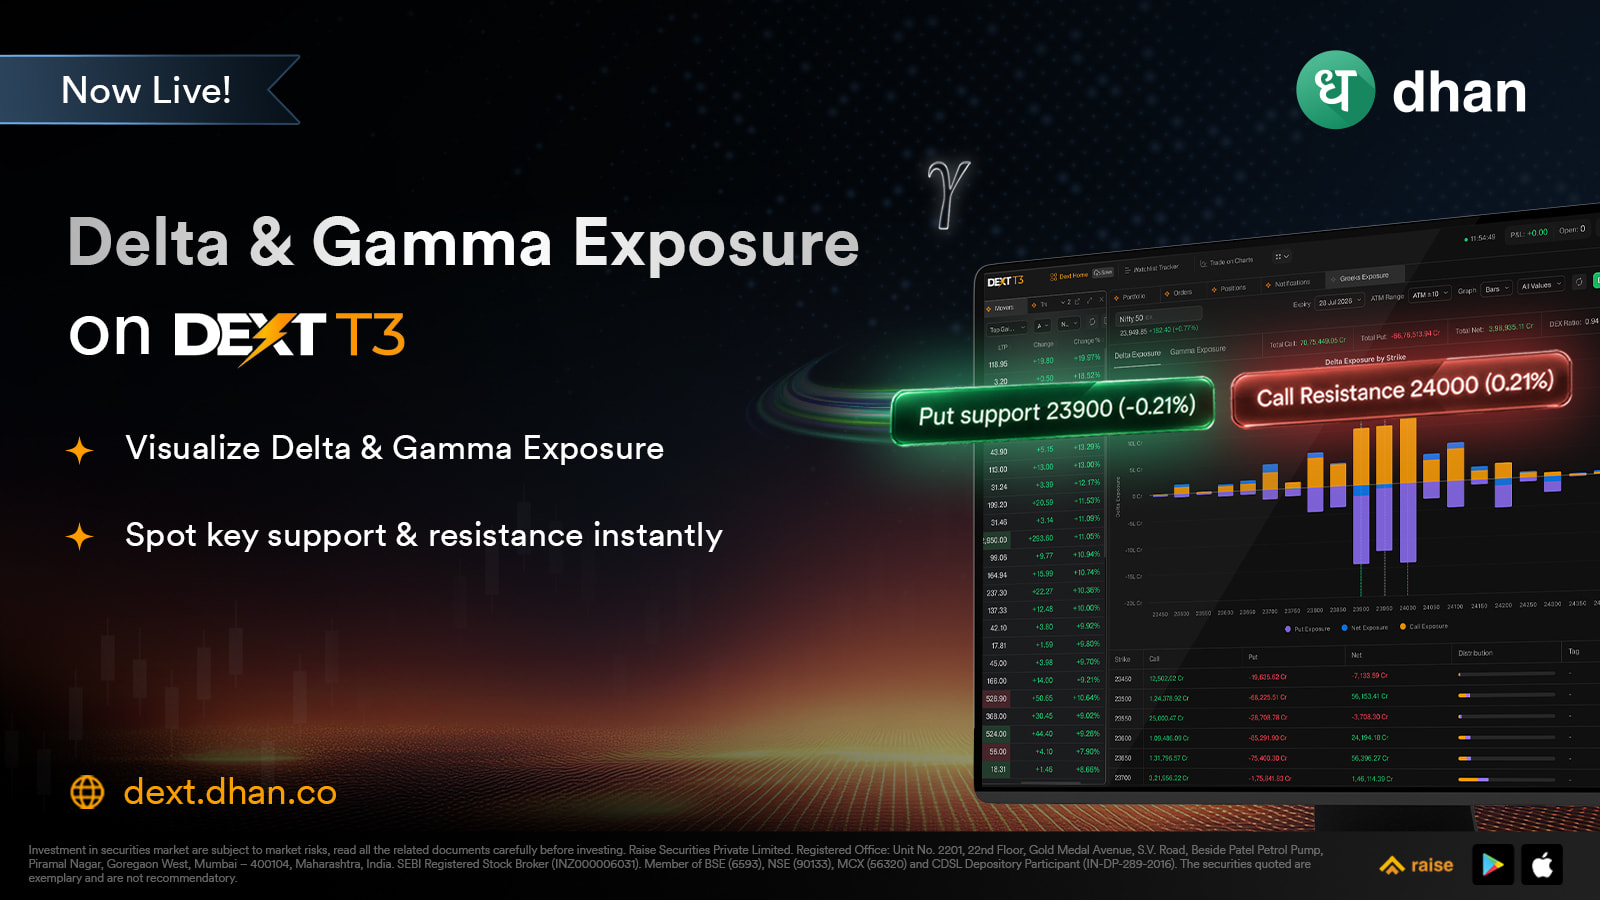
Let’s say it’s an expiry day. NIFTY spot is sitting at 24,300, and price has been choppy all morning. Nothing on your regular option chain tells you why. The OI numbers are all there, strike by strike - but turning that into “will this hold, or will this break” means doing math the chain was never built to show you. This is the gap that costs option traders their edge. Not the strategy. Not the read on IV. But the fact that the option chain shows you raw numbers, not the picture those numbers add up to - where the real walls are, where the market is most sensitive to a move, and which way the hedge book is actually leaning.
So you open the Greeks Exposure widget alongside your chart. On the Gamma tab, Total Net exposure is strongly positive. The Regime card reads Stabilising - Strong Skew. Call Resistance sits at 24,500. Put Support sits at 24,200. And the High OI Node - the strike where the most combined action is concentrated - sits almost exactly where spot is trading, at 24,300.
What the data suggests: the market is sitting between a well-defended floor and a well-defended ceiling, with hedging activity likely to dampen large moves. Traders who read this kind of setup typically watch for range-bound, magnet-like behaviour near the centre of that zone - and treat a genuine break of either wall as a strong indication that the range is done, not just noise.
That’s the read Greeks Exposure gives you, in seconds, every tick - not the one you’d otherwise have to reconstruct by hand.
Here’s exactly what you can see:
What You Can See - The Basics
→ Delta Exposure (DEX)
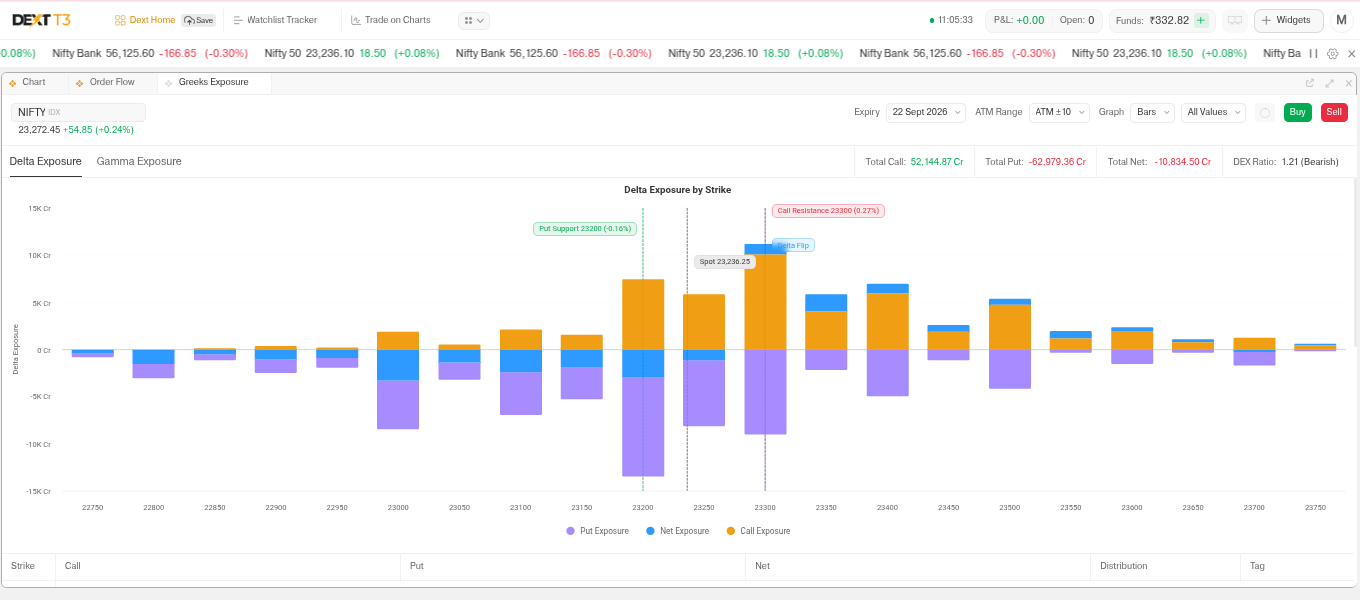
DEX answers a simple question: how much directional risk is sitting at each strike? It tells you where the hedge book would be forced to buy or sell the underlying if spot moves even a little. Call side contributes a positive number, put side contributes a negative number, and net is simply the two combined - so a big positive bar means a strike is call-heavy, a big negative bar means it’s put-heavy.
→ Gamma Exposure (GEX)
GEX answers a different question: where does hedging activity get most intense if spot moves? High-gamma zones tend to pin the market or accelerate a move, depending on which way they’re skewed. Same sign convention as Delta - calls positive, puts negative, net is the combination.
Switch between Bars or Lines depending on whether you want a side-by-side comparison or a smoother read on the curve, and toggle between All Values for the full picture or Net Focus when you just want to see which way the combined market is leaning.
What You Can See - Going Deeper
→ Key Levels, Marked Directly on the Chart
Every session, Greeks Exposure marks the strikes that matter as coloured chips right on the chart. Call Resistance is the strike carrying the largest call exposure - often where call sellers defend a ceiling. Put Support is the strike carrying the largest put exposure - often where put sellers defend a floor. High OI Node is the strike with the highest combined OI - a common magnet for price. Flip marks where net exposure changes sign - the zone where market behaviour often shifts from calm to choppy, or the other way round. And Peak +/- mark the most stabilising and most destabilising strikes in the slice you’re viewing. Labels reflow automatically when levels sit close together, so nothing overlaps.
→ The Summary Strip
Sitting right above the chart, the summary strip totals Call, Put, and Net exposure for whichever Greek you’re on, along with a Put/Call ratio and a plain-language sentiment tag - Put-Dominant, Call-Dominant, or Balanced. No mental math required to know which way the chain is leaning.
→ Interpretation Cards - the “so what”
This is the part that turns numbers into a read. The GEX Regime card tells you whether the market looks Stabilising, Volatile, or Neutral, based on the sign of net exposure. The GEX Skew card tells you how strong that read is - Strong, Moderate, Mild, or Balanced - with a short plain-English line explaining what it typically means. And the DEX Net Bias card gives you a second, independent lens - whether the hedge book itself is leaning Bullish, Bearish, or Balanced.
Gamma tells you how price is likely to behave. Delta tells you which way the hedge book is leaning. When both agree, that’s a stronger signal worth watching. When they disagree, that’s worth watching just as closely, for the opposite reason - the Put/Call ratio might read one way while the underlying hedge positioning reads another, and Greeks Exposure surfaces both so you’re never working off half the picture.
→ Strike-by-Strike Table
Below the chart, every visible strike gets its own row - Call, Put, and Net exposure, OI, and tags like CALL RESISTANCE, PUT SUPPORT, GAMMA FLIP, PEAK +GAMMA, or HIGH OI NODE wherever they apply. At a glance, you can see exactly why a strike made the chart in the first place.
→ Built to Flex With Your Style
Greeks Exposure reads the expiry you’re actively watching, so the read stays sharp and anchored to the trade in front of you rather than diluted across expiries you aren’t trading.
The ATM Range control lets you widen or tighten the window of strikes it computes across - scalpers can stay tight around spot, swing traders can open it up - and symbol search plus expiry and symbol sync mean it moves with the rest of your linked panels without you touching a thing.
It works on any scrip with an option chain - NIFTY, BANKNIFTY, FINNIFTY, or individual stock options.
A Little Story of How & Why We Built This
When we sat down to build Greeks Exposure, one of the first calls we had to make was where to draw the boundary of the read itself.
We could have aggregated exposure across every expiry and every strike in the chain.
Instead, we anchored the widget to the expiry you’re actively watching, and to a configurable window of strikes around the spot. That was a deliberate choice, not a shortcut. Strikes far from spot rarely drive what happens intraday, but they do distort totals if you let them in - and a chain-wide, all-expiry aggregate updating live, every tick, is a very different (and much slower) engineering problem than the one we set out to solve.
We chose relevance and speed over completeness for its own sake, because the strikes near spot, on the expiry you’re actually trading, are the ones that move your day.
Every label on the chart also traces back to a number in the table below it - nothing is a black box. And like any structural read of the market, this one works best with context. Expiry week, earnings, and big macro events can override what the exposure map is showing on any given day - which is exactly why Greeks Exposure sits alongside your chart and your option chain, not in place of them.
Built for Indian markets. Built for Indian traders. Built inside a terminal where analysis and execution are one.
How To Get Started with Greeks Exposure
-
Open DEXT T3 - Download for Mac | Download for Windows | or use dext.dhan.co
-
Add the Greeks Exposure widget to your workspace, under Analytics
-
Pick your scrip and expiry - it works on any underlying with an option chain
-
Choose your tab - Delta or Gamma - and your ATM Range
-
Read the key levels, the summary strip, and the interpretation cards together - and see the chain the way a desk would read it
See the options chain. See where it’s loaded. Trade what the structure is actually telling you.
Drop your questions, feedback, and how you’re using the Delta and Gamma views together in the comments below - we’re always listening and always building with you.
Happy Trading!
Bhavya