Introducing: Latest News and Corporate Actions on Dhan Charts

Hello Everyone,

Traders and Investors love the charting experience on Dhan. Over the time, we have focussed to make the charts - fast, reliable, accurate and also improve the execution capabilities with Trade on Charts, Scalper Mode, and recently introduced Trade Plan.

Dhan charts have always been an integral part for a trader, for tracking movements, doing analysis, taking trades with no restrictions on indicators, templates and layouts. This added with Option Chain, Basket Order, Market Replay and our ever increasing list of features and capabilities like Full Market Depth, Market Alerts etc is all aimed to make it a single platform for you to interact with markets.

While a lot can already be done on top of Dhan charts - extensive analysis and simplified trading, we are always on the lookout for the next thing that will make charts even more powerful for all Indian traders. Over hundreds of iterations, we have kept adding different new indicators, data like Live Trades and OI profile along with simpler trading options.

The basis of everything on top of charts is price. Price itself forms candles, indicators and all the analysis that we do on top of it. But price also factors in market data which are not usually captured in charts. This includes latest / breaking news related to companies or corporate events and announcements from the company which ultimately affect the price. This is why we are bringing a new feature to help you deepen your analysis of markets, right on top of charts.

Introducing: Company News and Corporate Actions on Dhan Charts

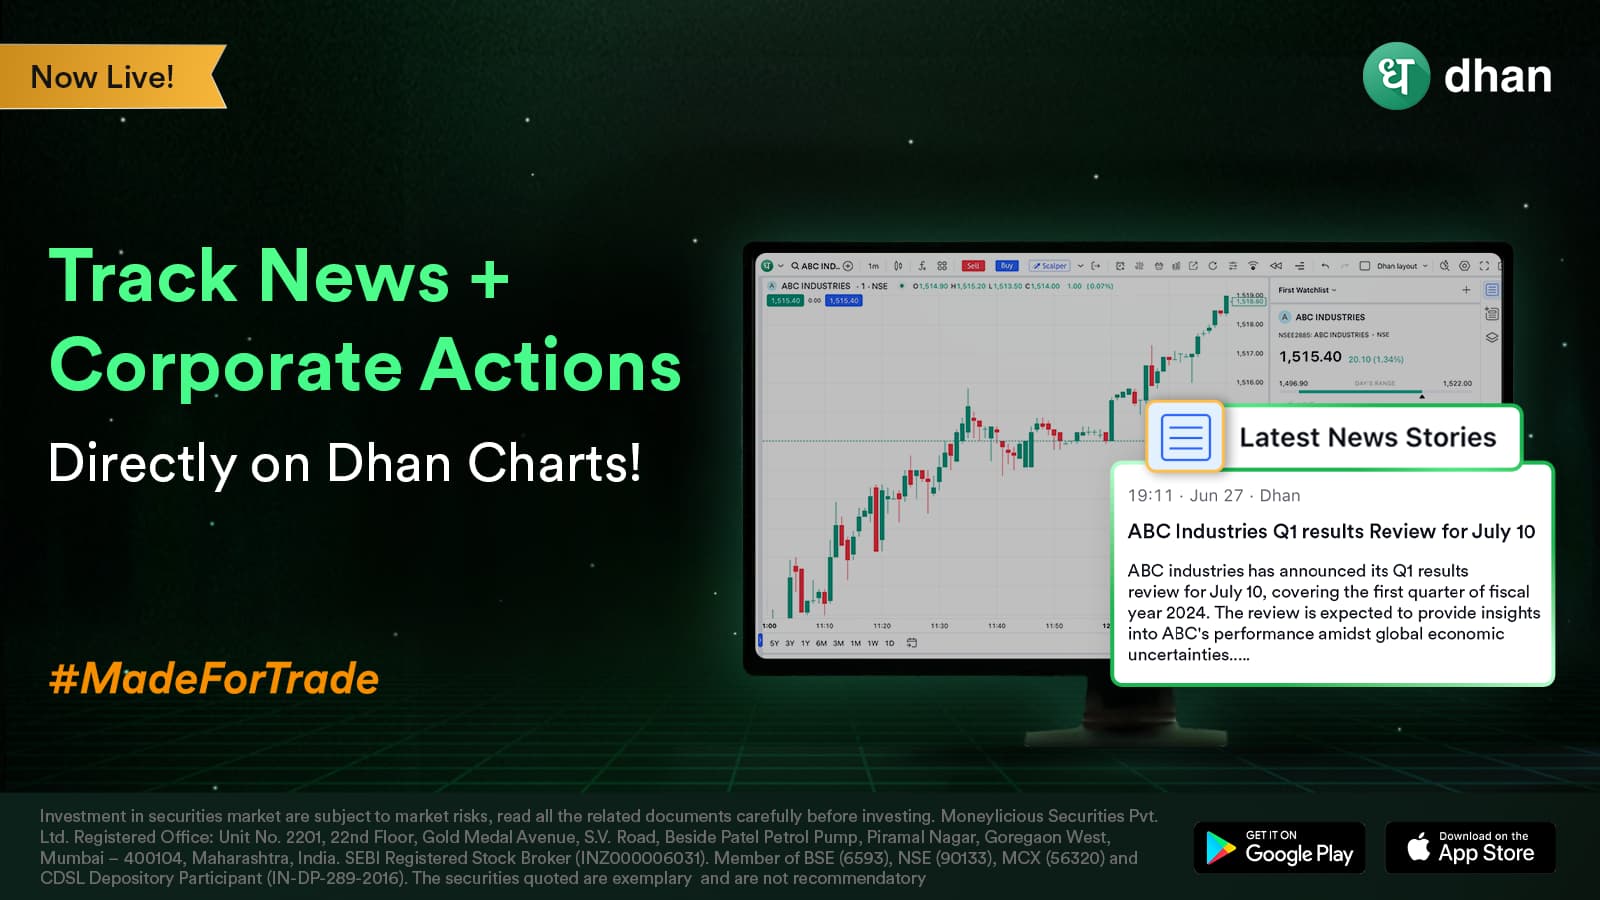
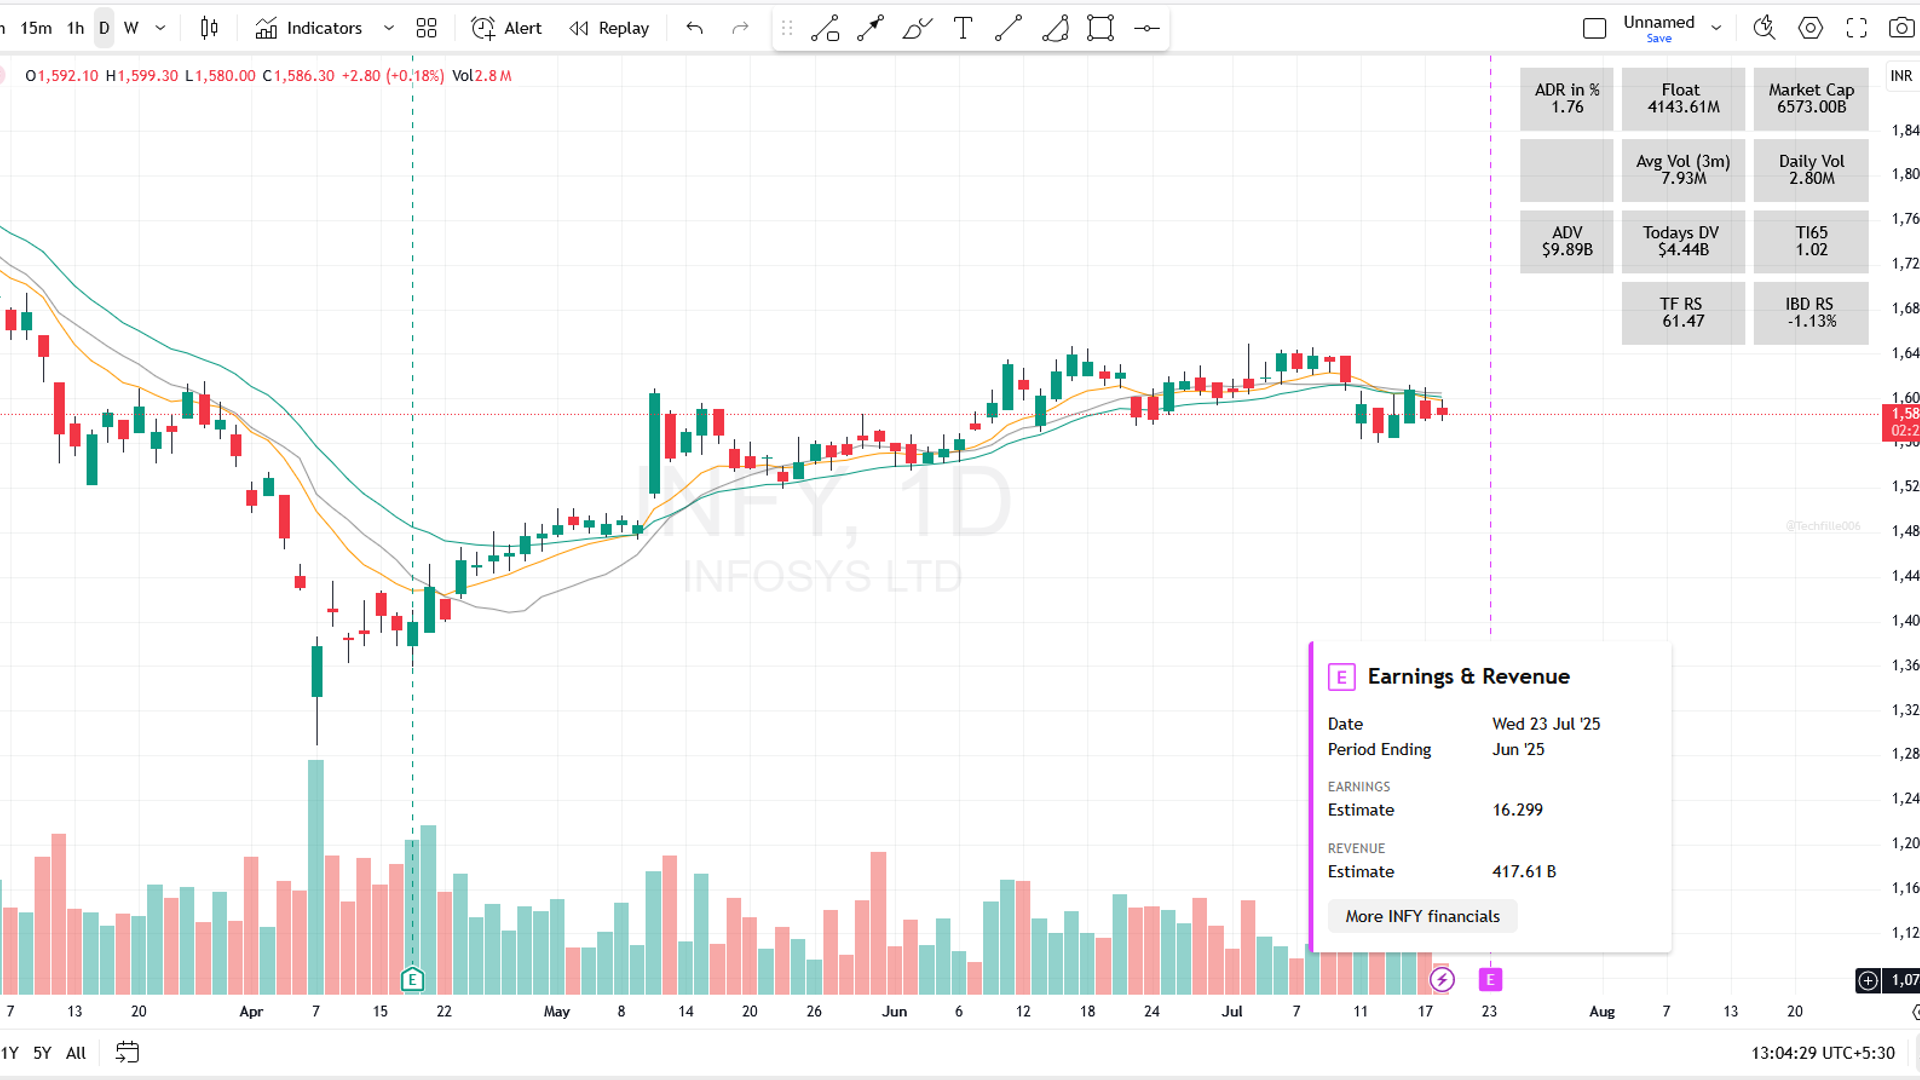
We recently announced ScanX News - real-time and curated in-depth stories along with news flash, that powers updates across Dhan. Now, you can view the same news on top of Dhan Charts as well, to keep you updated about all recent events on the company. You can read snippets directly on top of charts or go to the full articles and cover the news on ScanX - with a single click.

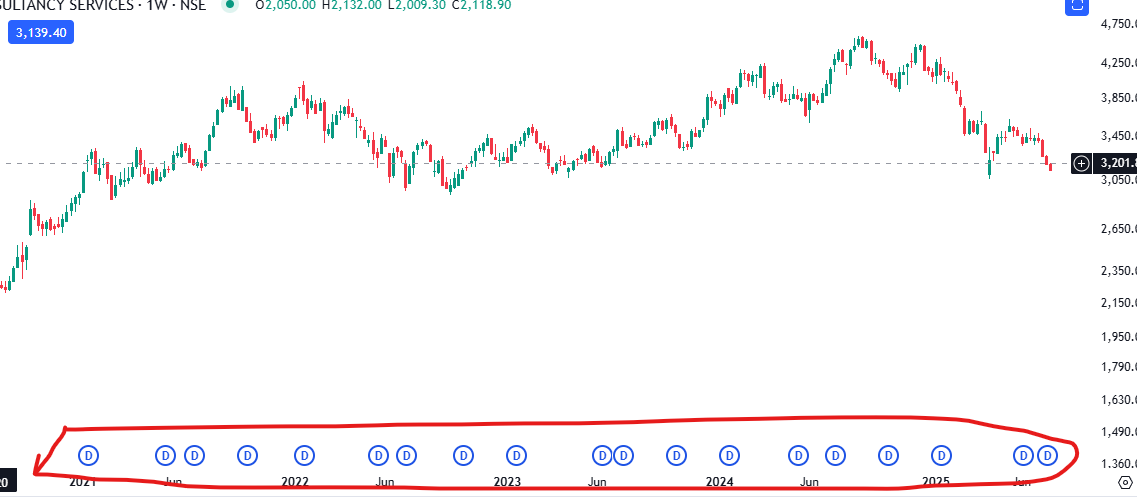
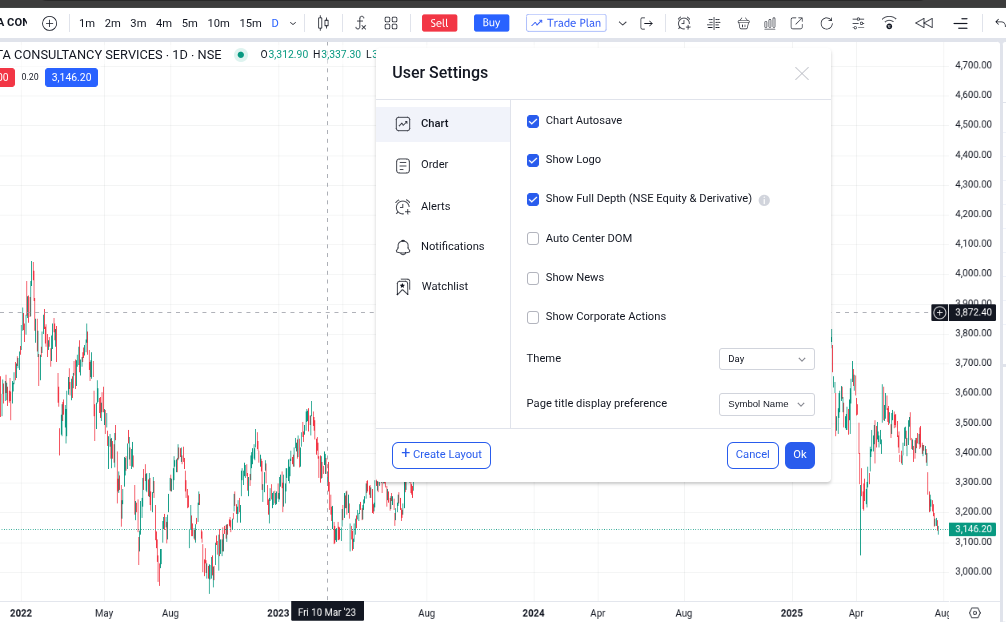
In addition to this, we are also introducing Corporate Actions on charts, which will update you on all major corporate actions happening for any stock. This includes dividend updates, merger-demerger, buyback, splits, rights issues and all other corporate actions that you track. This will help you see the impact on prices in case of such corporate actions.

All the features on top of charts are aimed to make it a single place for you to track markets. This now includes top news and corporate actions as well. We plan to keep on improving your charting experience with upcoming updates.

@trust_level_0 @trust_level_1

Do let us know your feedback, as we keep building on top of it.

Happy Trading!
– Hardik

10 Likes

Thank you Team @Dhan & @Hardik

1 Like
  1. Currently upcoming corporate actions are shown against only that specific date. It would be useful if you can show against the current date as well. Getting information on the event date is of no use. If we can get prior information, it will be useful for trading or investing.

  1. It looks like corporate results event is not being shown on charts.

Hey @sri1647

Thank you for the feedback. Noting this down and will try to improve it as mentioned by you. To give you an overview of current method:

  1. Corporate Actions are listed on ex-date basis on charts. We have added news to inform of all key events related to the company (which is in-house and also includes corporate actions). Will try to enhance that further in upcoming builds.
  2. Yes, results are currently not shown as events on charts. The primary reason behind adding events in this manner on charts is to note sudden changes in price (due to dividends) or marking dates of adjustment (for corporate action). Results will be added separately, with an option to turn them off.
2 Likes

Thanks for your reply. Another feedback is -

Now the watchlist has got very less space and adjusting it everytime is not feasible. Even if we turn off news from the settings, the scrip details section is covering more area, leading to manual adjustment every time.

If you can do something like saving the layout, it will be more useful.

Corporate actions are being shown already by tradingview in their charts.

Hey @sri1647

We do save the layout. If you just minimise both of these and click on ‘Save’ under layouts, this will be stored and you won’t have to do it every time.

1 Like

thanks, it’s working.

Hi,

This feature works in an erratic way. See the image below:

On Monthly, Weekly and hourly charts “Bonus” icon is not appearing while Daily, 15 and 5 min has that icon.

Sometimes, it keeps appearing when no such event is there. And when we click on that it disappears!

EDIT 1 @ 16-07-2025 18:36

Now see. the dividend appeared on daily chart which wasn’t there in the morning and is still not there on Monthly and Weekly.

How to rely on this data?

Is it possible to include earnings in the chart as shown in tradingview.
This is very important since earnings are volatile days and investor can make an informed decision before that day instead of being taken by surprise.

Hello @Shally

Will try and replicate this scenario. For monthly and weekly, will have to check the behaviour.

@Bhasky.R yes, it is on plan. Will definitely take it up soon.

How to Hide Dividend , Split and Bonus symbol from Dhan TradingView chart … Its looks ugly …

Hi @Stock_Q_A, Just click on user settings > untick show corporate actions > click OK and refresh the page.

1 Like

Thank you for quick response

1 Like