Dear Traders,
At Dhan, we have loved building for Traders through our journey. We have introduced features, products and platforms across Orders, Charts, Position, Markets, Analytics and then recently built a full-fledged terminal built grounds-up for Power Traders with DEXT T3.
With our interactions with Traders, we learned that the best trading setups are the ones you spot trends / signals while they are still forming, not after the move is done. That is why we keep adding to what your charts on tv.dhan.co can tell you, so the context you need sits right next to price instead of somewhere else.
But we kept hearing about one gap. You have a stock’s chart open and you are reading its structure. Meanwhile, the stock quietly hits a fresh 52-week high, a Bullish Engulfing prints on the daily, RSI slips into oversold. Unless you are running a separate scan or adding indicator after indicator, you find out late. The chart, the one place where you actually make the call, stays silent.
So we asked ourselves:
Why should signals live in a separate list when the decision happens on the chart?
Introducing: Super Scan Chart Signals
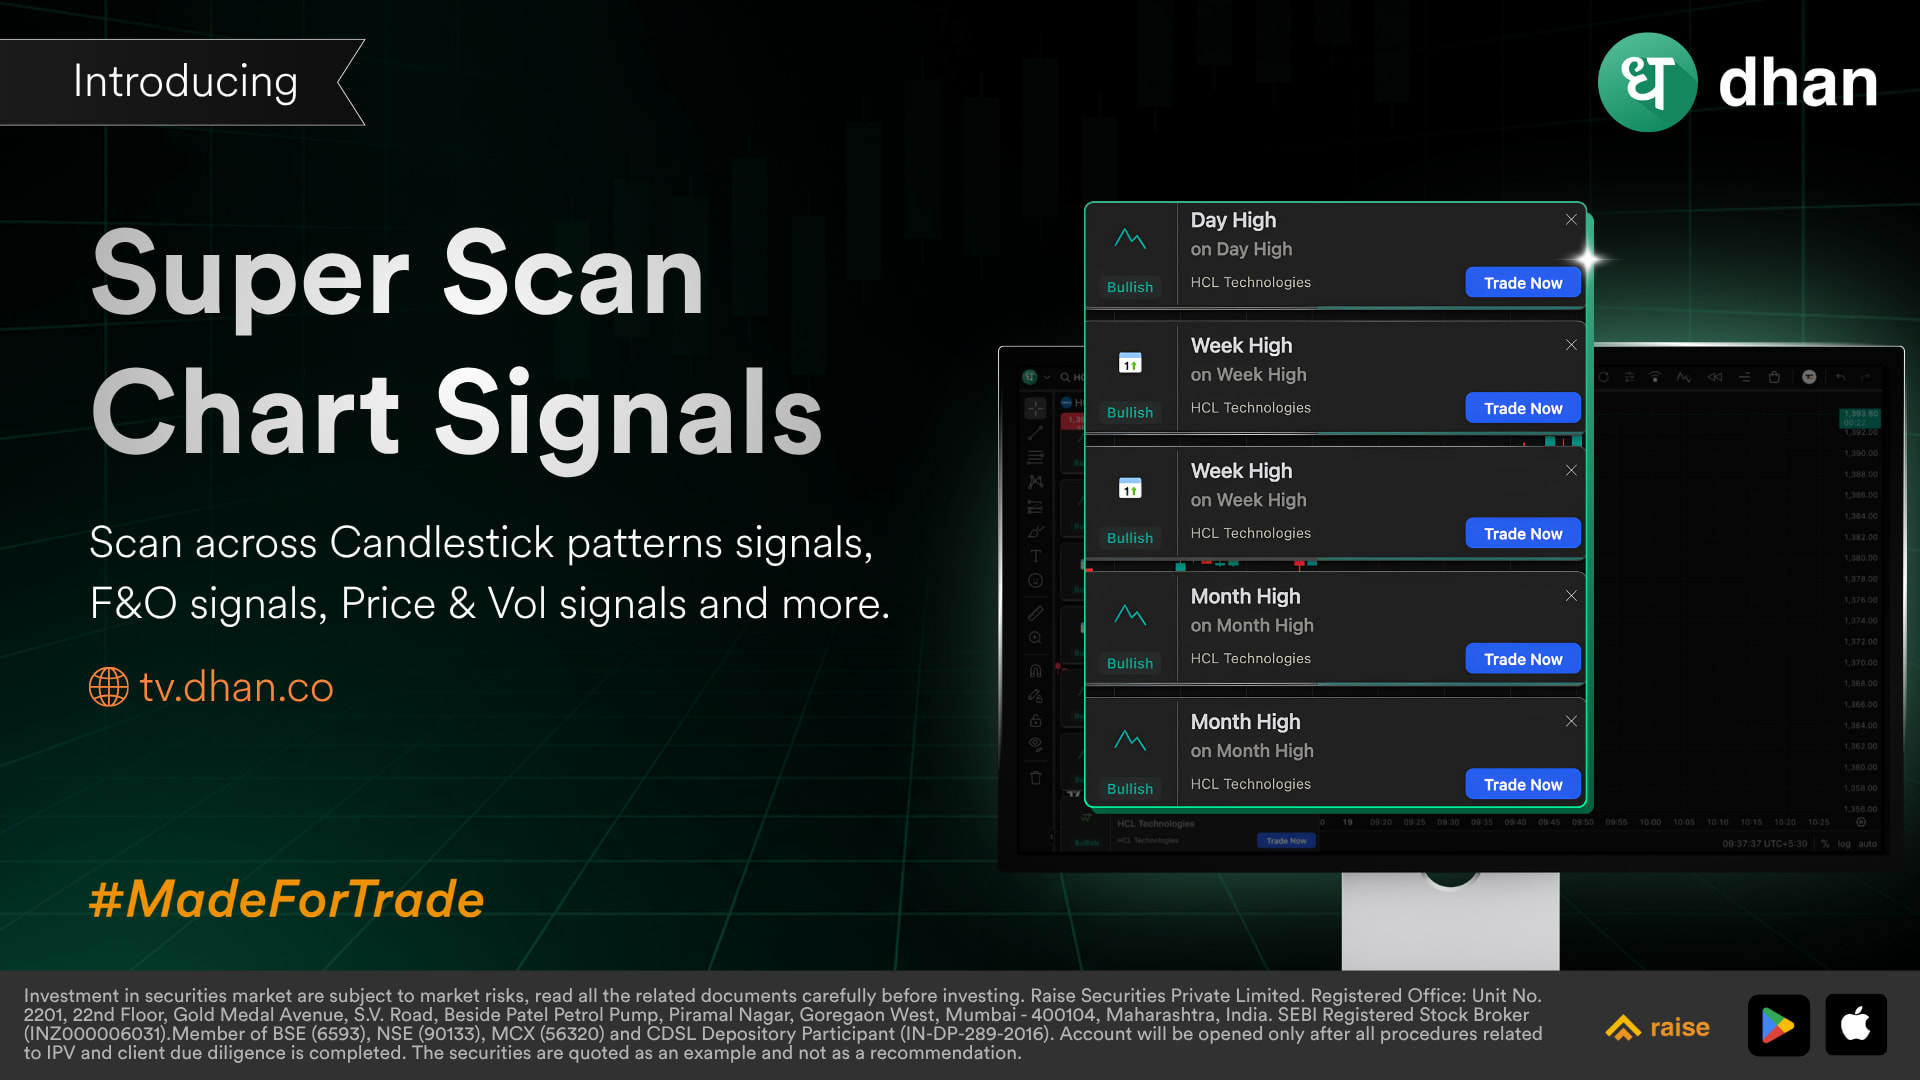
Open any stock’s chart on tv.dhan.co and every signal that triggers for that stock is plotted right on the chart, as and when it fires. Scanner events, technical readings, candlestick patterns and F&O build-ups, all on the same canvas as price.
To make it easier to understand, every signal carries a Bullish, Bearish or Watch tag, so you can read the context at a glance without leaving the chart.
When a signal fires, a card pops up at the bottom of your chart with the signal, the stock and its tag. Hit Trade Now to place an order straight from the card, tap Show more to see the other signals that fired on the stock, or use the settings icon to jump to your signal list.
Chart Signals: What Shows Up on Your Chart
Price & Volume Signals
The levels traders watch the most, flagged the moment price gets there.
-
New Highs & Lows: Day, Week, 2-Week, Month, 3-Month and 52-Week.
-
Near 52W High/Low: When price trades within 1%, 2.5%, 5%, 7.5% or 10% of the 52-week extreme.
-
Pivot Breakouts & Breakdowns: Price crossing above R1, R2, R3 or below S1, S2, S3.
-
Rise & Fall: 1%, 2.5%, 5% and 10% moves off the recent high or low.
-
Volume: Volume Building Up (participation picking up early) and Unusual Volume Spike.
Example: A stock is trading within 1% of its 52-week high and a Volume Building Up marker shows up on the same stretch of candles. That combination is what breakout traders typically keep on their radar.
Candlestick Pattern Signals
17 patterns, detected and marked on the candle where they form: Bullish and Bearish Engulfing, Bullish and Bearish Harami, Three White Soldiers, Three Black Crows, Doji, Hammer, Inverted Hammer, Shooting Star, Hanging Man, Dark Cloud Cover, Piercing Line, Morning Star, Evening Star, Marubozu and Spinning Top.
No more scanning candle by candle to check whether that wick really qualifies as a Hammer.
F&O Signals
For stocks in the F&O segment, positioning shows up alongside price: Long Buildup, Short Buildup, Short Covering and Long Unwinding on 1-minute data, plus Max Pain shifts and futures premium/discount changes.
Example: Price pushes higher while a Short Covering signal appears. That tells you the move is shorts exiting rather than fresh longs entering, which is useful context before you read too much into the rally.
You Decide What Your Chart Shows
A chart full of every possible signal is just noise. So you pick exactly which ones you want to see.
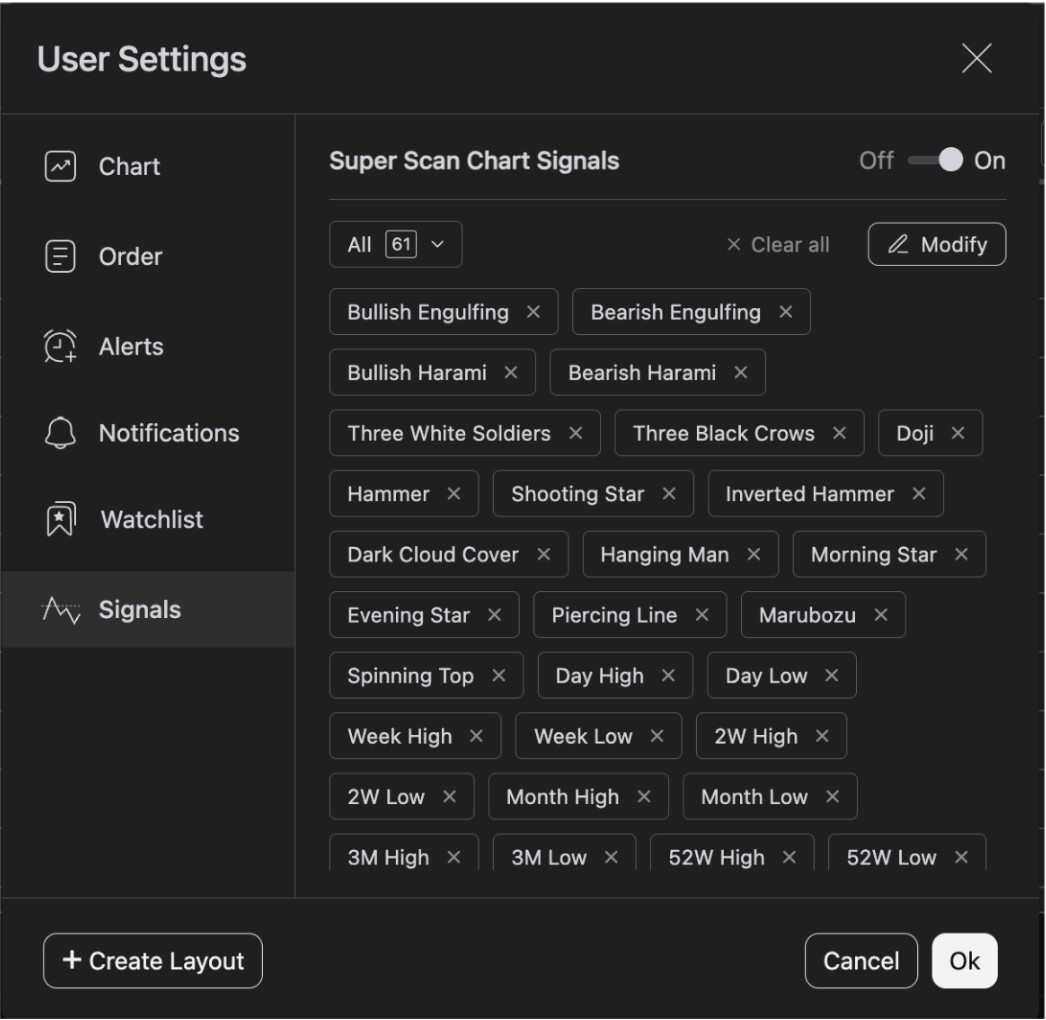
Turn it on or off: One toggle for Chart Signals. Switch it off when you want a clean chart and back on when you want the signals.
Filter by category: The dropdown lets you view signals by type so you are not hunting through the full list.
Remove what you don’t use: Hit the × on any signal to drop it. Clear all wipes the slate if you want to build your list from scratch.
Add signals back: Tap Modify to pick signals and add them to your chart.
Example: An intraday trader might keep Day High/Low, pivot breakouts and volume signals, while a positional trader might keep 52-week levels, Golden/Death Cross and SuperTrend flips. Same chart, two very different setups.
Real-Time Scanner for All Stocks
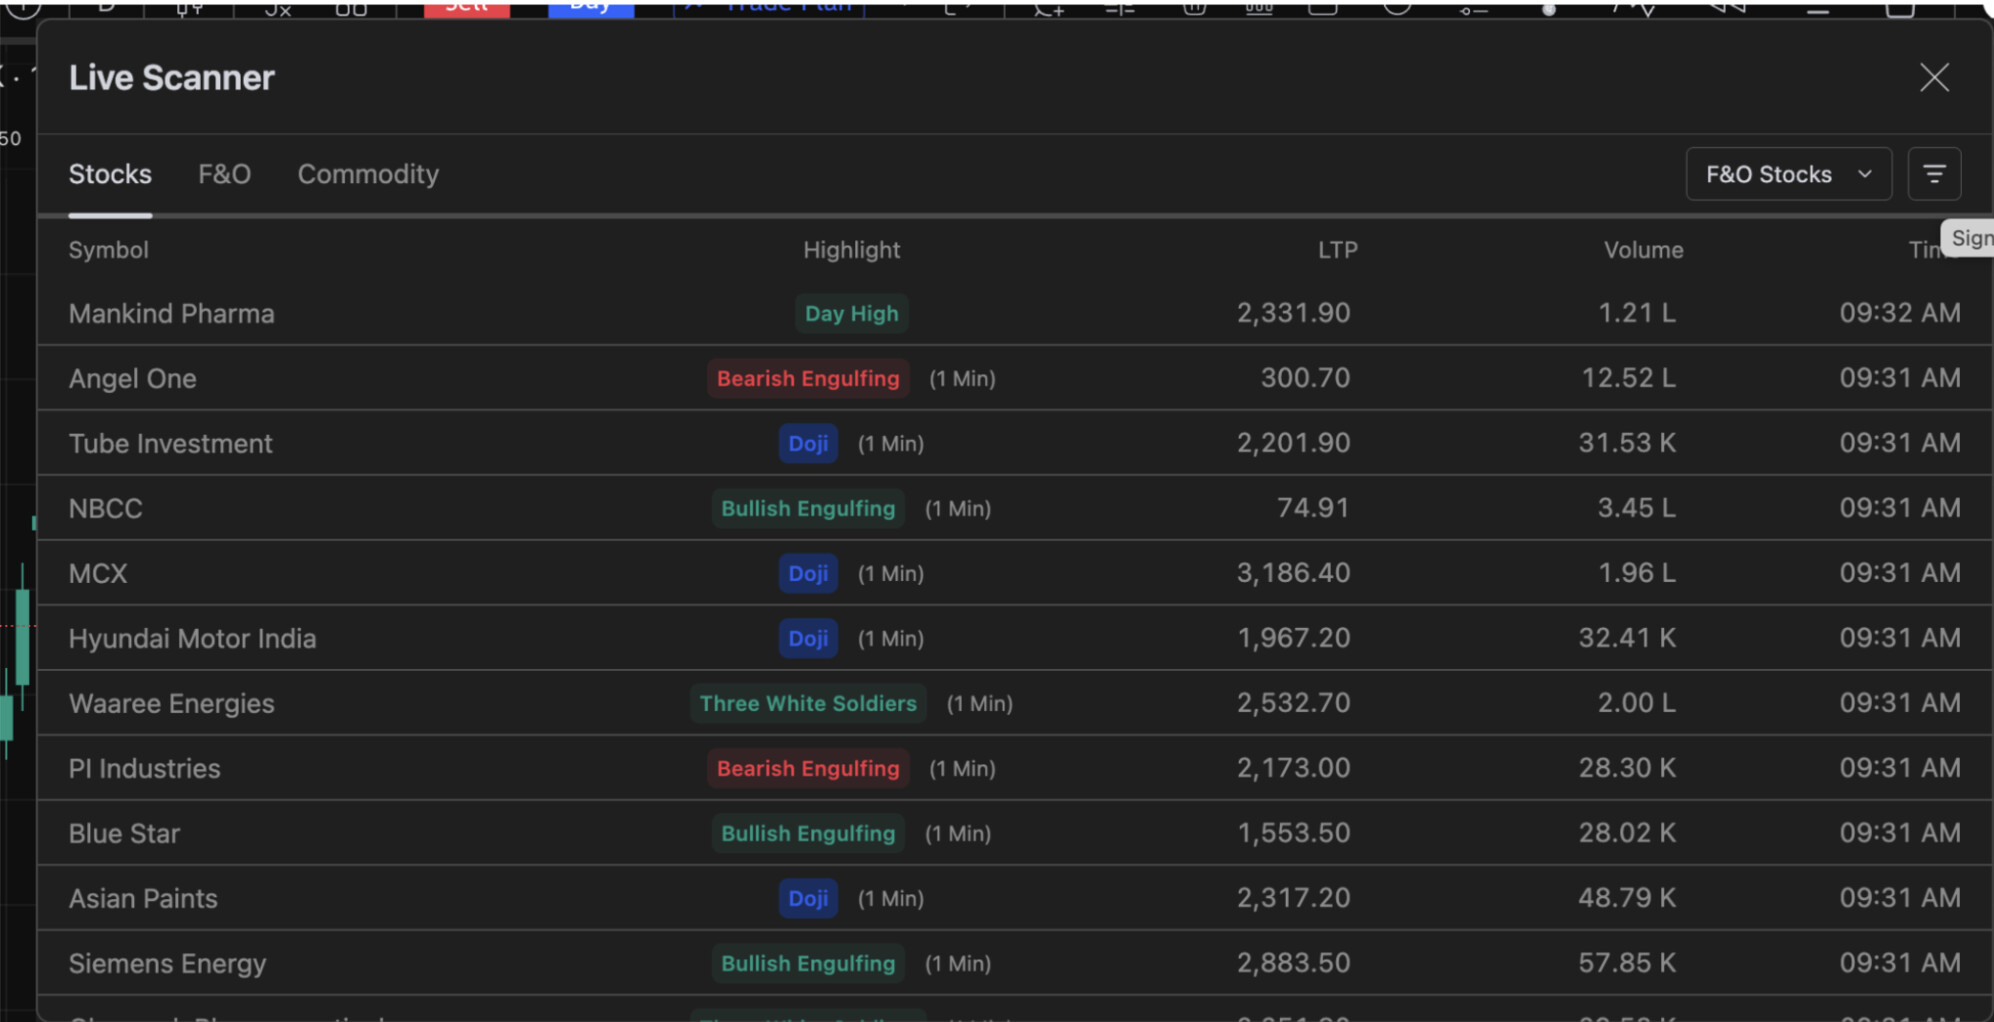
Spotted a signal on one chart and want to see which other stocks are showing the same setup right now? Click the Chart Signals icon (the zig-zag line) in the top toolbar of your chart. It opens a real-time scanner across all stocks, with separate tabs for Stocks, F&O and Commodity and a filter to narrow the universe, such as F&O Stocks. You go from one signal on one chart to every stock flashing it, without leaving tv.dhan.co.
A Quick Note on Reading Chart Signals
Signals give you context, not trade calls. The Bullish, Bearish and Watch tags describe what a condition typically indicates, not what price will do next.
RSI can stay overbought for long stretches in a strong uptrend, and a candlestick pattern carries more weight when it lines up with a level you already care about. Use signals alongside your own setup and risk plan.
How to Get Started
SuperScan Chart Signals is now live on tv.dhan.co. Head to tv.dhan.co and open the chart of any stock. Signals will start plotting as and when they trigger.
To choose your signals, go to User Settings → Signals → Chart Signals, switch the toggle On and tap Modify to set your list.
Give it a spin and tell us which signals you ended up keeping on your chart, and which ones you would like us to add next.
Happy Trading!
Bhavya