I am facing an issue with horizontal lines drawn on charts in a multi-chart layout.
For example, I have a 3×3 chart layout:
-
In the first chart, I open 22050 CE and draw a horizontal line at 130.
-
When I open the same 22050 CE in the second chart, the horizontal line drawn in the first chart is not visible.
-
If I change the strike in the first chart to a different one and then reopen 22050 CE, the previously drawn horizontal line at 130 appears.
It seems that drawings are not automatically synchronised across multiple chart instances displaying the same instrument.
Expected Behaviour: When the same instrument is opened in multiple charts within the same layout, all drawings (horizontal lines, trendlines, rectangles, etc.) should automatically sync across those charts.
One more point: This functionality works as expected in competing platforms like Angel One and Upstox. I don’t face this issue there. It would be great if Dhan could provide similar drawing synchronisation functionality.
Please look into this issue and improve the multi-chart drawing experience.
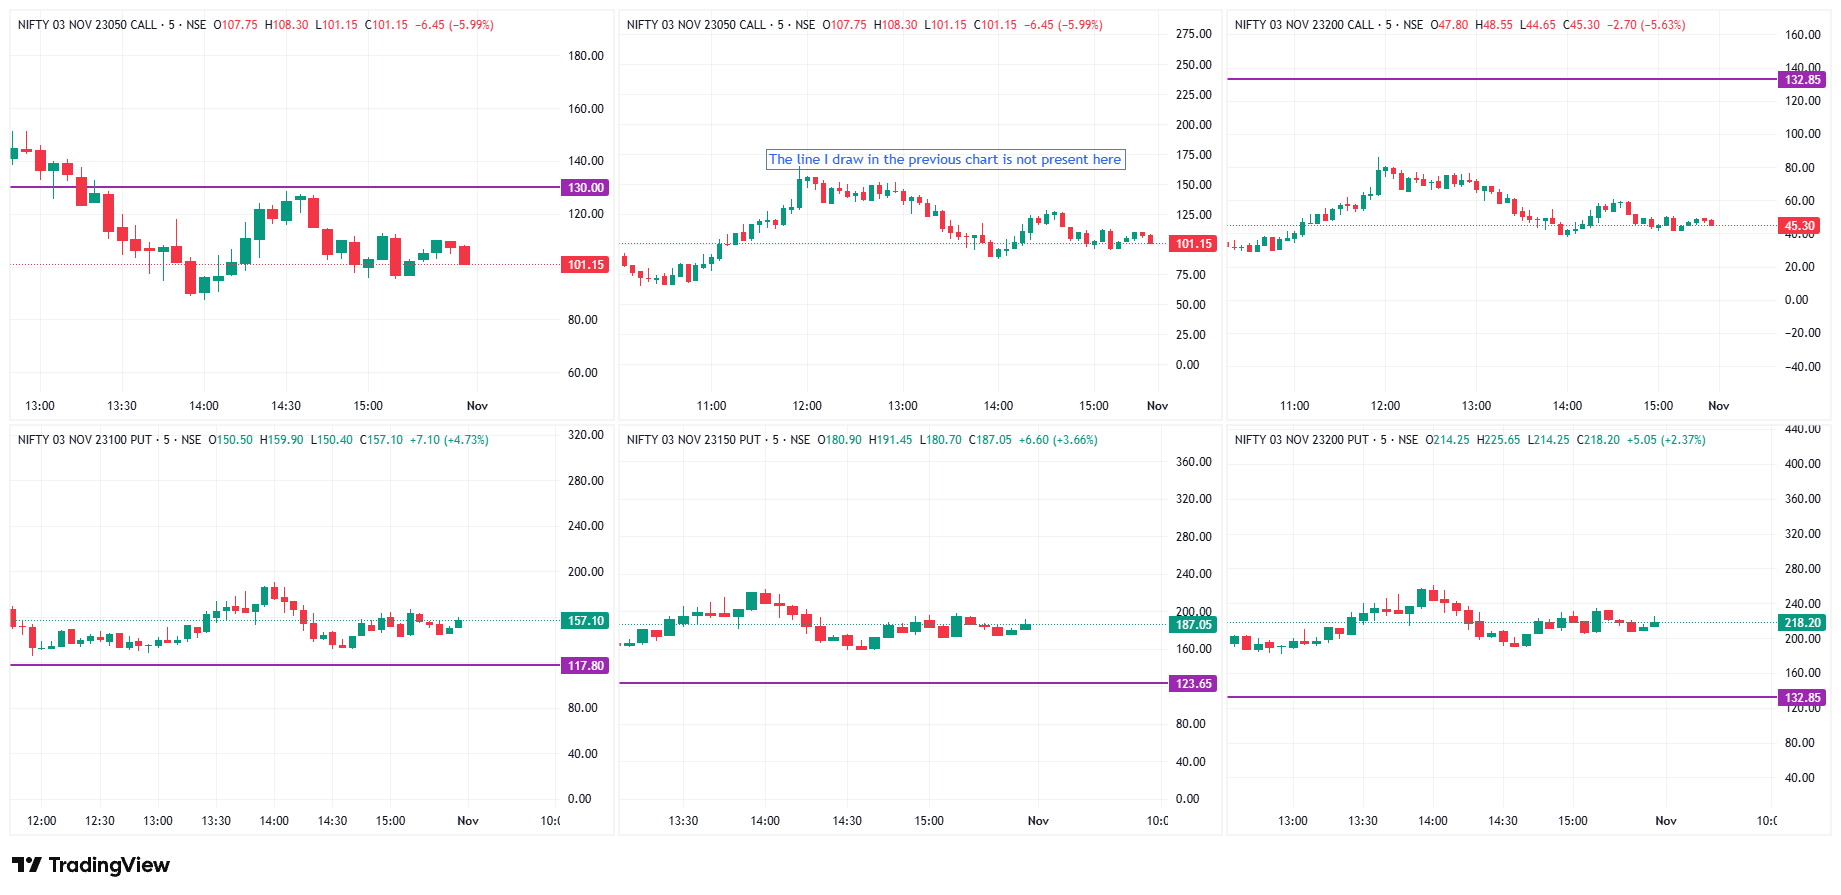
This is a known limitation stemming from how the embedded TradingView Charting Library manages drawing state across multi-chart layout panes.
By default, drawings (horizontal lines, trendlines, ray lines) are bound to the local chart instance ID (chartId) within the grid, rather than automatically broadcasting across all grid cells.
Here is why this happens and how to sync drawings across panes:
-
Enable ‘Sync in Layout’ in Left Toolbar:
On the left-hand drawing toolbar (near the bottom, above the trash can icon), look for the Drawing Tools options menu. Click on the multi-chart sync icon and select “Sync drawings to all charts” (or toggle “Sync in layout”). Once active, any horizontal line drawn on a specific strike/symbol will automatically mirror to any other pane in your 3×3 grid that shares the identical symbol ticker.
-
Manual Layout Save Latency:
When you draw a line on Chart 1, the local state is held in the iframe memory until the layout auto-saves to Dhan’s layout cloud server (which runs on a throttled debounce interval). If you switch Chart 2 to that strike immediately before Chart 1 has committed its state, Chart 2 loads the cached layout from the previous save. Manually clicking the Save Layout button (cloud icon on the top header) forces an immediate write.
-
Exact Symbol/Contract Token Matching:
Keep in mind that options contracts are treated as distinct individual securities by the data feed. If Chart 1 is on the current weekly expiry (e.g. 05-Nov 22050 CE) and Chart 2 accidentally opens the monthly expiry or next week’s expiry of the same strike, TradingView will consider them distinct symbol tokens and will not project the horizontal lines across them.