Dear Dhan Support Team,
I would like to report a high-priority issue with the ITC (ITC Ltd.) monthly chart on the Dhan platform.
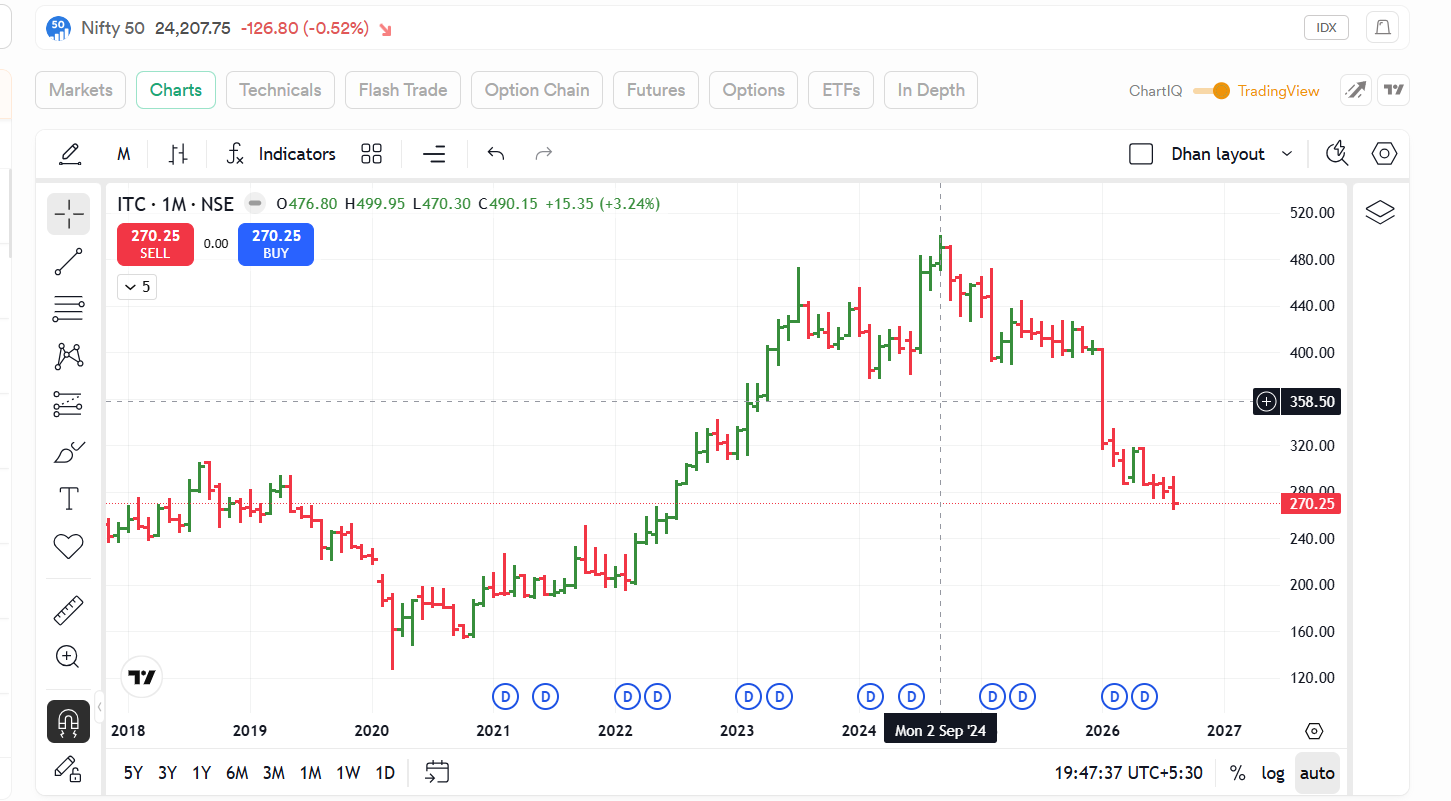
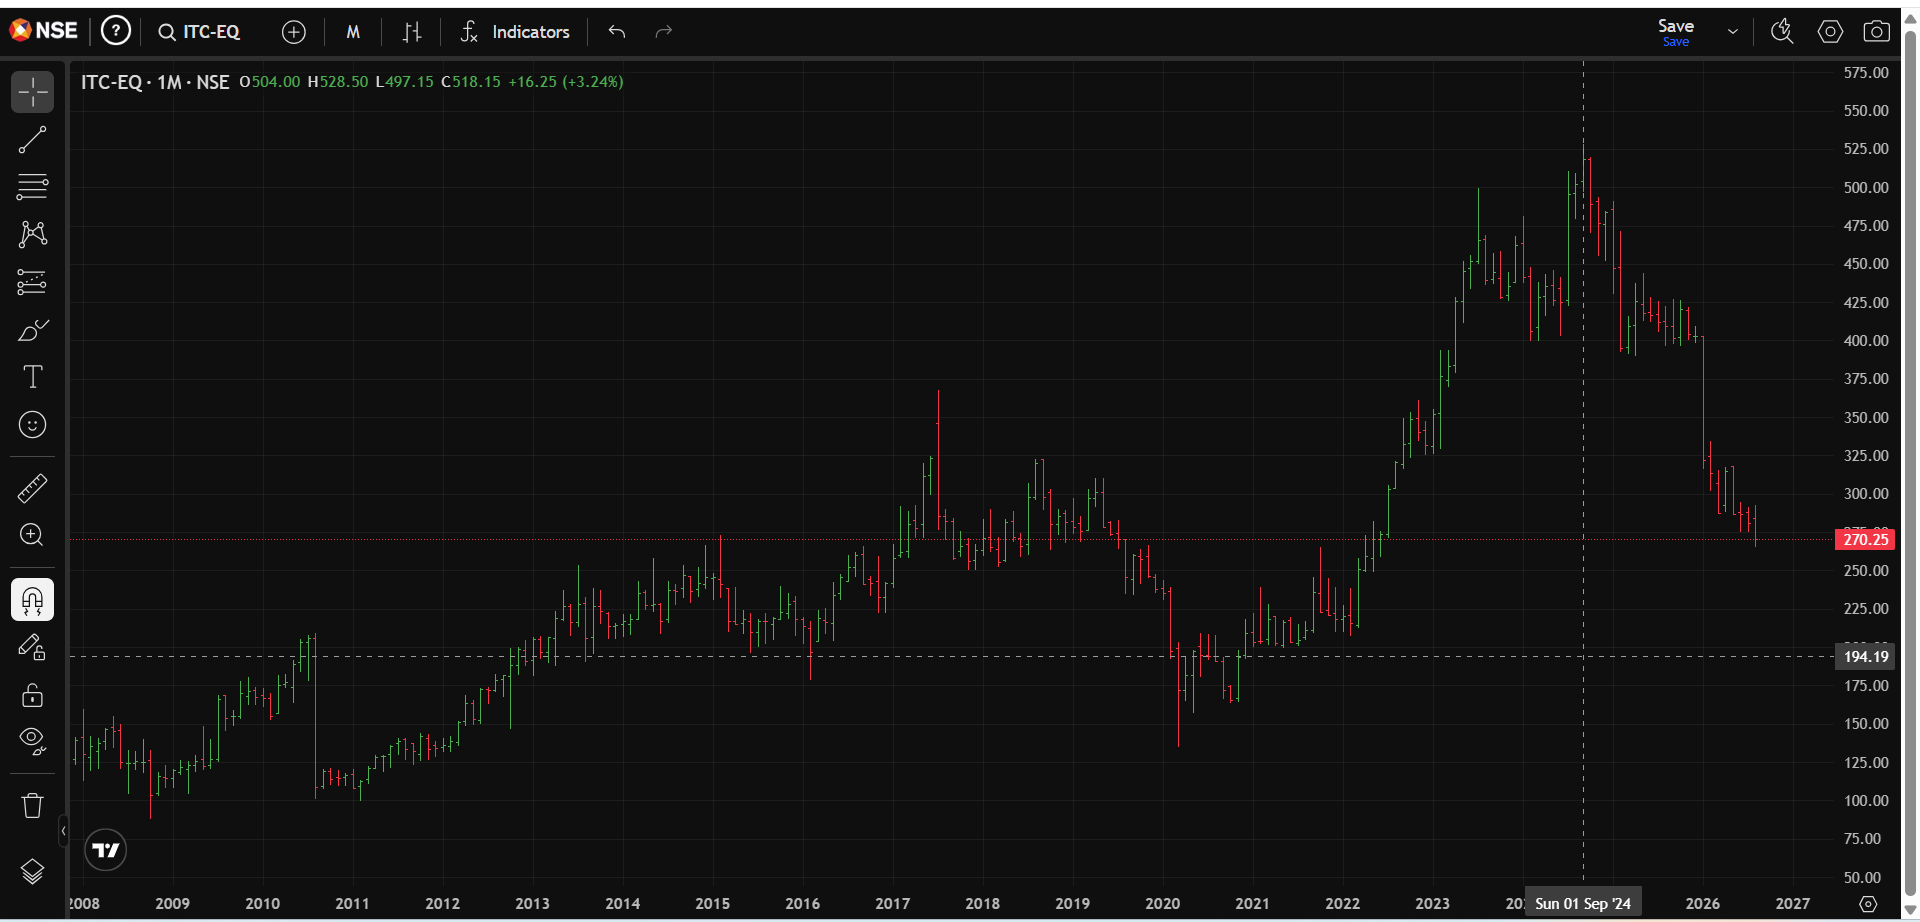
I compared the ITC monthly chart on Dhan with the official NSE chart/data, and I noticed significant discrepancies in both the candle dates and the High prices. The difference in price is substantial and does not appear to be a normal chart-display variation.
I have also observed that the High price shown on the monthly chart does not appear to correspond accurately with the underlying prices seen on other timeframes. This raises concerns about the way the monthly OHLC data is being aggregated or adjusted.
Could you please investigate the following on priority:
- Whether the monthly candle dates are being aligned correctly with NSE trading sessions.
- Whether the monthly High is correctly calculated from the actual daily High values for that month.
- Whether any corporate-action adjustments are causing discrepancies between timeframes.
- Whether the same underlying NSE price data is being used consistently across all timeframes.
- Whether the issue is specific to the chart display or also exists in the underlying OHLC data/API.
Since this concerns historical OHLC prices and could potentially affect technical analysis and trading decisions, please treat this as a top-priority data accuracy issue and confirm the root cause.
Please also let me know once the corrected data/chart has been verified.