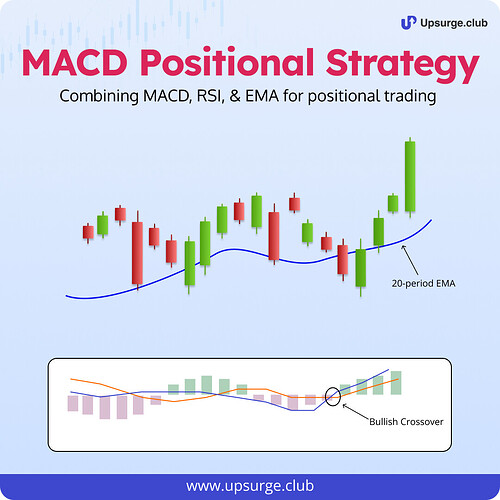
The MACD is a trend-following momentum indicator that shows the relationship between two moving averages of a stock’s price.
The ‘MACD line’ is the difference between a stock’s 26-day and 12-day exponential moving averages (EMA). A 9-period EMA of the MACD line is also plotted, known as the ‘signal line’. It can be interpreted as follows:
![]() A buy signal is generated when the MACD line crosses above the signal line.
A buy signal is generated when the MACD line crosses above the signal line.
![]() A sell signal is generated when the MACD line crosses below the signal line.
A sell signal is generated when the MACD line crosses below the signal line.
Learn how the indicator is constructed & how it can be used for an effective positional trading strategy in our latest newsletter issue ![]()
Join 4000+ people getting such strategies delivered to their inbox by signing up for Upsurge’s Newsletter
