This scanner is created using stockedge ( paid) is there anyone who can desgin this 2 in free platform…
Here are the details for the two scans you mentioned, along with how to recreate them in Screener.in:
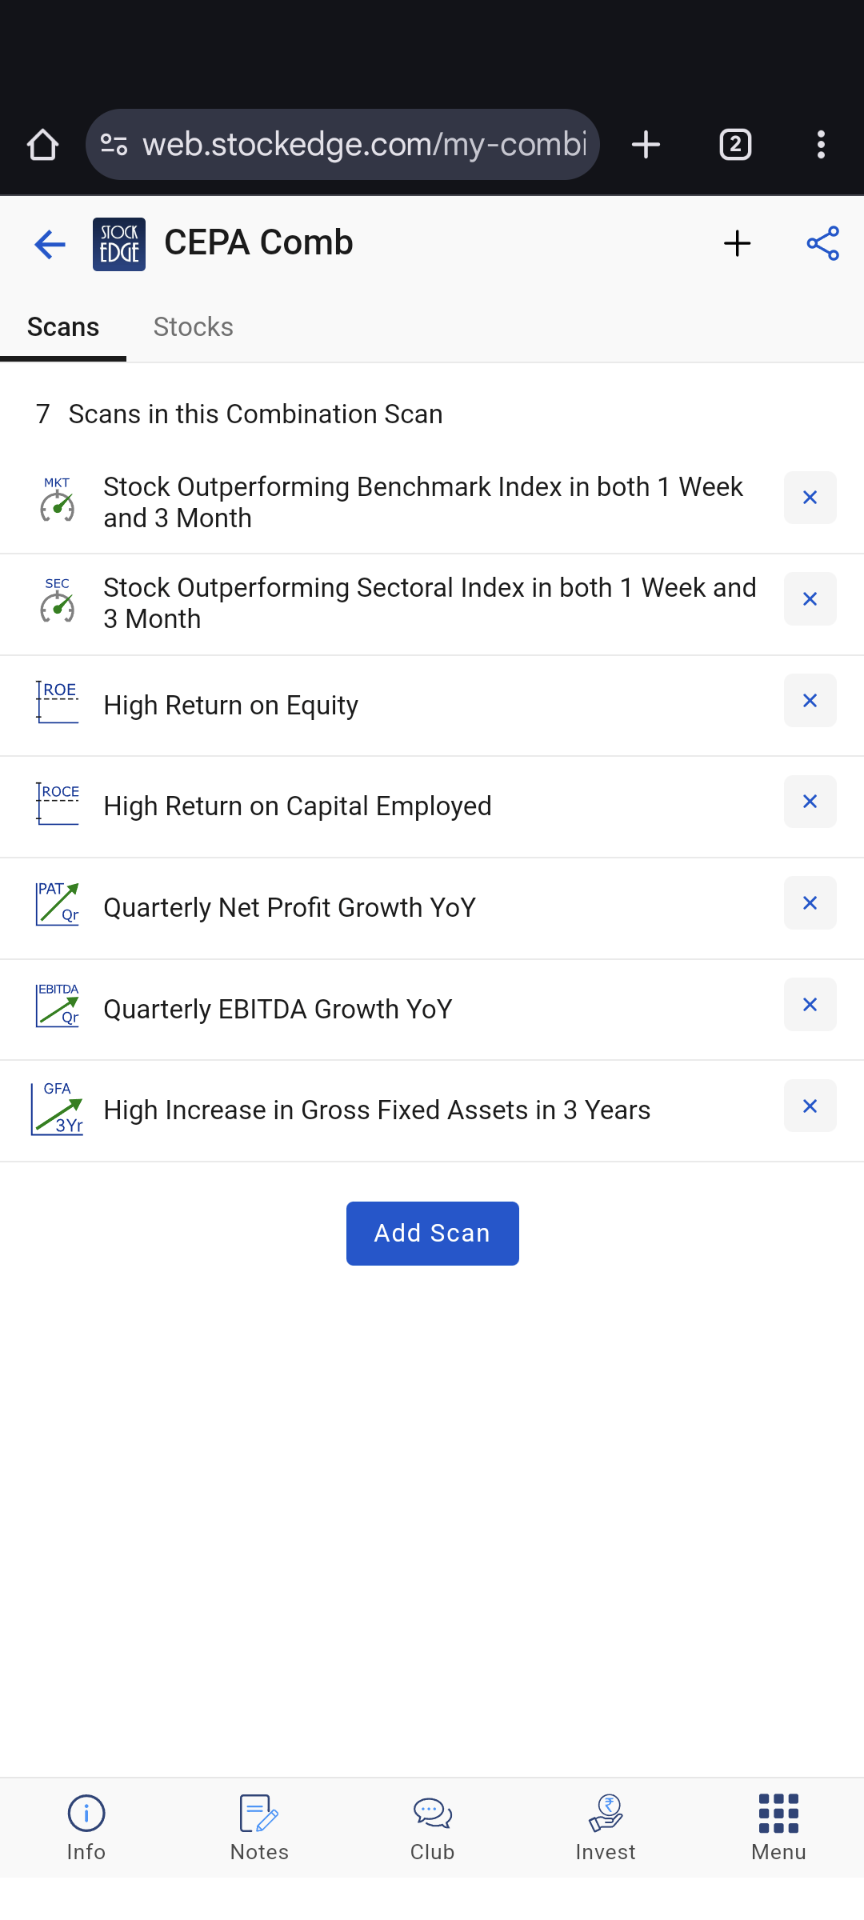
1. CEPA Comb Scan
- Stock Outperforming Benchmark Index in both 1 Week and 3 Month
- Look for stocks that have consistently outperformed the market benchmark over 1-week and 3-month periods.
- Stock Outperforming Sectoral Index in both 1 Week and 3 Month
- Stocks should outperform the sector index over the same time frames.
- High Return on Equity (ROE)
- Companies with high ROE, indicating strong profitability in relation to shareholder equity.
- High Return on Capital Employed (ROCE)
- Identifies efficient capital usage with a high ROCE value.
- Quarterly Net Profit Growth YoY
- Look for companies showing year-on-year growth in quarterly net profits.
- Quarterly EBITDA Growth YoY
- Focus on companies with positive year-on-year growth in quarterly EBITDA.
- High Increase in Gross Fixed Assets in 3 Years
- Companies with a significant increase in gross fixed assets over a three-year period, indicating expansion or investment in assets.
Screener.in Scanner Code for CEPA Comb:
Price to Market Index 1 Week > 1
Price to Market Index 3 Month > 1
Price to Sector Index 1 Week > 1
Price to Sector Index 3 Month > 1
Return on equity > 15
Return on capital employed > 15
Quarterly Profit YoY Growth > 15
Quarterly EBITDA YoY Growth > 15
Increase in Gross Fixed Assets 3Years > 25
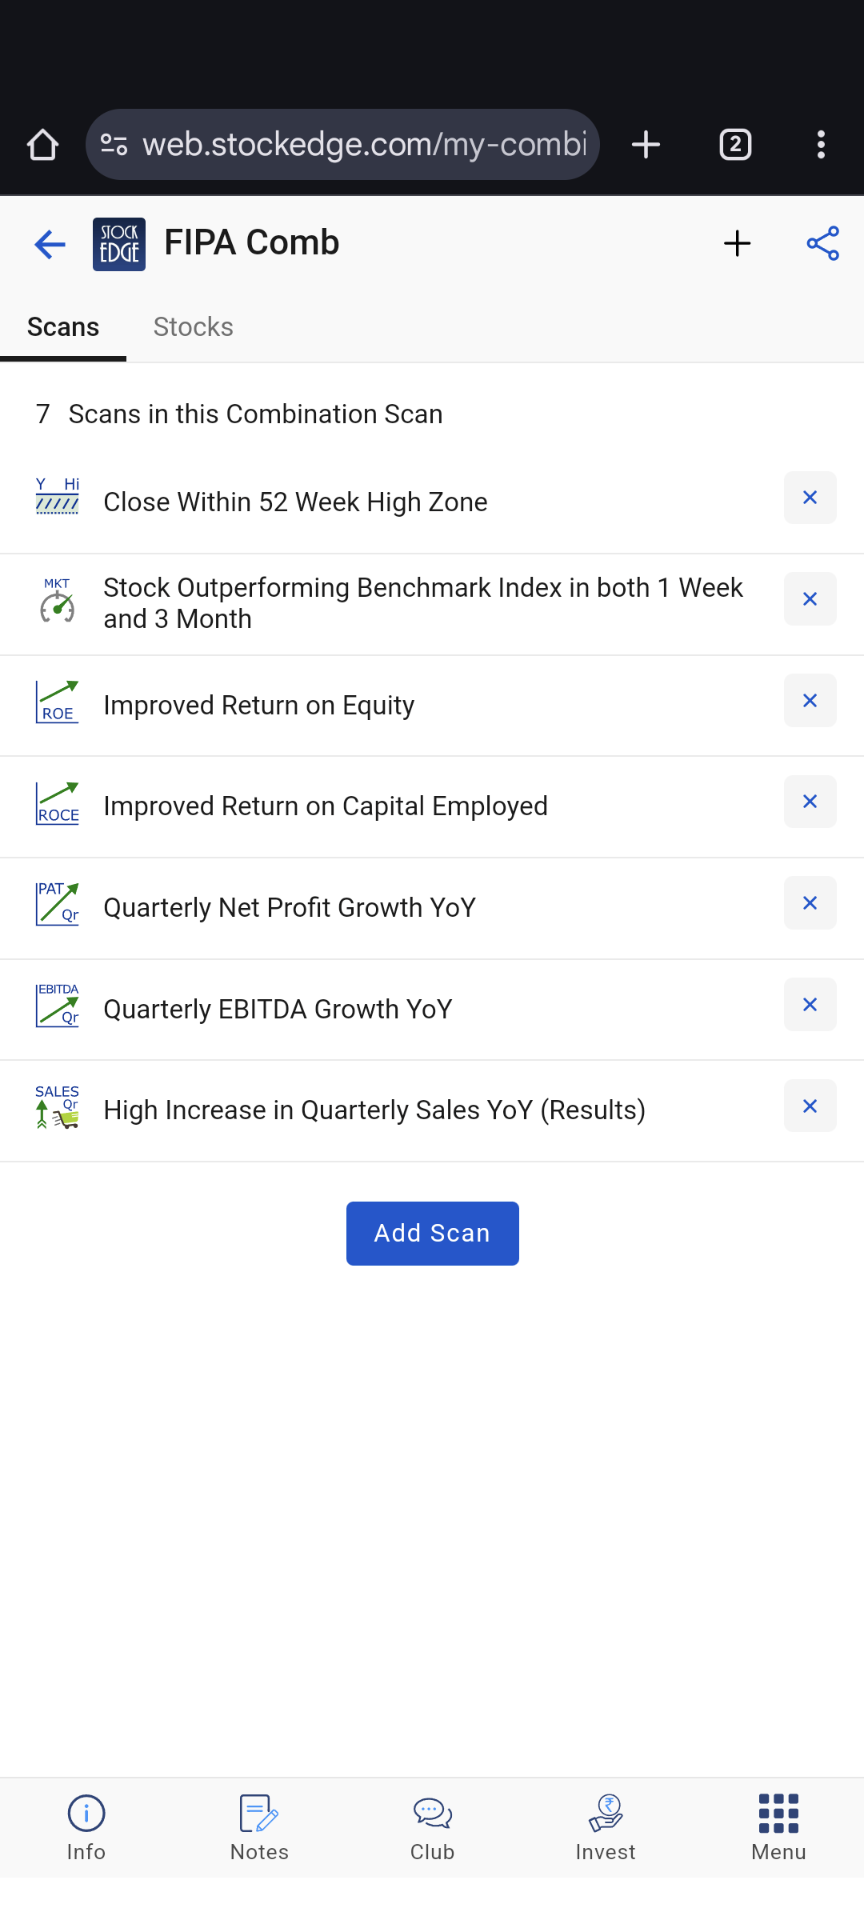
2. FIPA Comb Scan
- Close Within 52 Week High Zone
- Stocks trading close to their 52-week high levels.
- Stock Outperforming Benchmark Index in both 1 Week and 3 Month
- Similar to CEPA, stocks outperforming the market benchmark over 1-week and 3-month periods.
- Improved Return on Equity (ROE)
- Look for improvement in ROE over time, signaling better profitability.
- Improved Return on Capital Employed (ROCE)
- Identifying companies with improved capital efficiency over time.
- Quarterly Net Profit Growth YoY
- Year-on-year growth in quarterly net profits.
- Quarterly EBITDA Growth YoY
- Year-on-year growth in quarterly EBITDA.
- High Increase in Quarterly Sales YoY (Results)
- Companies with significant YoY growth in quarterly sales.
Screener.in Scanner Code for FIPA Comb:
Price Close within 5% of 52week high
Price to Market Index 1 Week > 1
Price to Market Index 3 Month > 1
Improvement in Return on equity > 10
Improvement in Return on capital employed > 10
Quarterly Profit YoY Growth > 15
Quarterly EBITDA YoY Growth > 15
Quarterly Sales YoY Growth > 20
You can adjust the parameters (like percentages or thresholds) based on your investment criteria. Let me know if you need further customization or if there’s anything else you’d like to include!