Hi everyone,
I’m using the DhanHQ WebSocket API for live market data and noticed a discrepancy.
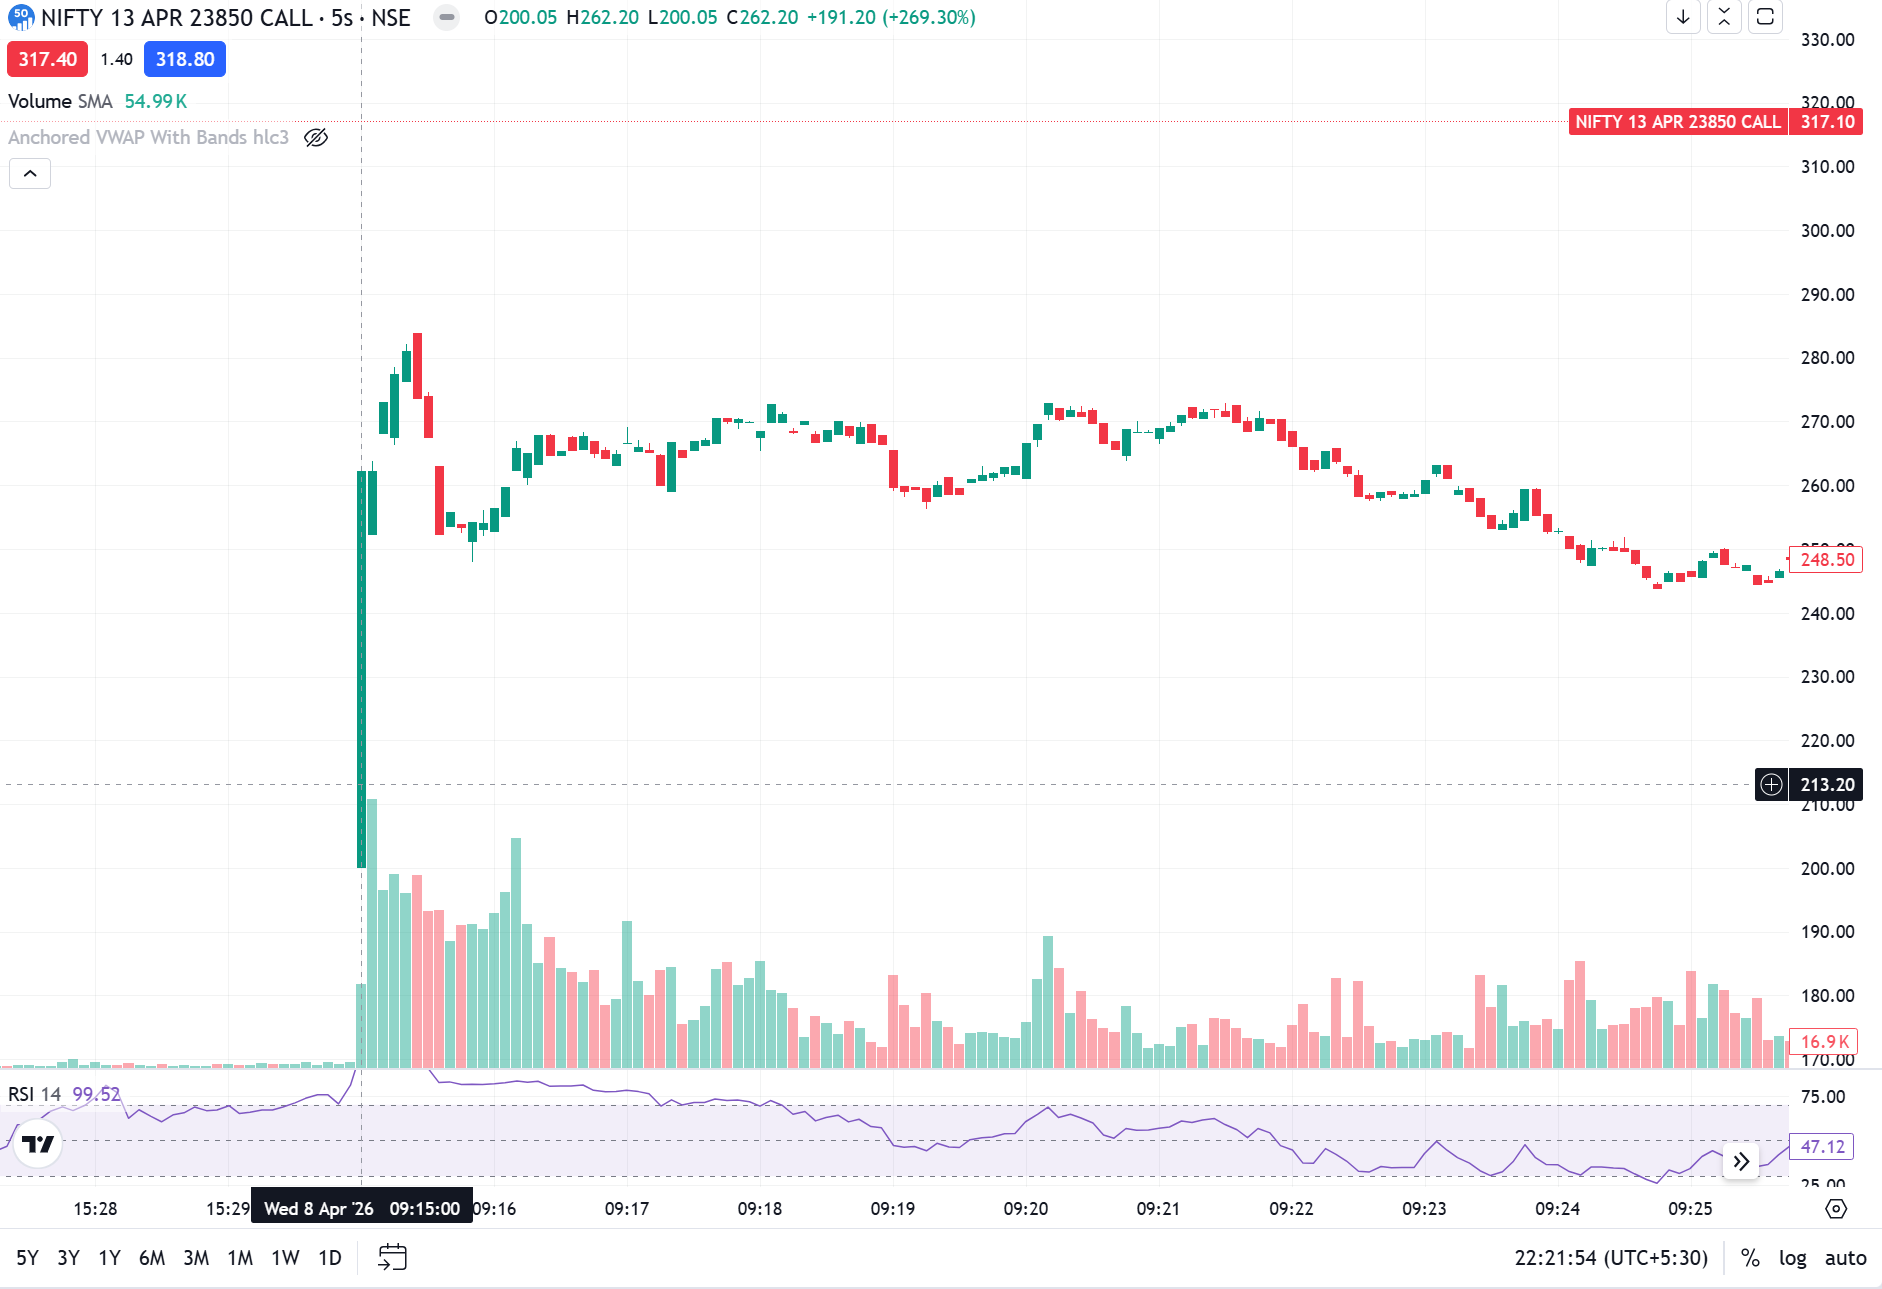
Instrument: NIFTY 13 APR 23850 CE
SID: 54806
Time: Around 09:15 AM
From WebSocket:
- day_high = 291
But on the chart (5-second timeframe):
-
The high of the 09:15 candle is around 262
-
I don’t see any price reaching 291
I have attached:
-
WebSocket log screenshot
-
Chart screenshot
Is this expected behavior?
-
Does day_high include very brief tick spikes not visible on candles?
-
Or could this be a data inconsistency?
Would appreciate any clarification.
Thanks!
{“ts”: “2026-04-08 03:45:05.441”, “event”: “feed_message”, “run_id”: “20260408-033410”, “meta”: {“frame_header”: {“code”: 4, “msg_len”: 50, “segment”: 2, “sid”: 54806, “frame_len”: 50}, “packets_parsed”: 1, “packets”: [{“sid”: “54806”, “code”: 4, “ltp”: 252.1999969482422, “ltq”: 65, “ltt”: 1775639705, “atp”: 257.92999267578125, “vol”: 104585, “day_open”: 200.0500030517578, “day_close”: 64.69999694824219, “day_high”: 291.0, “day_low”: 200.0500030517578}], “chunks”: [{“off”: 0, “frame_total”: 50, “code”: 4, “msg_len”: 50, “segment”: 2, “sid”: 54806, “end”: 50}]}, “payload_b64”: “BDIAAhbWAAAzM3xDQQCZHNZpCveAQ4mYAQCwbQAAiz8DAM0MSENmZoFCAICRQ80MSEM=”, “payload_len”: 50}