@PravinJ @Mohseen_Usmani @Hardik @Naman @RahulDeshpande @Pranita @Prithvi @Sameet @shraddha @Siddhesh_Amrute - Many times i can see for historical data especially for many stock the data is missing always. Will this be sorted out? With these missing data my system backtesting is getting impa
cted heavily. I have just attached the reference of one missing data alone but it is happening for many stocks for many days as well.
Hey @Parthiban_Sub
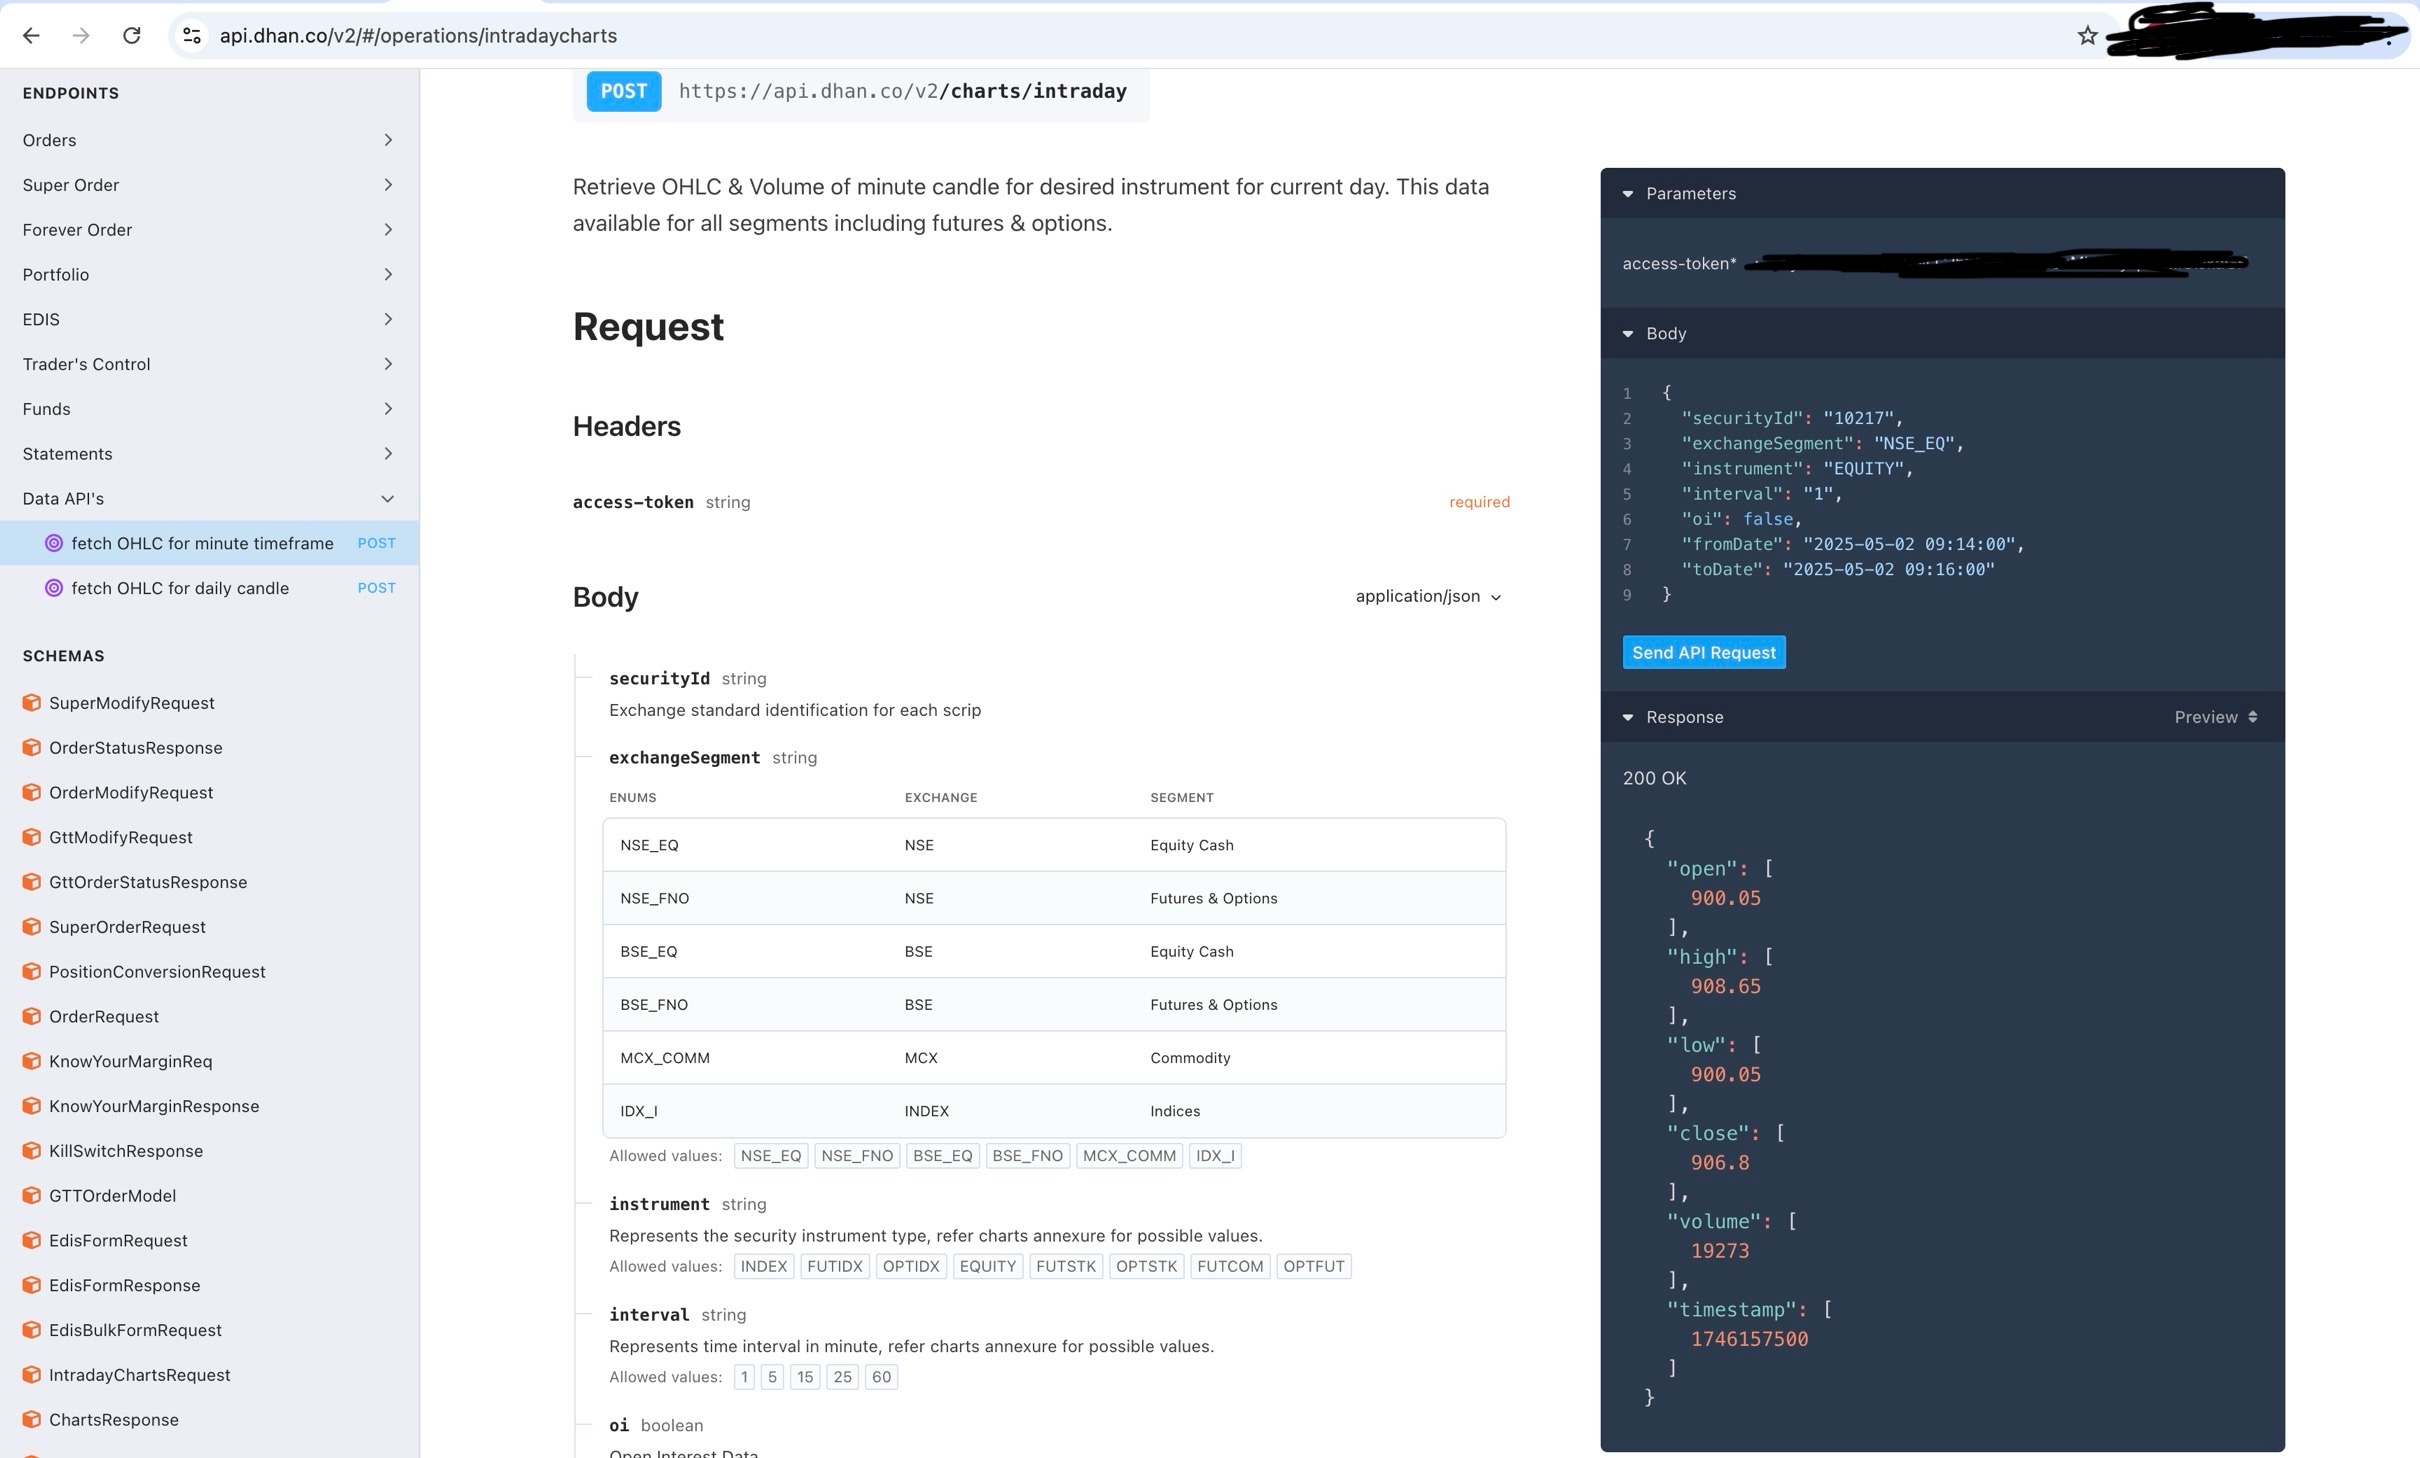
If we look into the first and second screenshot shared by you, I can see that the data being passed is actually correct. Since you are fetching data in 1 min timeframe, you are getting only one response (since you are fetching data between 09:14 and 09:16)
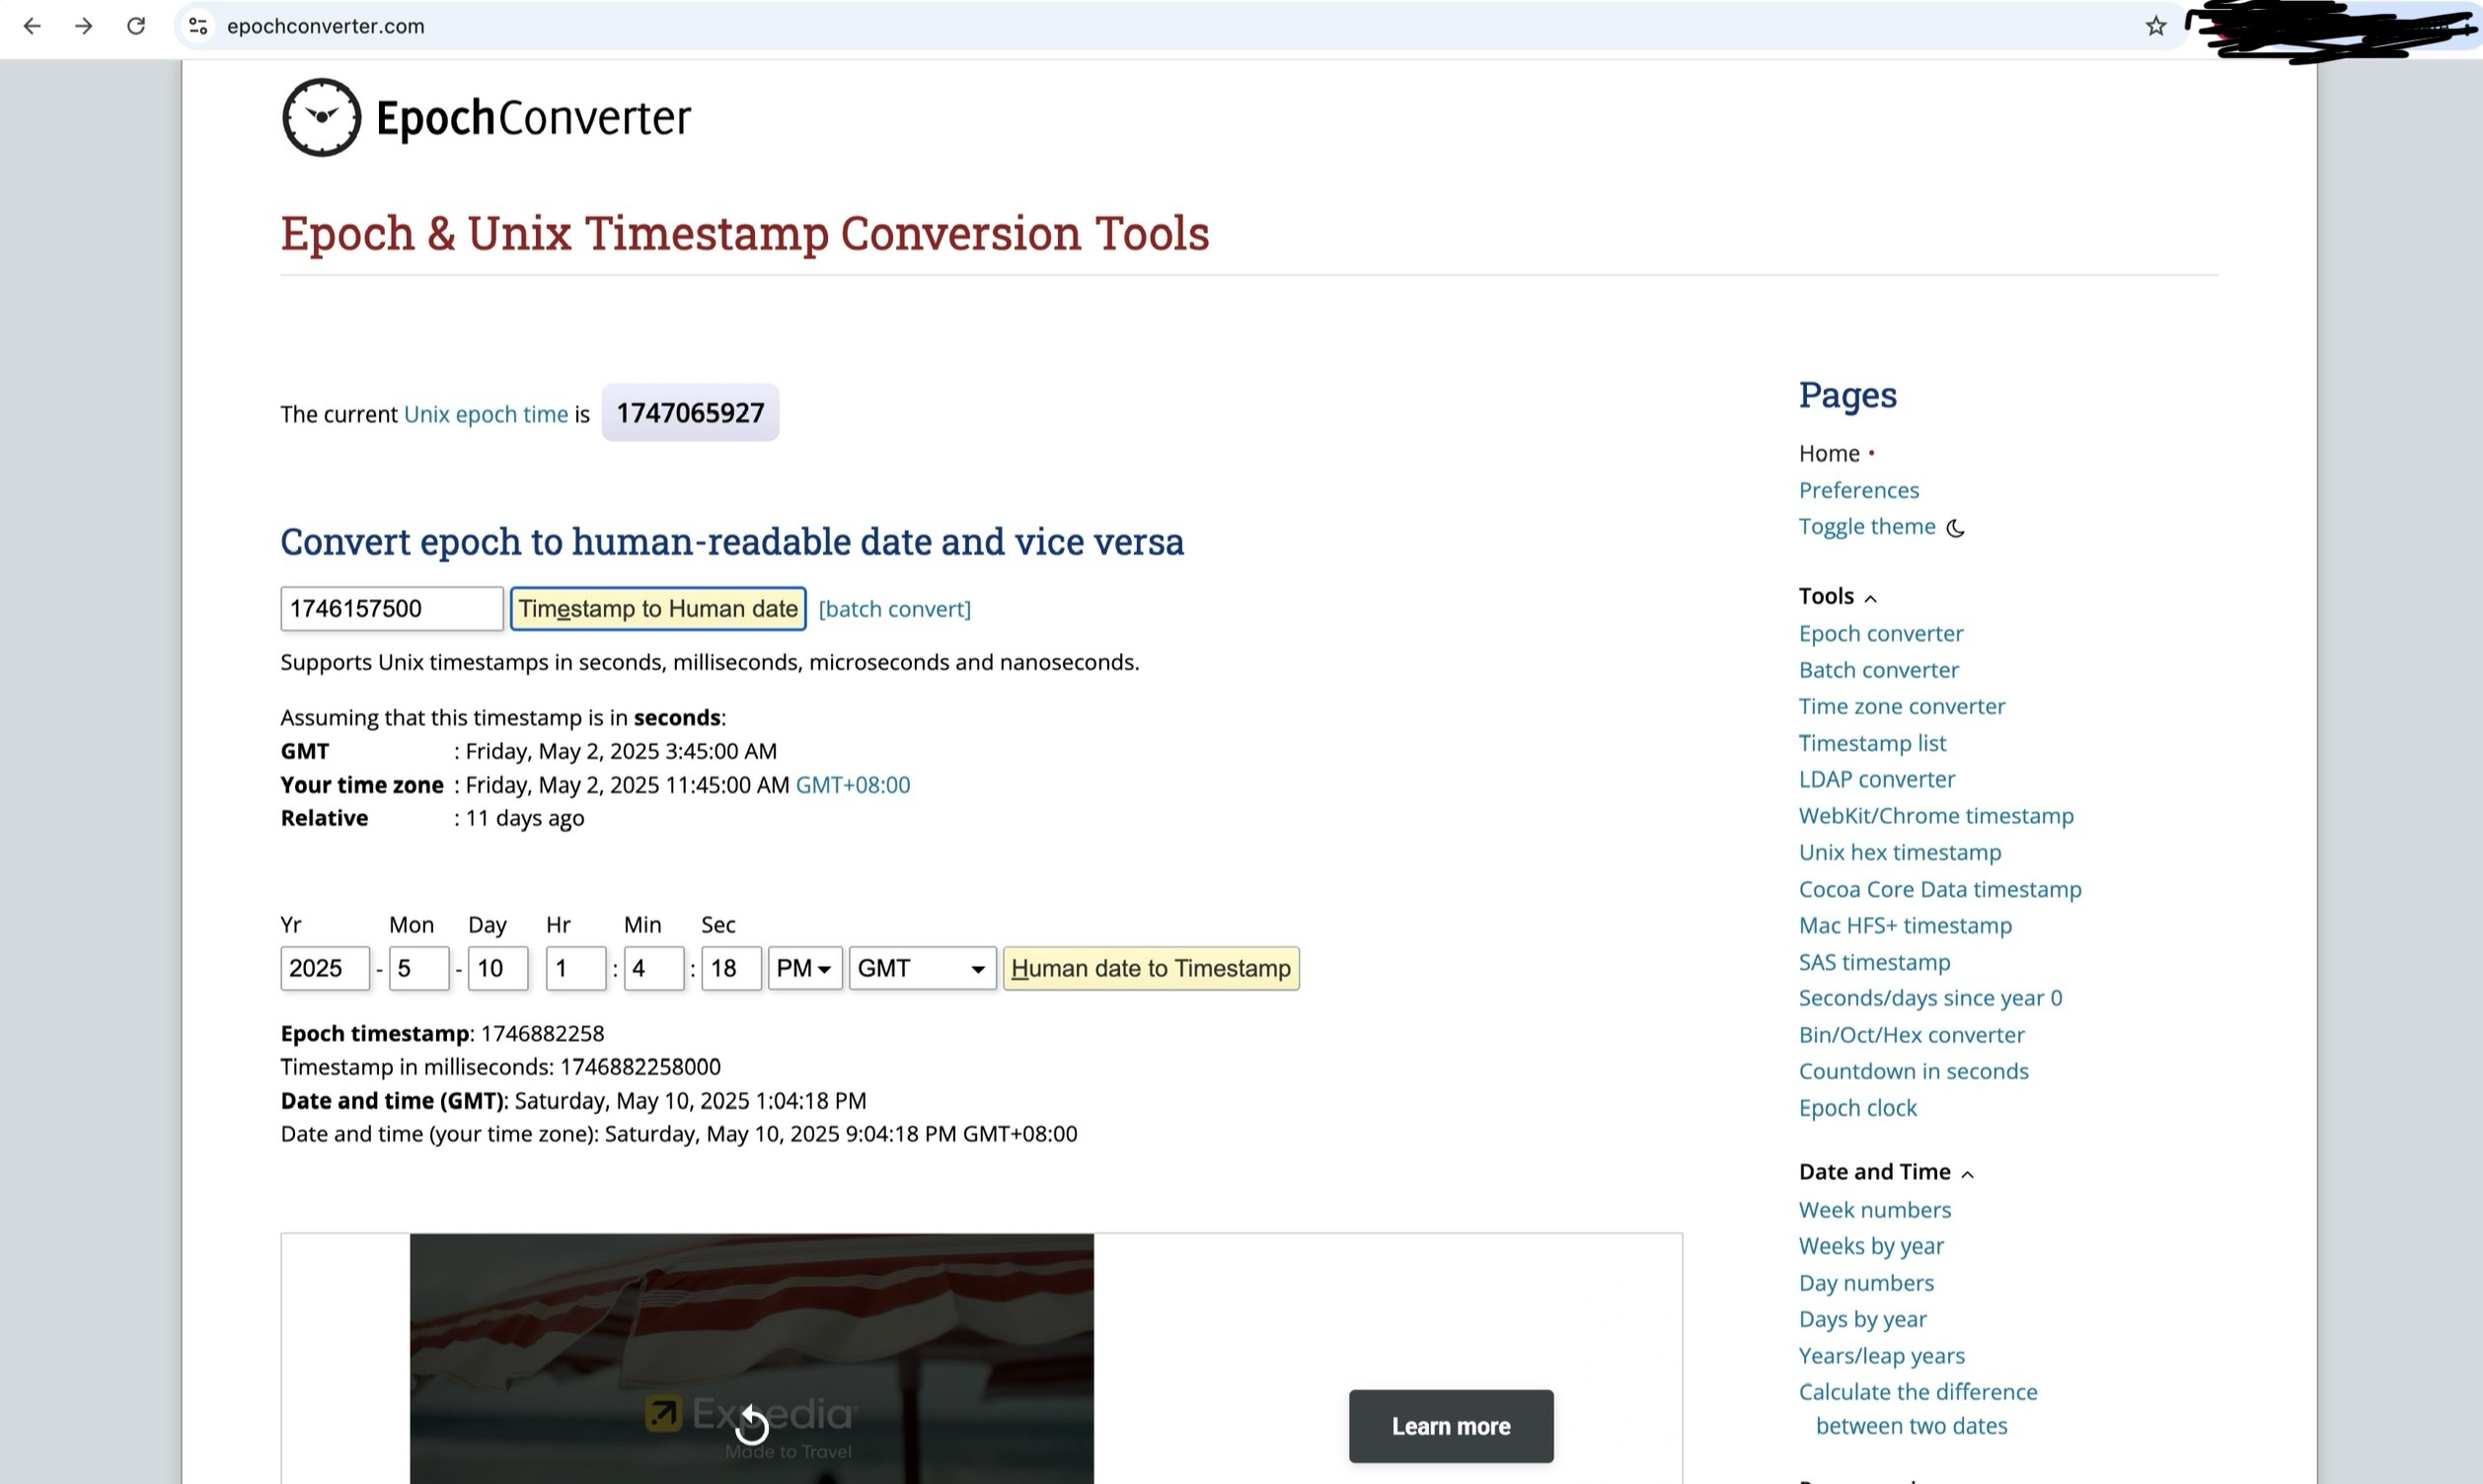
You are getting the GMT time on EPOCH conversion as 03:45:00 AM which when converted to IST is 09:15:00 AM.
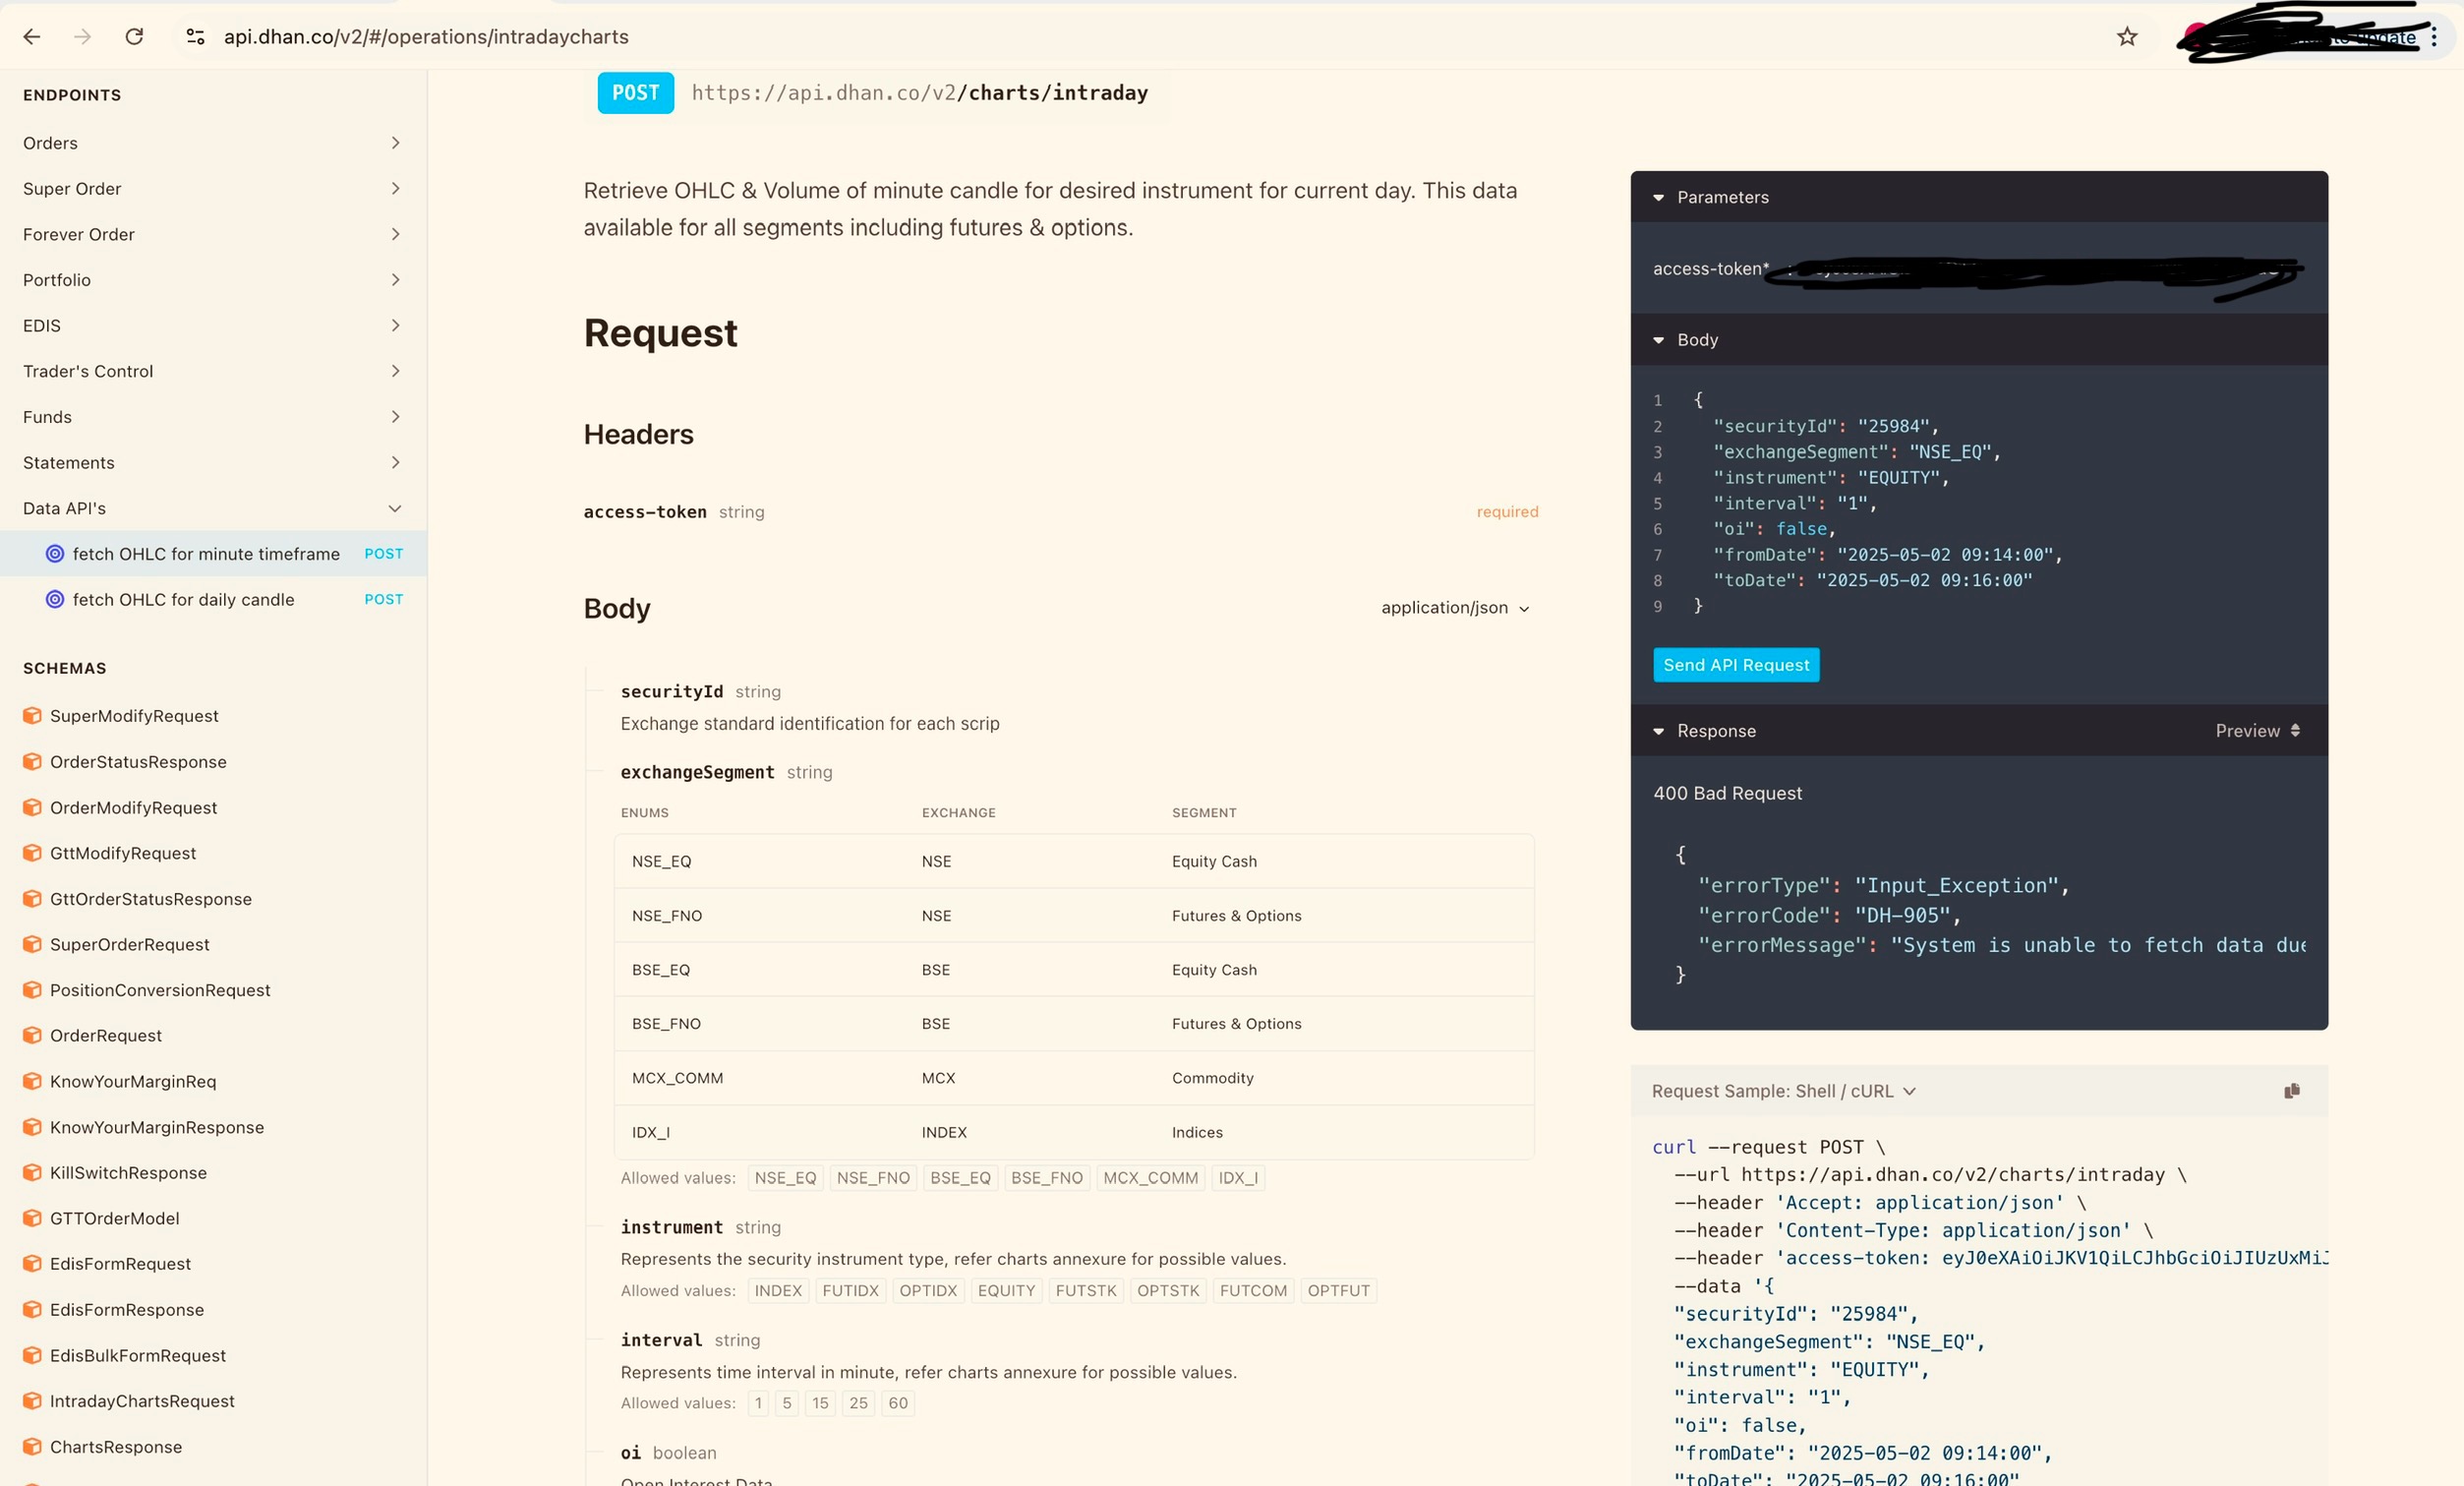
On the third screenshot, do check the validity of Security ID and whether there is data for the same on charts.
Would request you to let us know in case you find any such instances, as the data source for APIs and charts on Dhan remain the same. It is highly unlikely of such instances.
Hey @Hardik,
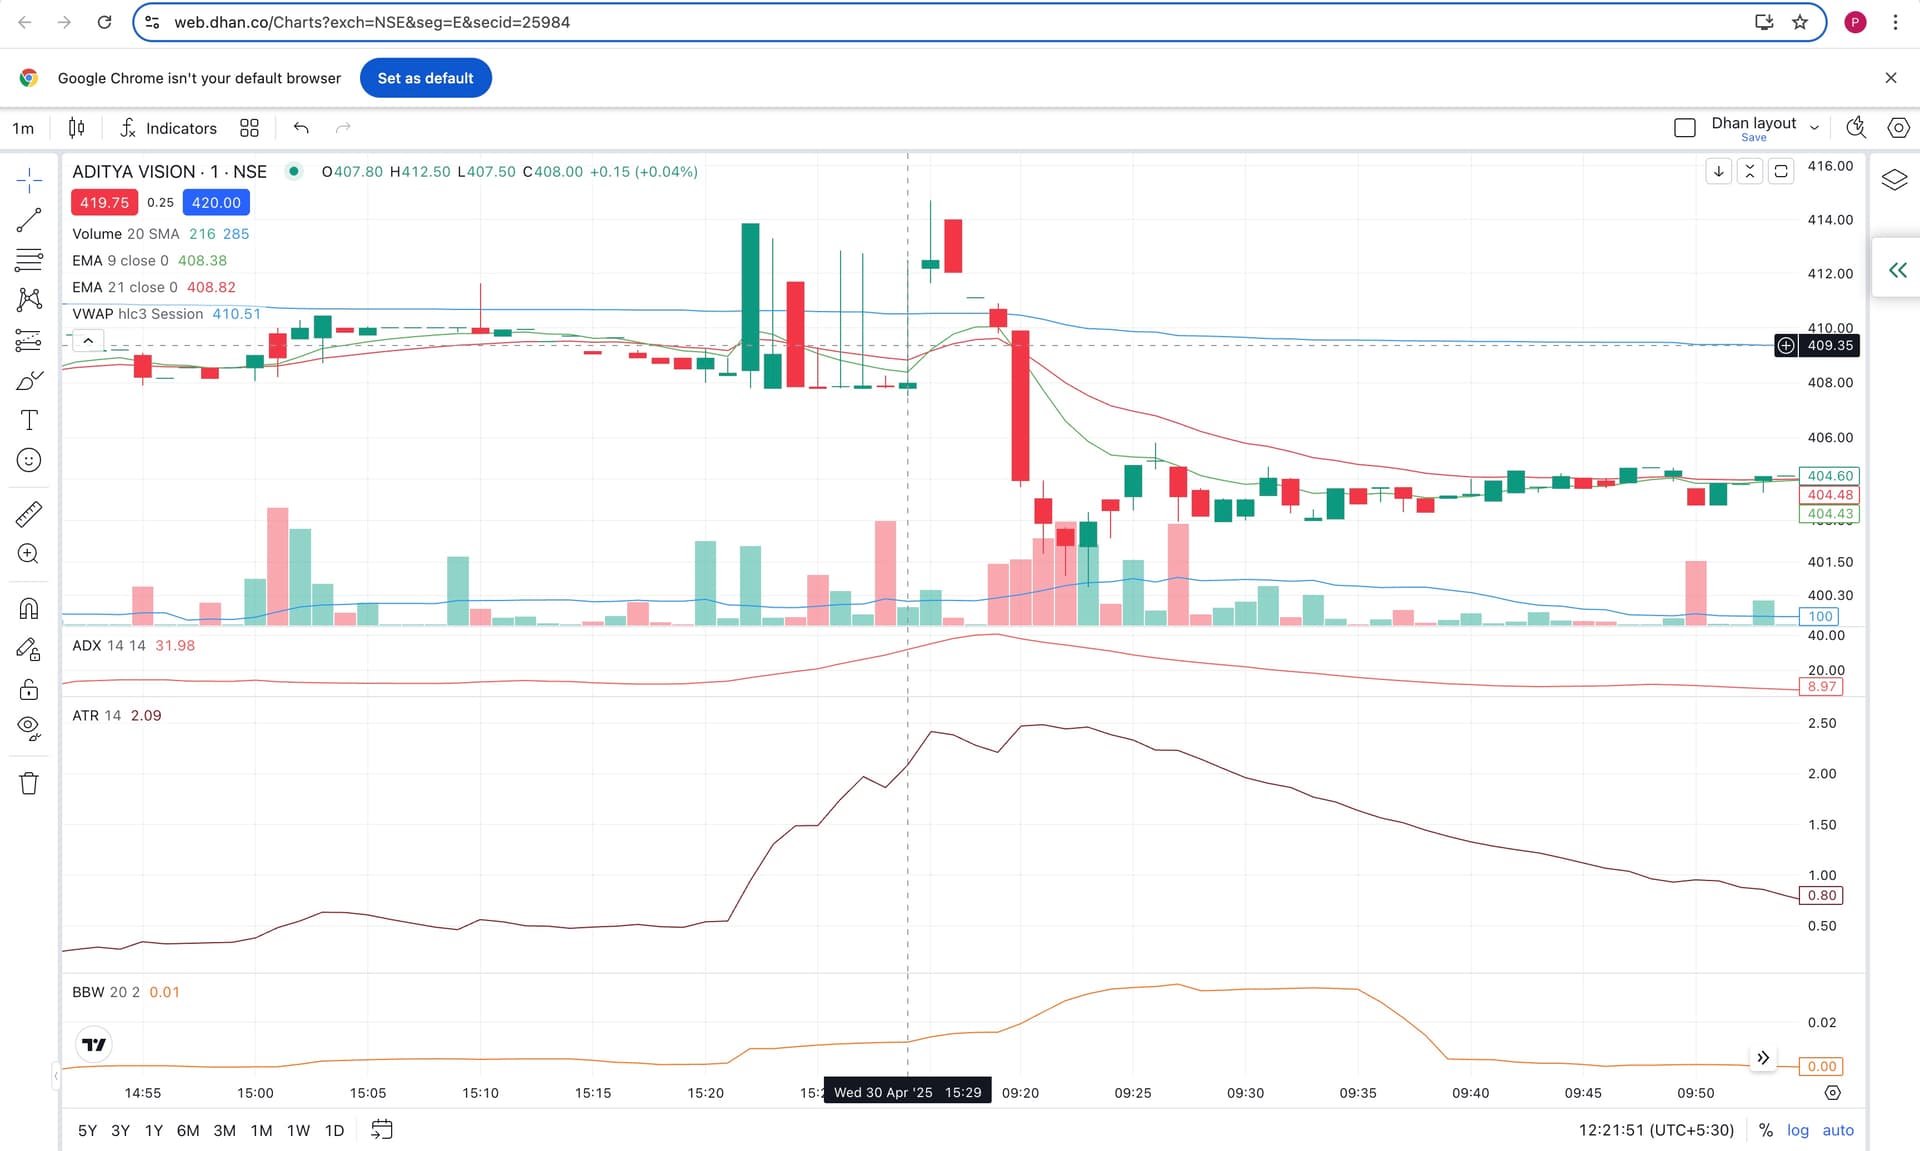
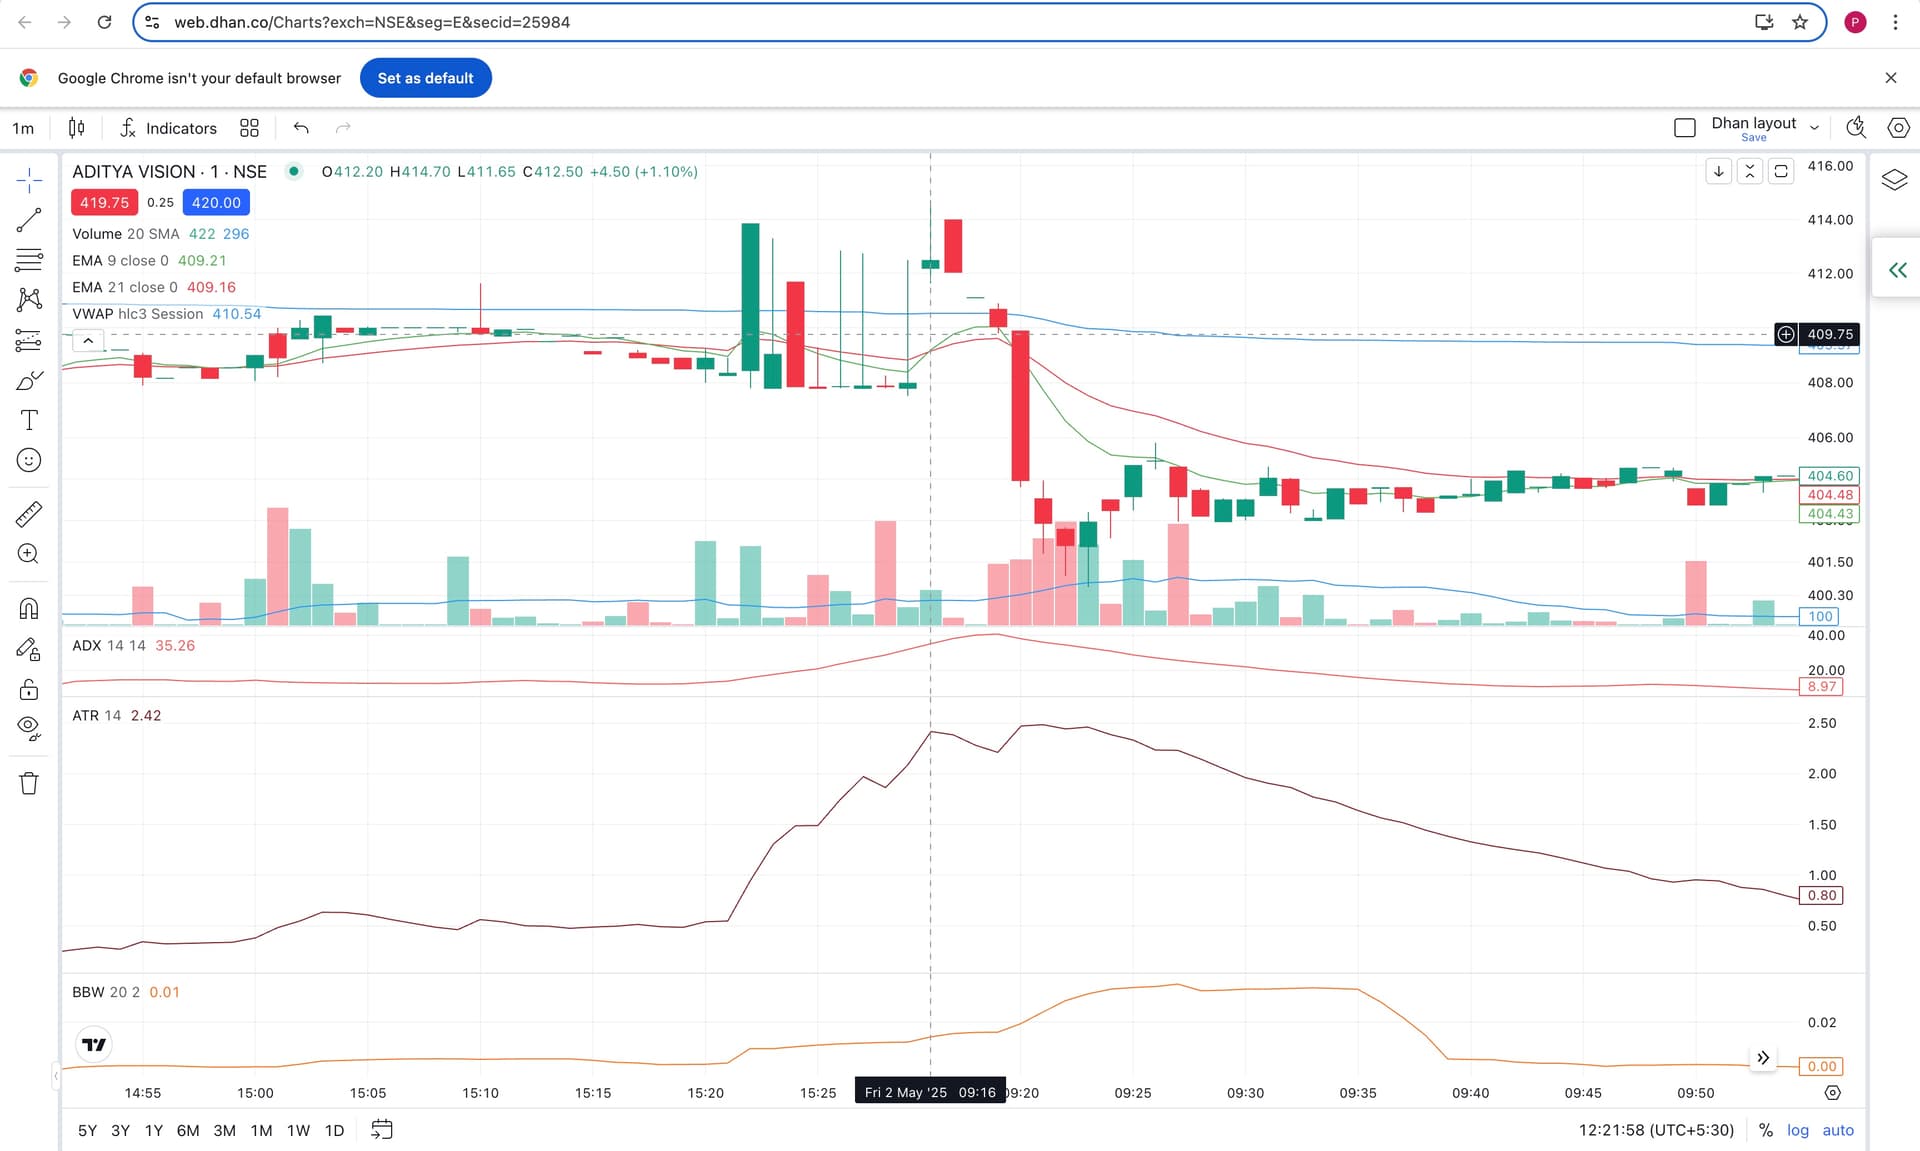
I checked the Aditya Vision stock (SECID: 25984), and I noticed that the opening 9:15 AM candle appears to be missing on the chart itself. After checking further, I realized this isn’t limited to just this stock — it seems to be affecting several other stocks as well.
Is this a known issue, or something that might be resolved soon?
I’m currently building a comprehensive and high-precision backtesting system that relies entirely on Dhan’s historical data. So small discrepancies like this can have a significant impact when scaled across multiple symbols and timeframes.
Would really appreciate it if you could look into this when you get a chance — thanks in advance!
Hello @Parthiban_Sub
Do note that candles are only formed when there is trade happening in that particular candle timeframe. This is not an issue on APIs or charts, but simply low volume stocks wherein data does not exist for certain candles.
If you look at the stock along with volume on charts, you will be able to see the same.
@Hardik - Thanks for the clarification.