When traders think about risk, they often look at indicators like:
• ATR
• Standard Deviation
• India VIX
These indicators measure how much prices move.
But they don’t answer another important question:
“How painful was the journey for an investor?”
That’s exactly what the Ulcer Index (UI) was designed to measure.
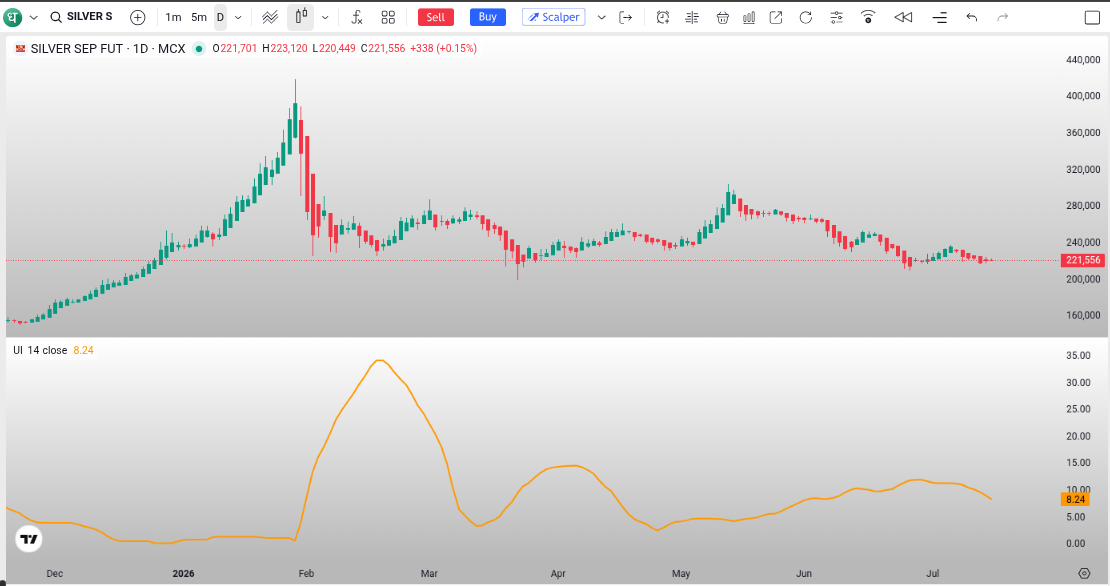
Silver Fut Heiken Ashi - Daily Chart for reference.
What Is The Ulcer Index?
Developed by Peter Martin and Byron McCann, the Ulcer Index is a downside risk indicator.
Unlike traditional volatility indicators, it doesn’t care about upside moves.
Instead, it focuses only on:
• How far price falls from its recent high
• How long it stays below that high
• How quickly (or slowly) it recovers
Think of it as an indicator that measures the “stress” experienced by a long-term investor.
Why Is It Called The Ulcer Index?
Imagine buying a stock at its all-time high.
The stock falls 20%.
Then stays there for months before recovering.
Compare that with another stock that falls just 5% and recovers within a few days.
Both may eventually deliver similar returns.
But which one would have caused more anxiety for an investor?
That’s what the Ulcer Index attempts to quantify.
It measures the depth and duration of drawdowns, not just price movement.
How Does It Work?
The Ulcer Index looks at the percentage decline from the most recent highest price over a chosen look-back period (commonly 14 or 20 periods).
Large and prolonged drawdowns increase the indicator value significantly because the calculation gives greater weight to deeper declines.
In simple terms:
• Small pullbacks → Low Ulcer Index
• Deep corrections → Higher Ulcer Index
• Longer recovery periods → Higher Ulcer Index
How To Interpret It
Generally:
 Lower UI
• Smaller drawdowns
• Faster recoveries
• Lower downside risk
 Higher UI
• Larger corrections
• Longer recovery periods
• Higher downside risk
Unlike many indicators, a lower reading is generally considered more favorable for long-term investors.
Why Is It Different From Standard Deviation?
Most volatility indicators treat:
 +10% move
and
 -10% move
as equal.
The Ulcer Index doesn’t.
It ignores upside volatility and focuses only on downside movement.
This makes it particularly useful for investors who care more about protecting capital than measuring overall price fluctuations.
Where Can Traders And Investors Use It?
The Ulcer Index is commonly used for:
• Long-term investing
• Portfolio comparison
• Mutual fund analysis
• ETF analysis
• Risk-adjusted performance evaluation
It is less commonly used as a standalone trading signal and more as a tool for understanding downside risk.
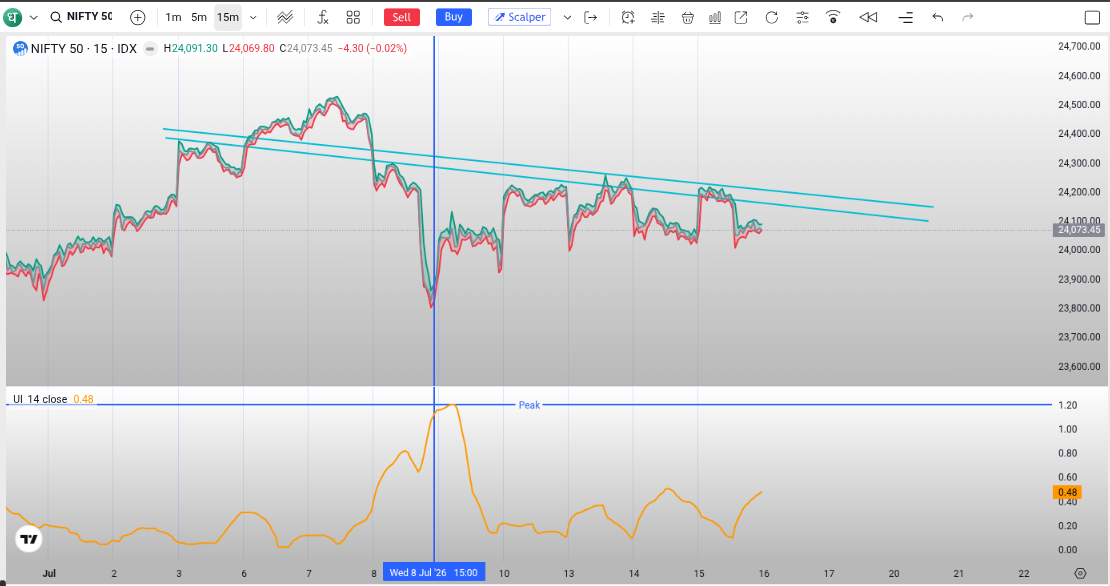
If you’re someone who evaluates investments based not only on returns but also on the journey taken to achieve those returns, this indicator is worth exploring on Dhan Charts.
Let’s Discuss
• Before today, had you heard of the Ulcer Index?
• When evaluating an investment, what matters more to you:
Higher returns | Lower drawdowns | Faster recoveries
• Do you think downside risk is a better measure than overall volatility?
• Which underrated indicator has added the most value to your analysis?
It would be interesting to know which lesser-known indicators the community has found most useful over the years.
Disclaimer: This post is intended for educational and discussion purposes only. The Ulcer Index is a technical analysis tool designed to measure downside risk and should not be used as the sole basis for investment or trading decisions.
