Over the past two years, the Nifty 50 delivered relatively muted index-level performance, declining around 2.19% between June 2024 and June 2026.
But underneath the index, the story looked very different.
Several individual stocks significantly outperformed despite the broader market remaining largely sideways.
This highlights an important market observation:
Even during flat index phases, stock-specific opportunities can still emerge through sector rotation, earnings growth, and business strength.
Top Performing Nifty Stocks (June 2024 → June 2026)
 Shriram Finance +89.60%
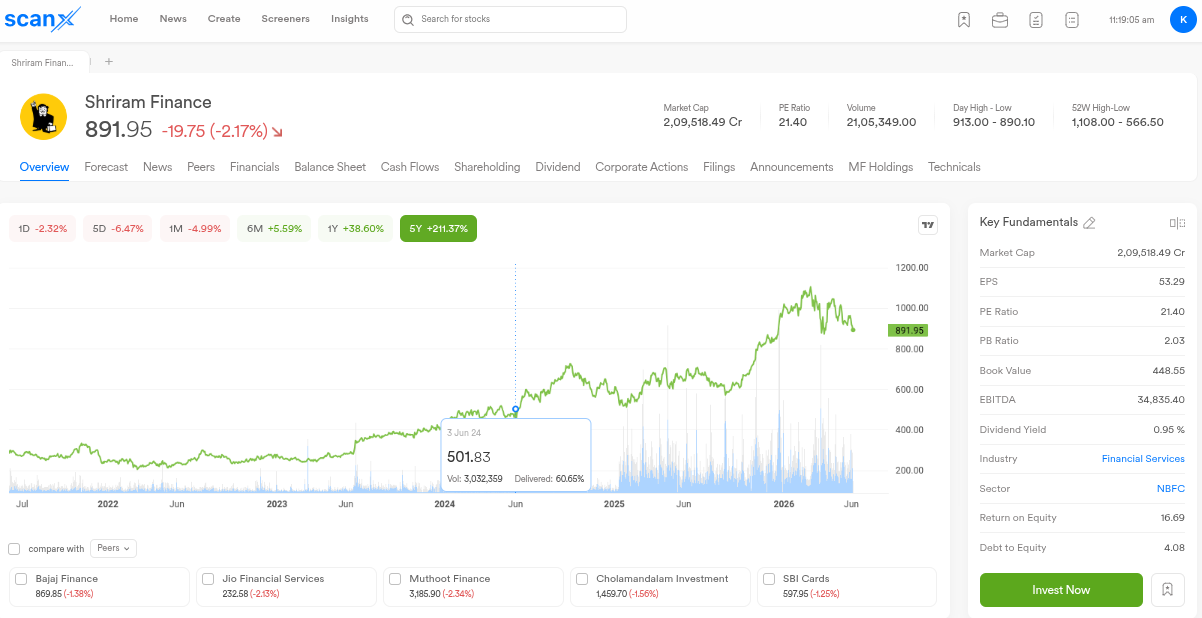
• Strong NBFC growth
• Improved asset quality
• Credit expansion momentum
 Hindalco Industries +64.60%
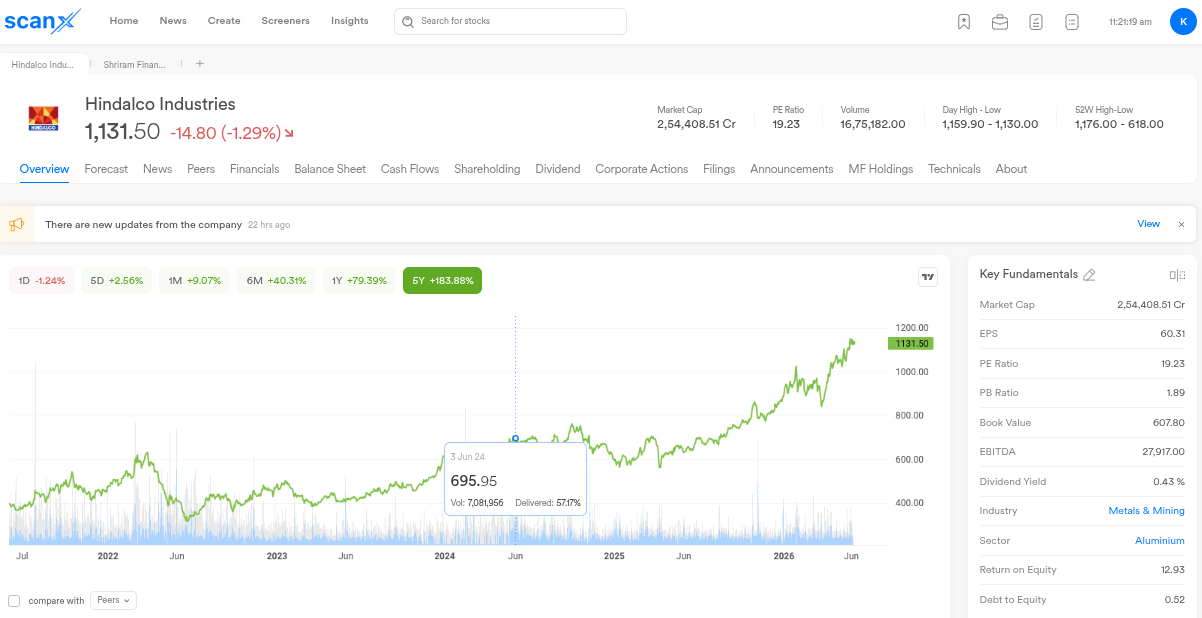
• Recovery in metal cycle
• Aluminum demand strength
• Operational efficiency improvement
 Eicher Motors +49.49%
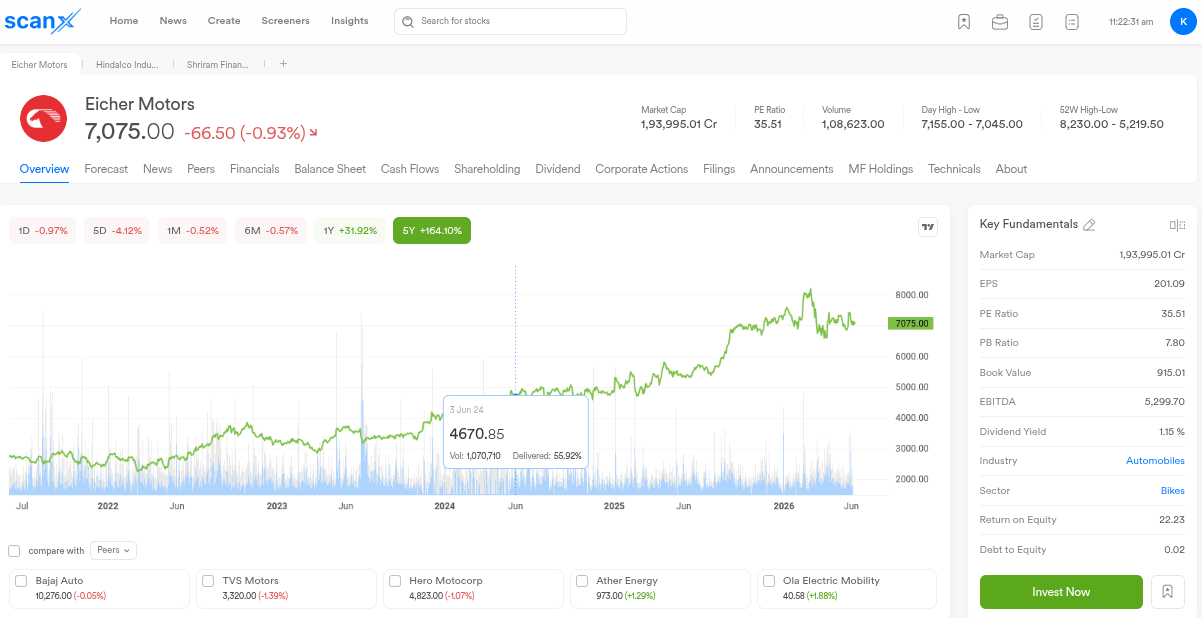
• Royal Enfield expansion
• Premium segment leadership
• Strong domestic demand
 JSW Steel +48.31%
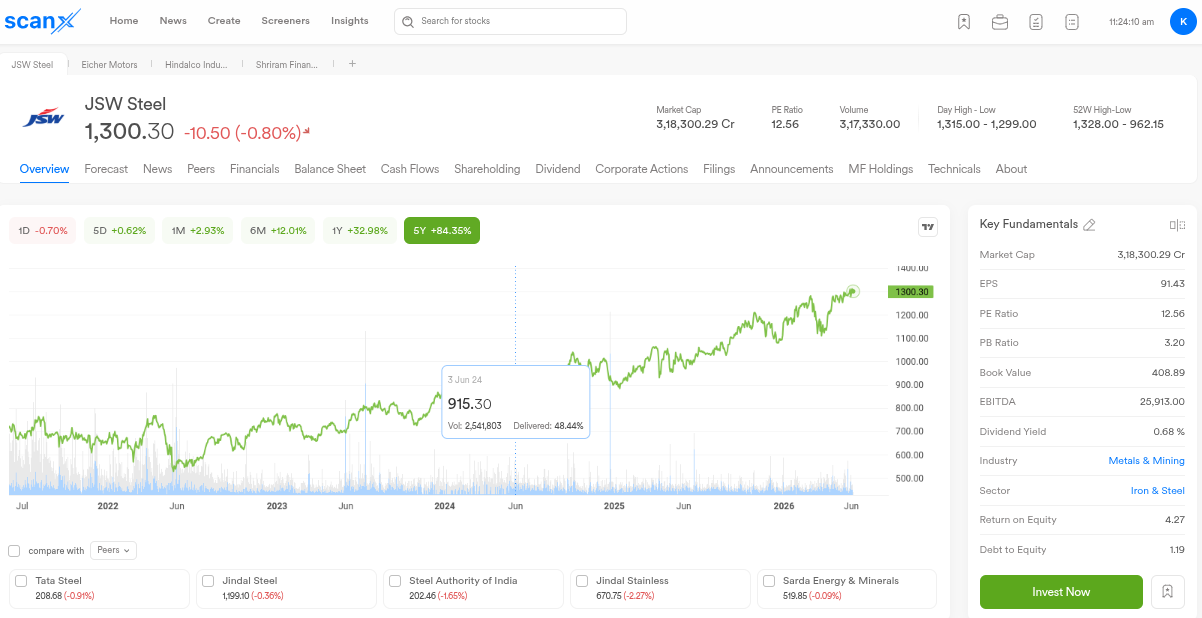
• Infrastructure-driven demand
• Capacity utilization improvement
• Commodity cycle recovery
 Apollo Hospitals +40.57%
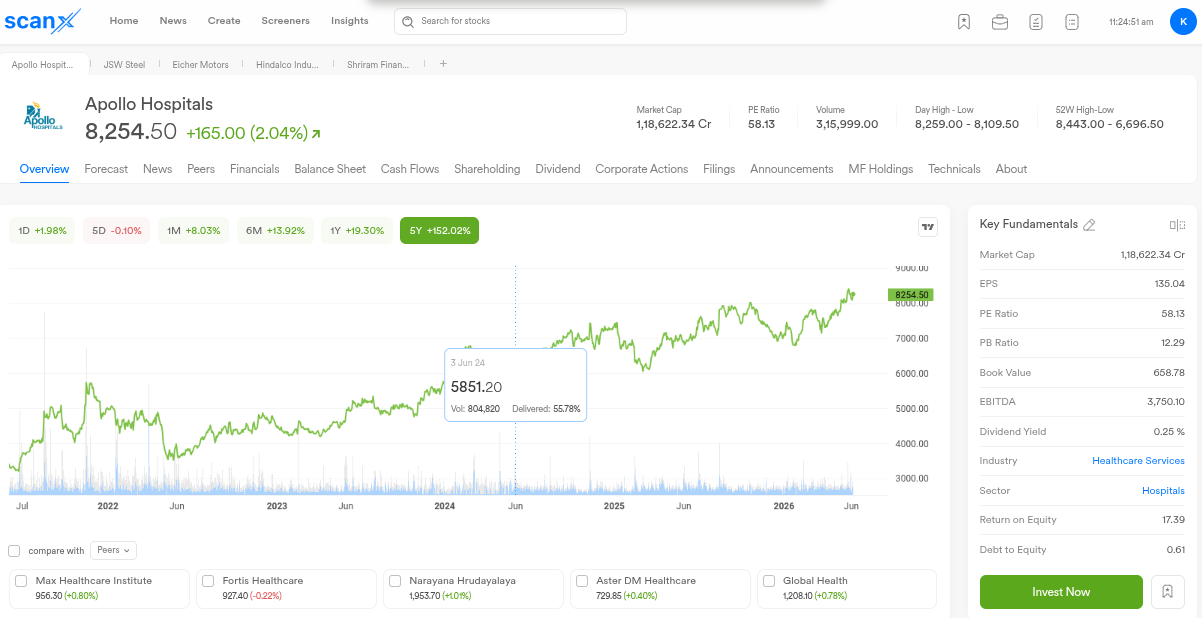
• Healthcare infrastructure growth
• Premium healthcare services expansion
• Continued post-pandemic demand
Sector Rotation Was Clearly Visible
One interesting observation from this phase was that leadership kept rotating across sectors instead of staying concentrated in one theme.
Financials
• Shriram Finance
• Bajaj Finance
Strong lending growth and retail participation supported NBFC performance.
Metals & Commodities
• Hindalco
• JSW Steel
• Tata Steel
Commodity recovery and infrastructure demand helped the sector outperform.
Healthcare
• Apollo Hospitals
• Max Healthcare
Healthcare expansion and premium services remained strong themes.
Telecom
• Bharti Airtel
5G rollout and ARPU expansion supported growth visibility.
Key Market Insights
Index Performance Does Not Tell the Full Story
Even though the index remained largely range-bound, several individual stocks delivered strong returns.
This reinforces the idea that:
• Market breadth matters
• Sector leadership changes over time
• Stock selection becomes important during sideways phases
Sector Rotation Continued Throughout The Period
Leadership shifted between:
• Financials
• Metals
• Healthcare
• Telecom
• Consumer-facing businesses
rather than one sector dominating continuously.
Quality Businesses Continued To Attract Participation
Companies with:
• Strong fundamentals
• Market leadership
• Earnings visibility
• Operational efficiency
generally showed stronger relative performance.
One interesting takeaway from this phase:
A sideways index does not always mean lack of opportunity.
Different sectors and stocks can continue creating trends even when the broader market appears stagnant.
Did you invest or track any of these stocks during this phase?
Which sector surprised you the most over the last two years?
Disclaimer:
This analysis has been prepared using historical data insights from Fuzz AI. Historical performance does not guarantee future results. This post is intended purely for educational and discussion purposes and should not be considered investment advice.