Hello Traders,
At Dhan we have been building products, features and capabilities that help traders make informed decisions while trading.
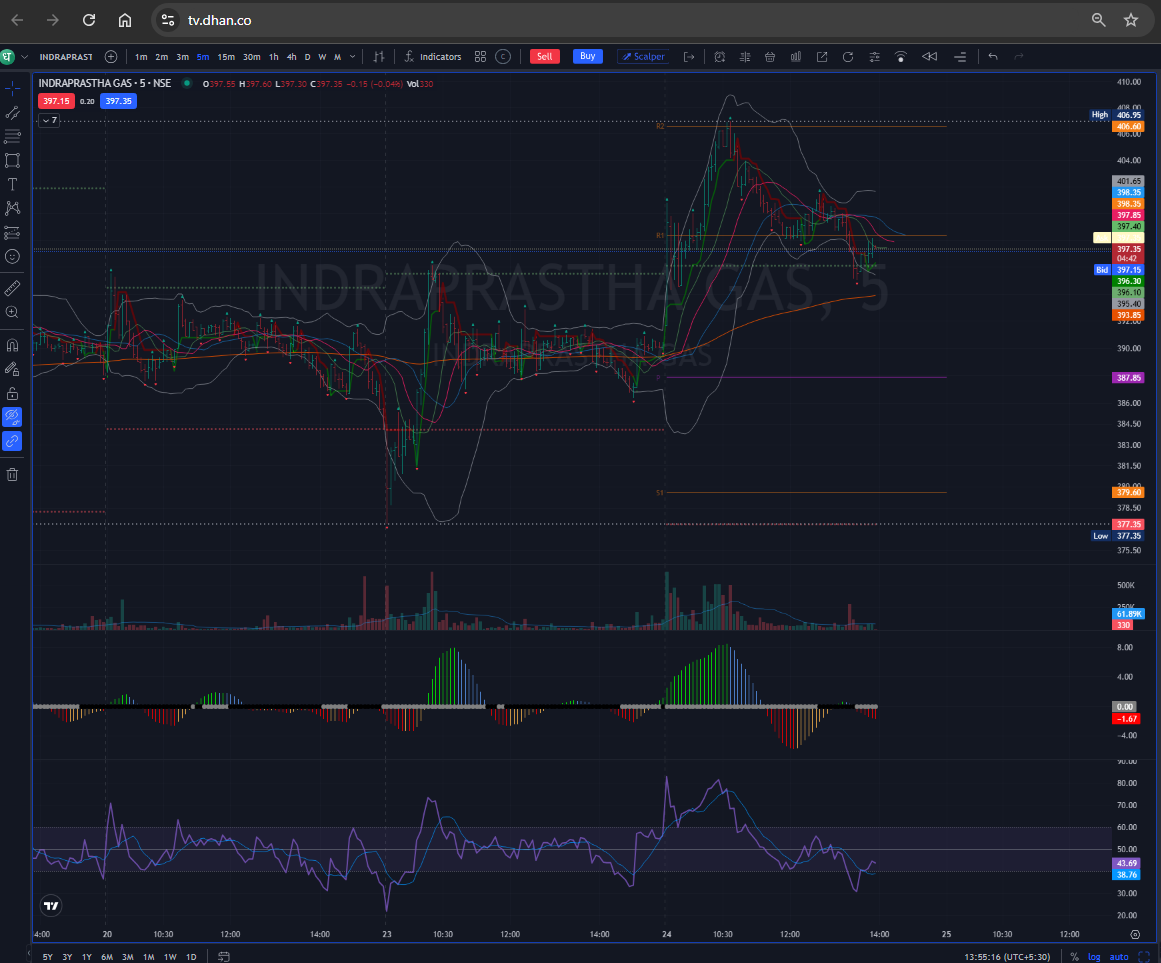
Specially for Traders who are interested in Options Trading, we understand that Open Interest (OI) is a key part of analyzing the derivatives market. It shows how many contracts are still active and open. As the name suggests, higher OI indicates greater interest and more open positions in that contract.
With Open Interest, you can understand market trends like whether long positions are being built or short positions are being covered. It helps identify support and resistance levels on the underlying asset by observing the OI of calls and puts in the options chain. You can also analyse rollover patterns and use OI for many other trading strategies.
At Dhan, we ensure that Open Interest data is presented in a way that provides insights at first glance. From Strike-wise Open Interest Bar Graphs, OI Bars on the Options Chain, 15-minute Build-Up Data, and Open Interest Indicators on Charts to Multi-Strike OI on Options Trader, OI Bars on Pay-Off Graphs, and more.
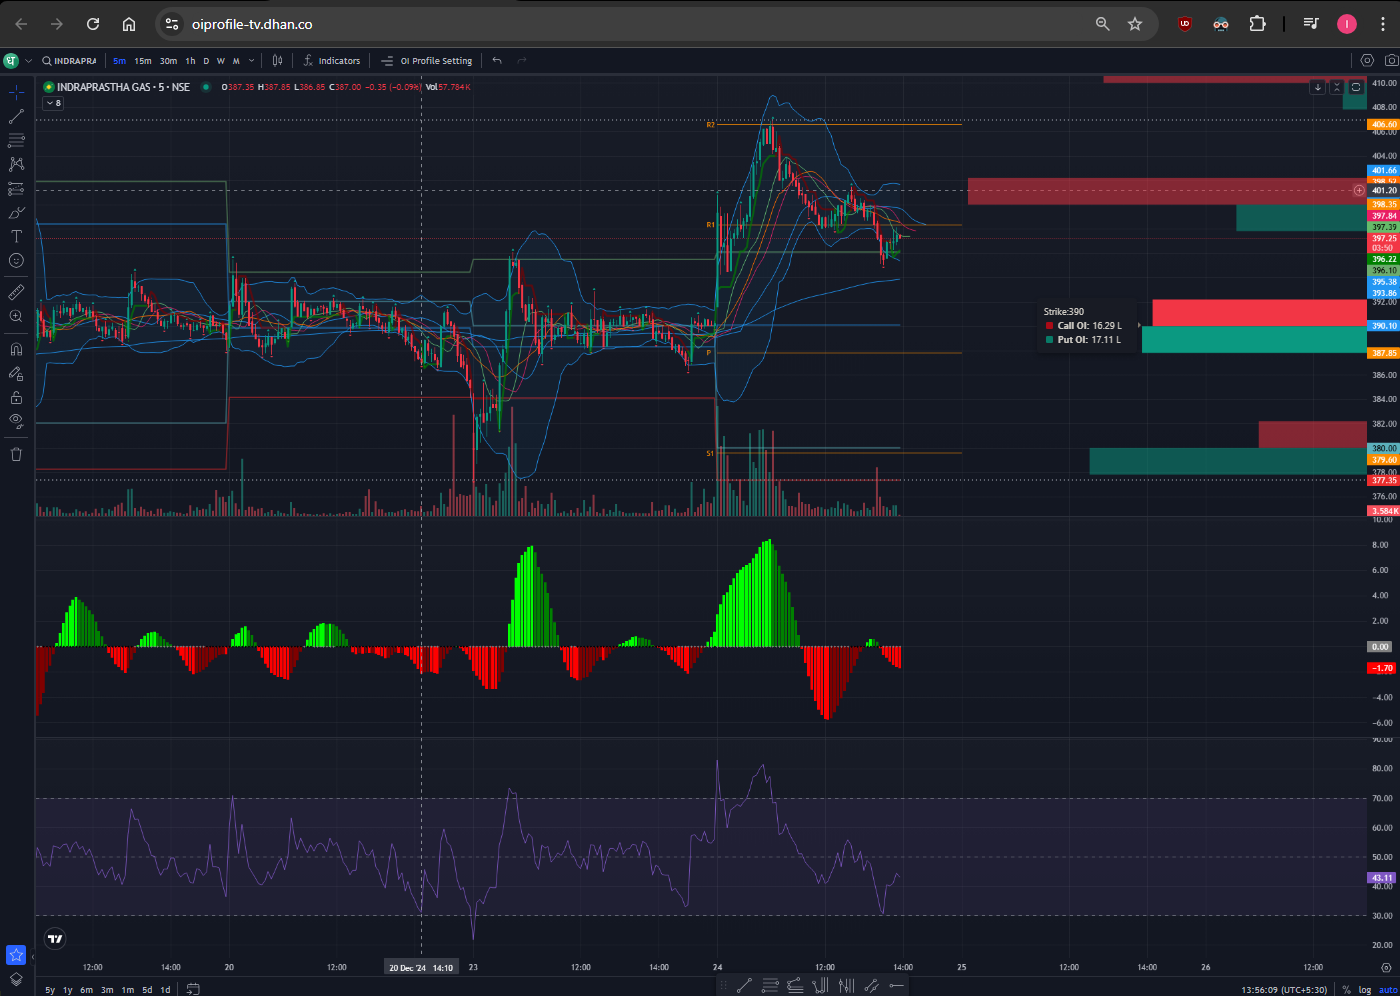
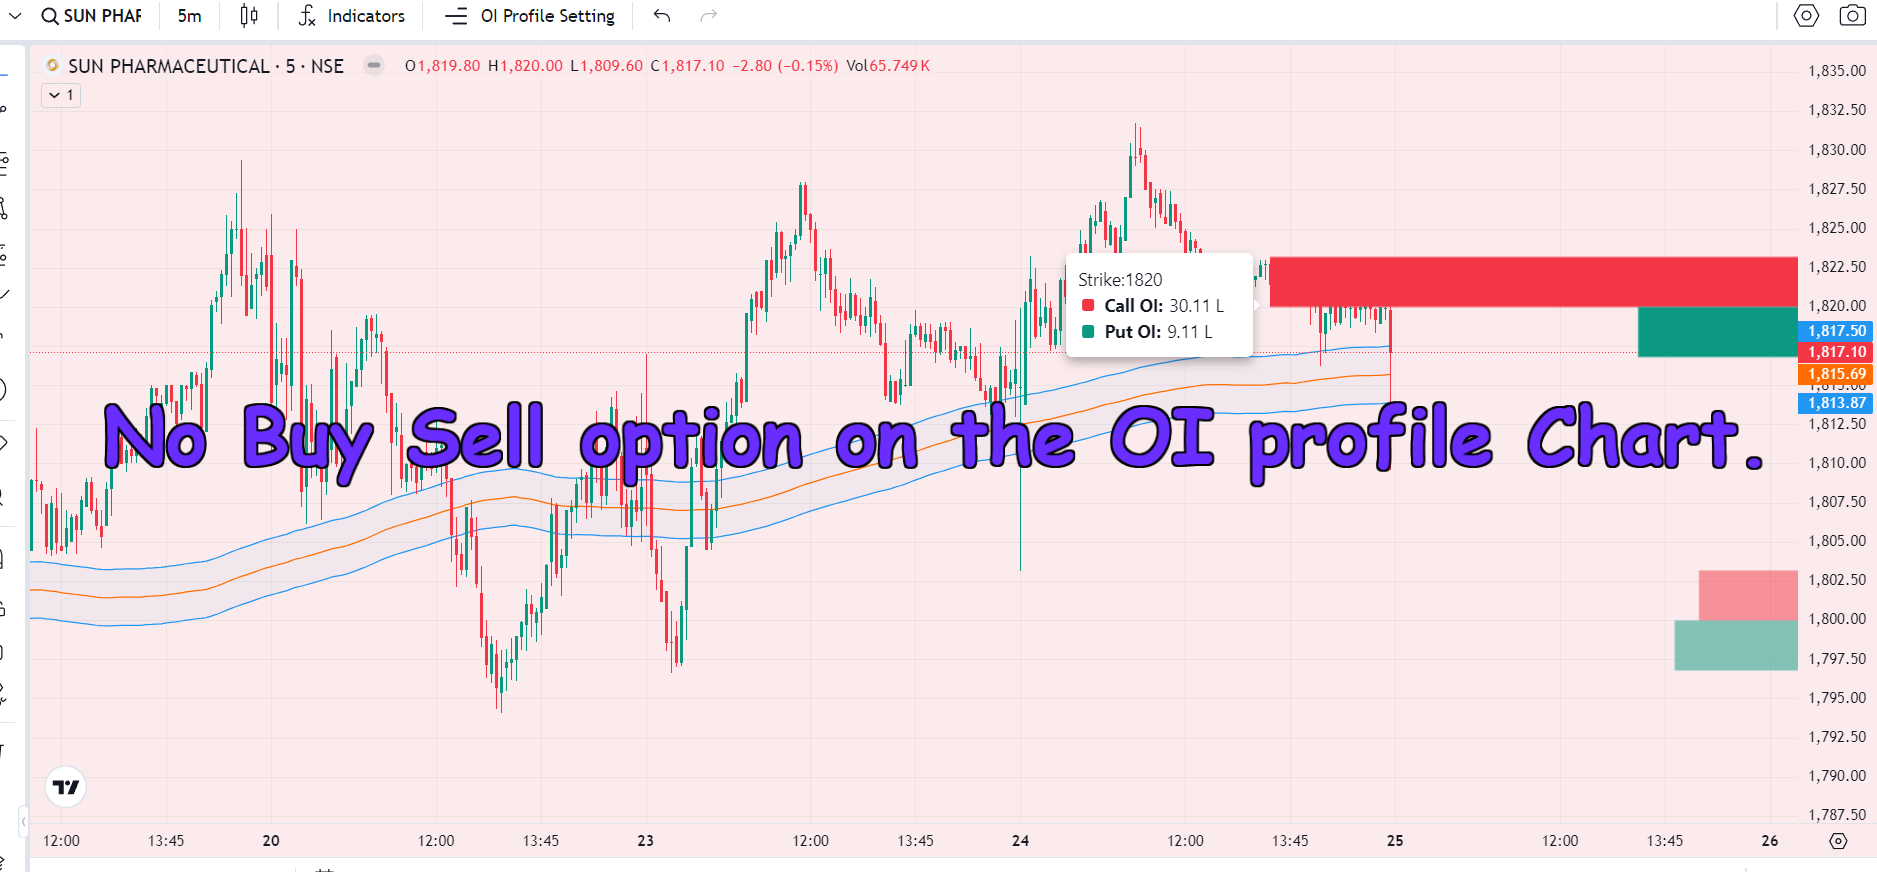
We are taking a step ahead and combining the powerful Dhan charts and Strike wise Open Interest Bar together.
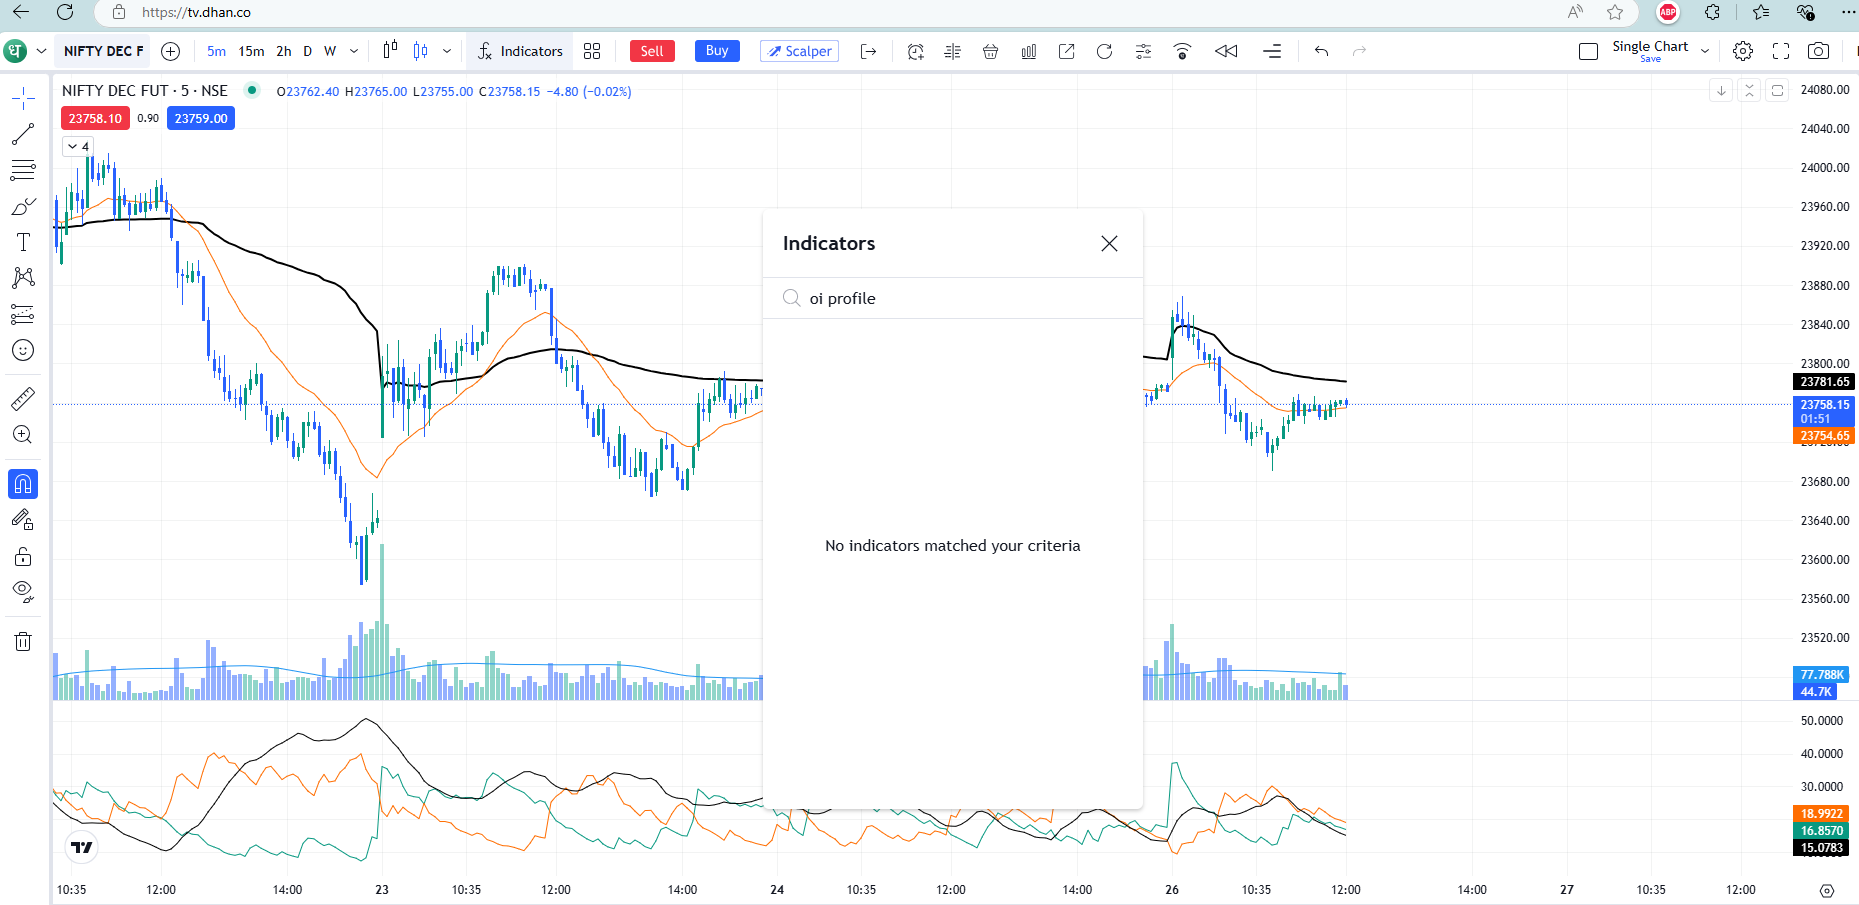
Introducing: Open Interest Profile on TradingView Charts
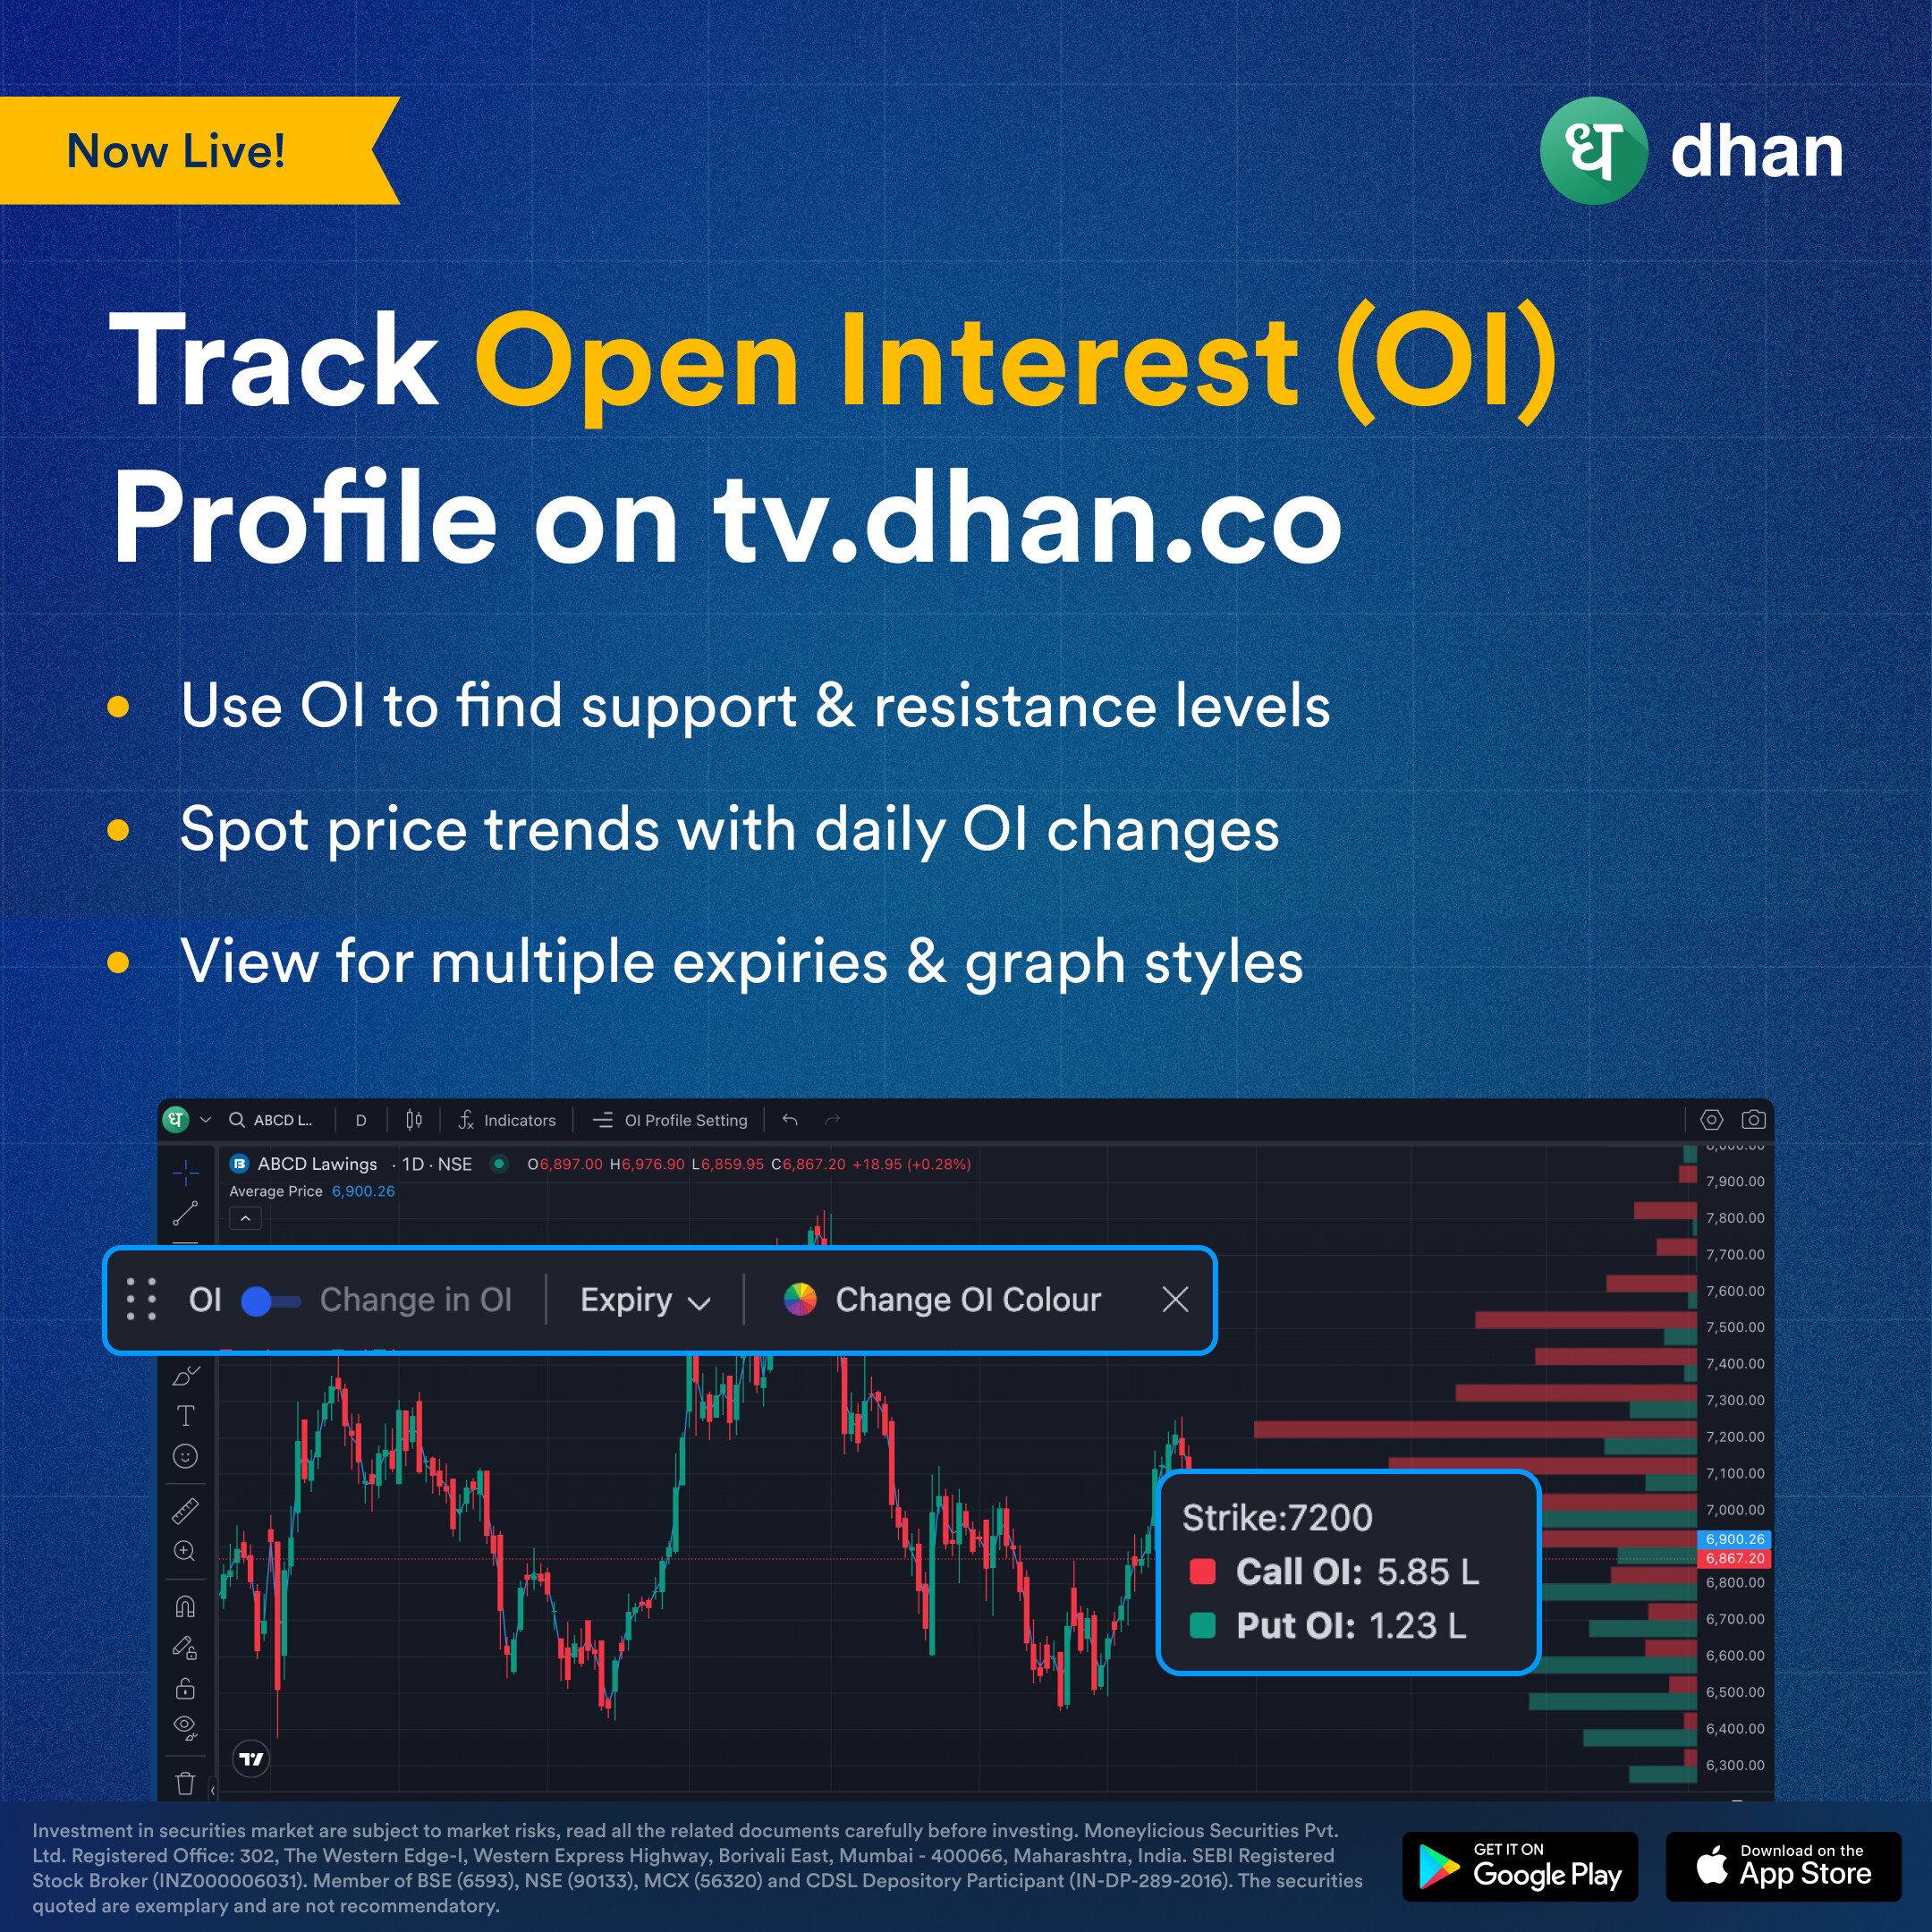
With OI Profile, you get a bird’s eye view on underlying charts, helping you navigate where the spot prices are heading towards. Or you can find out the major support & resistance levels with respective call & put OI. This too on top of regular technical indicators & candlestick patterns. Additionally, you can see the OI change based on the day.
We have built this feature with the option of added customisation, where you can view Open Interest across multiple expiries and even decide how you would like to view the graph itself.
As always, we keep on building Dhan on your feedback and would love to learn more from you. Let us know below in the thread what you think should be on top charts next.
Happy Trading
Naman