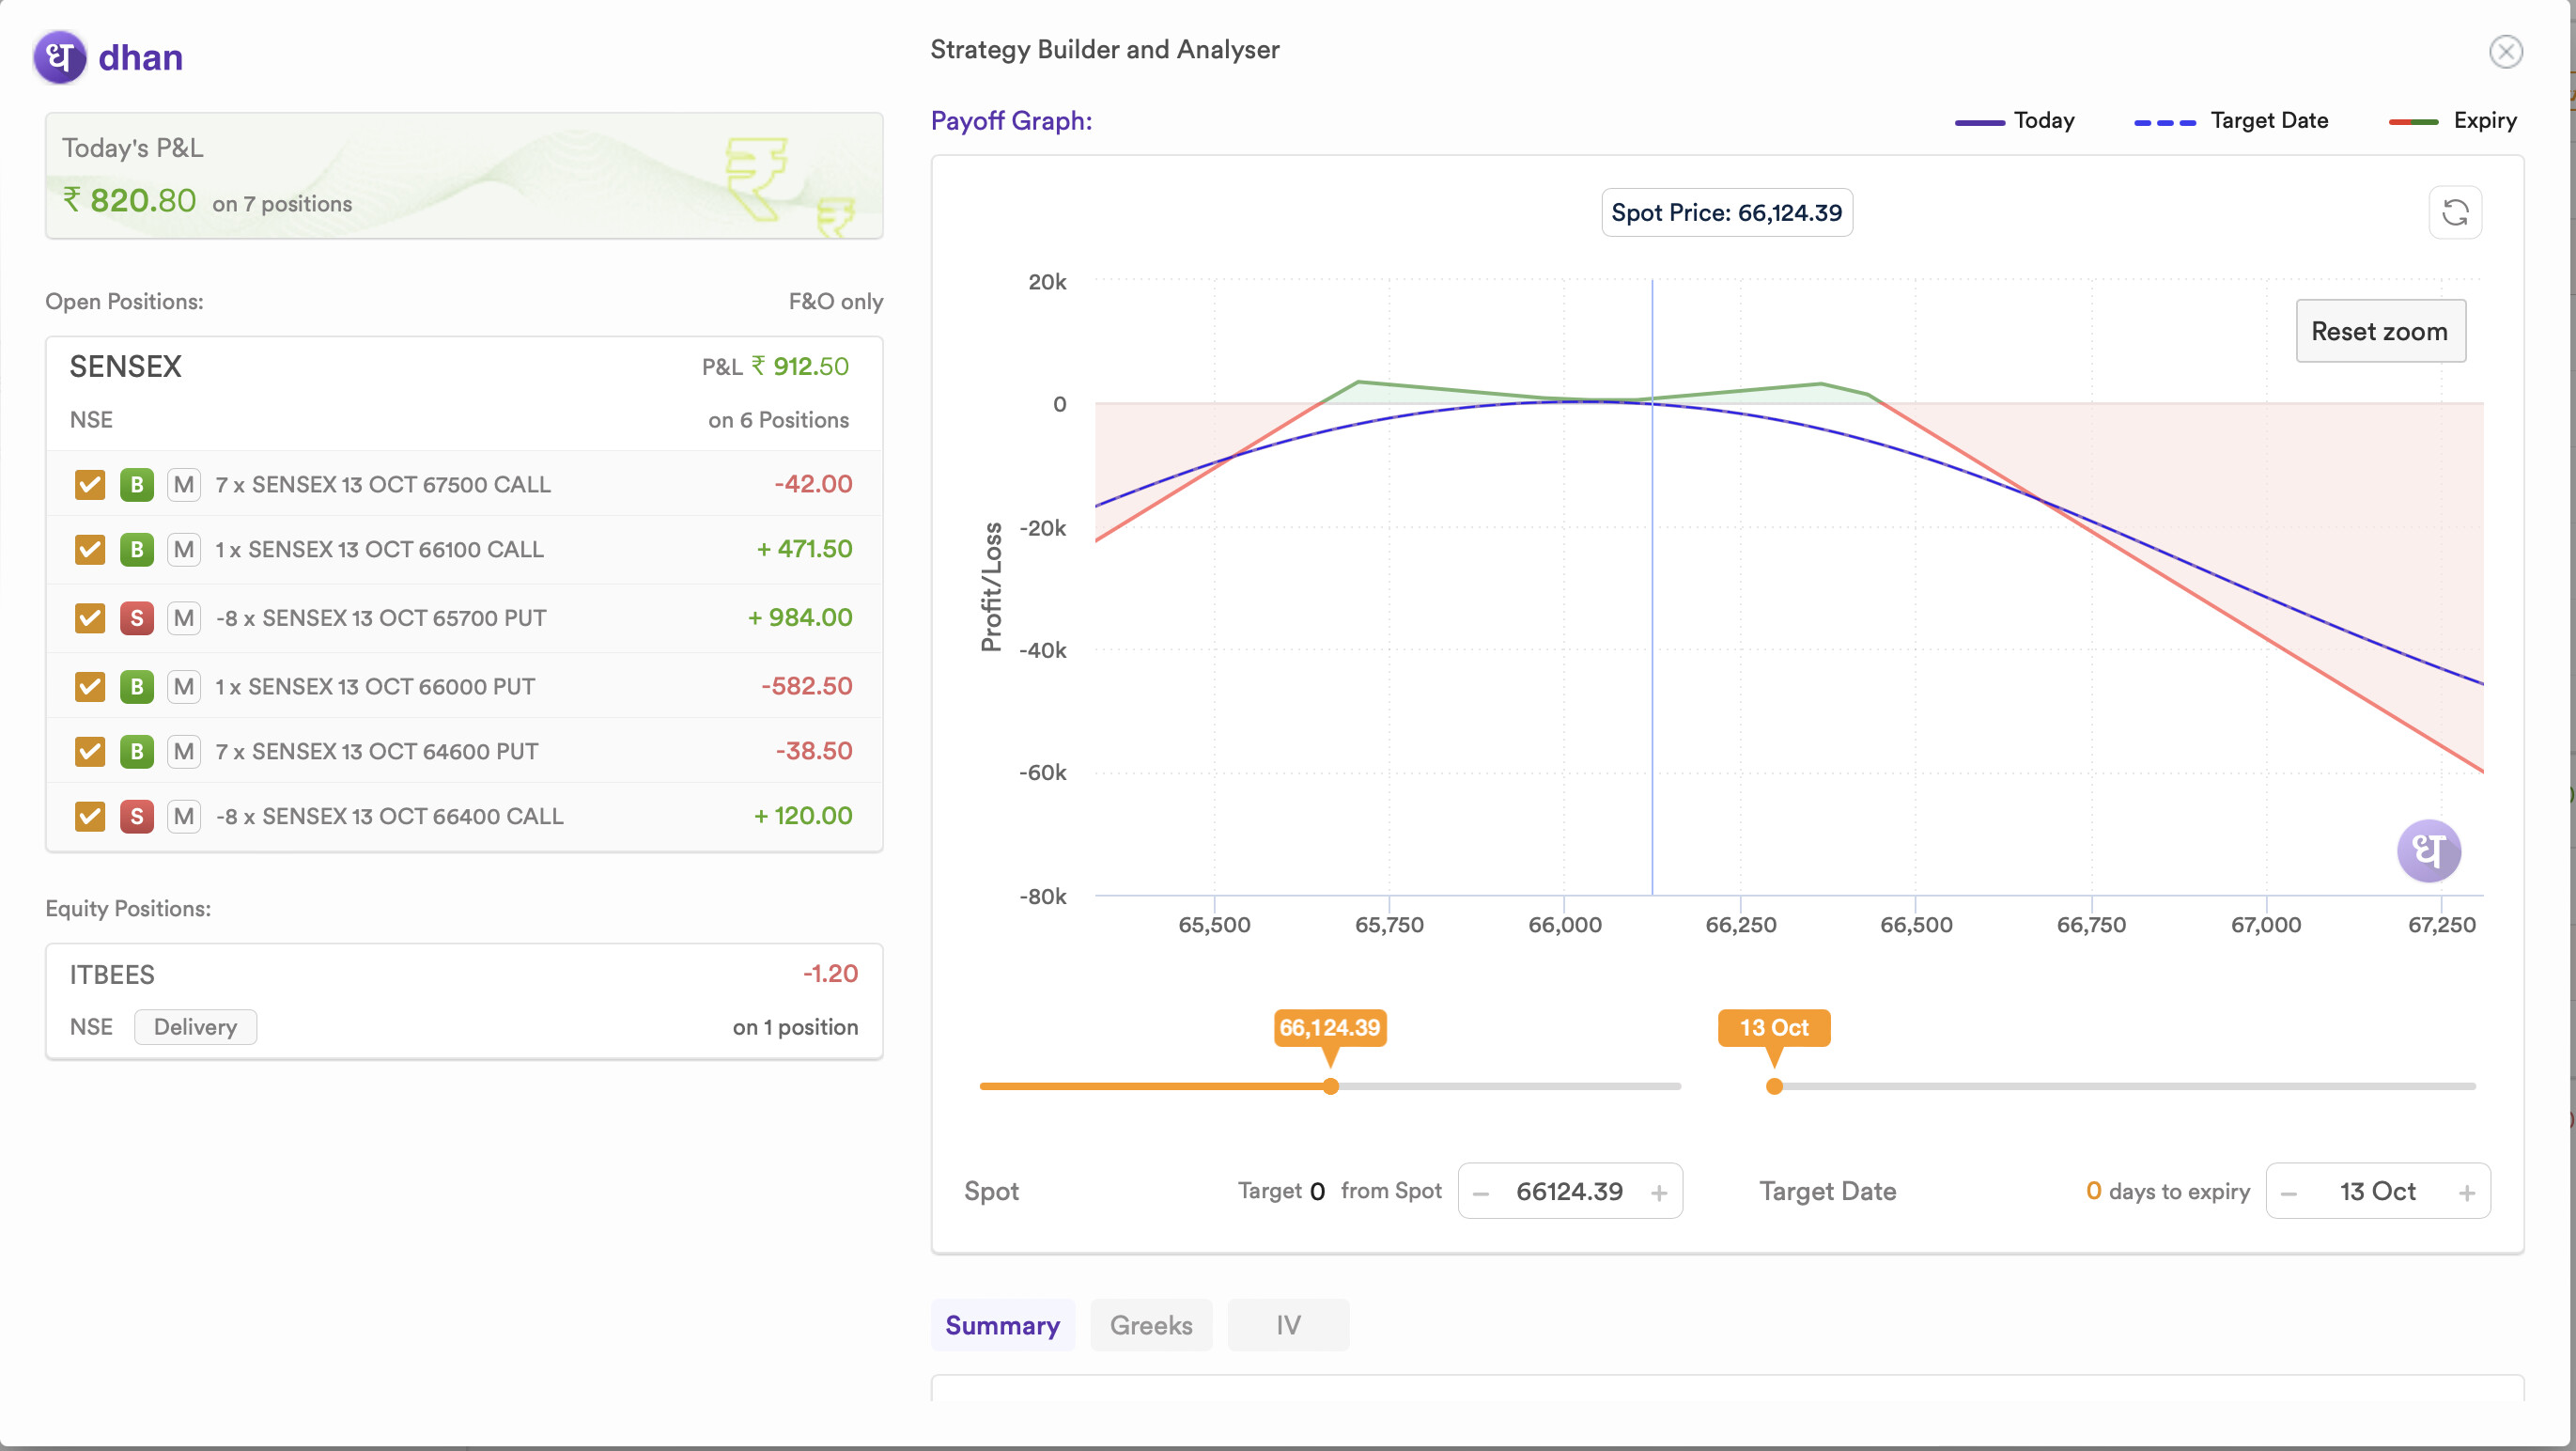
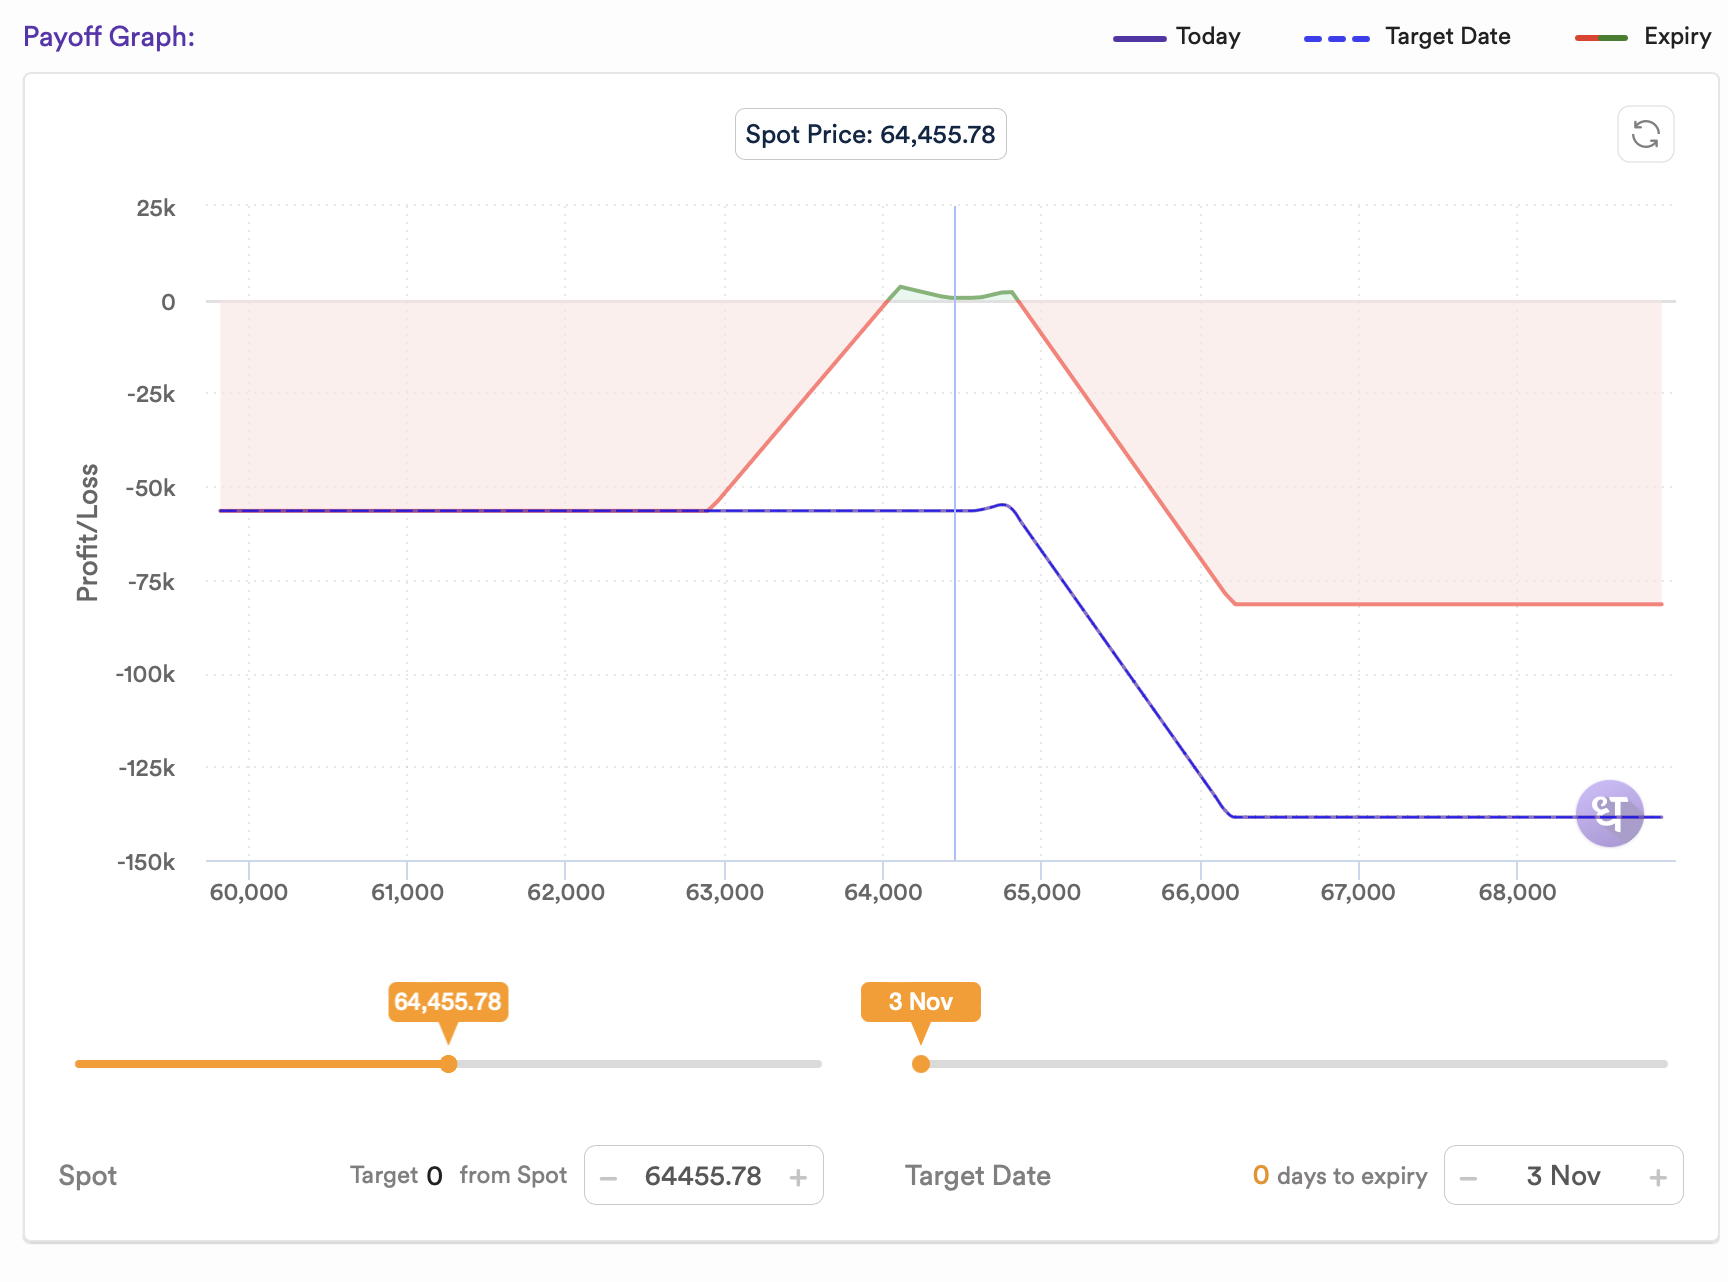
The option payoff seems to be not correct. Especially the blue line does not indicates the current P&L. Also, while hovering over the chart to see pay-offs for different strike is not continuous.
PS: I had to use Opstra for the same. Sadly, they do not have Sensex so I had to look using Dhan options webapp. However, the experience is no where close.
Please have a look at it. Not sure if you are already working on this part.
Need to understand more from you, why do you think the blue line is not showing you the exact P&L. The pay-off graph shows theoretical P&L based on theoretical Call & Put prices & implied volatility. The theoretical p&l value of blue line is very close (almost exact) to real p&l value.
As I can see in your screenshot the value of p&l on the left side is almost same as the probable p&l shown by the blue line. The P&L value in left side changes & updates in the real time as the prices change. The spot price on the Pay off graph does not auto update in the real time. You need to manually click the refresh button.
Happy to get on a call with you and discuss this in detail. Please DM me you contact details.
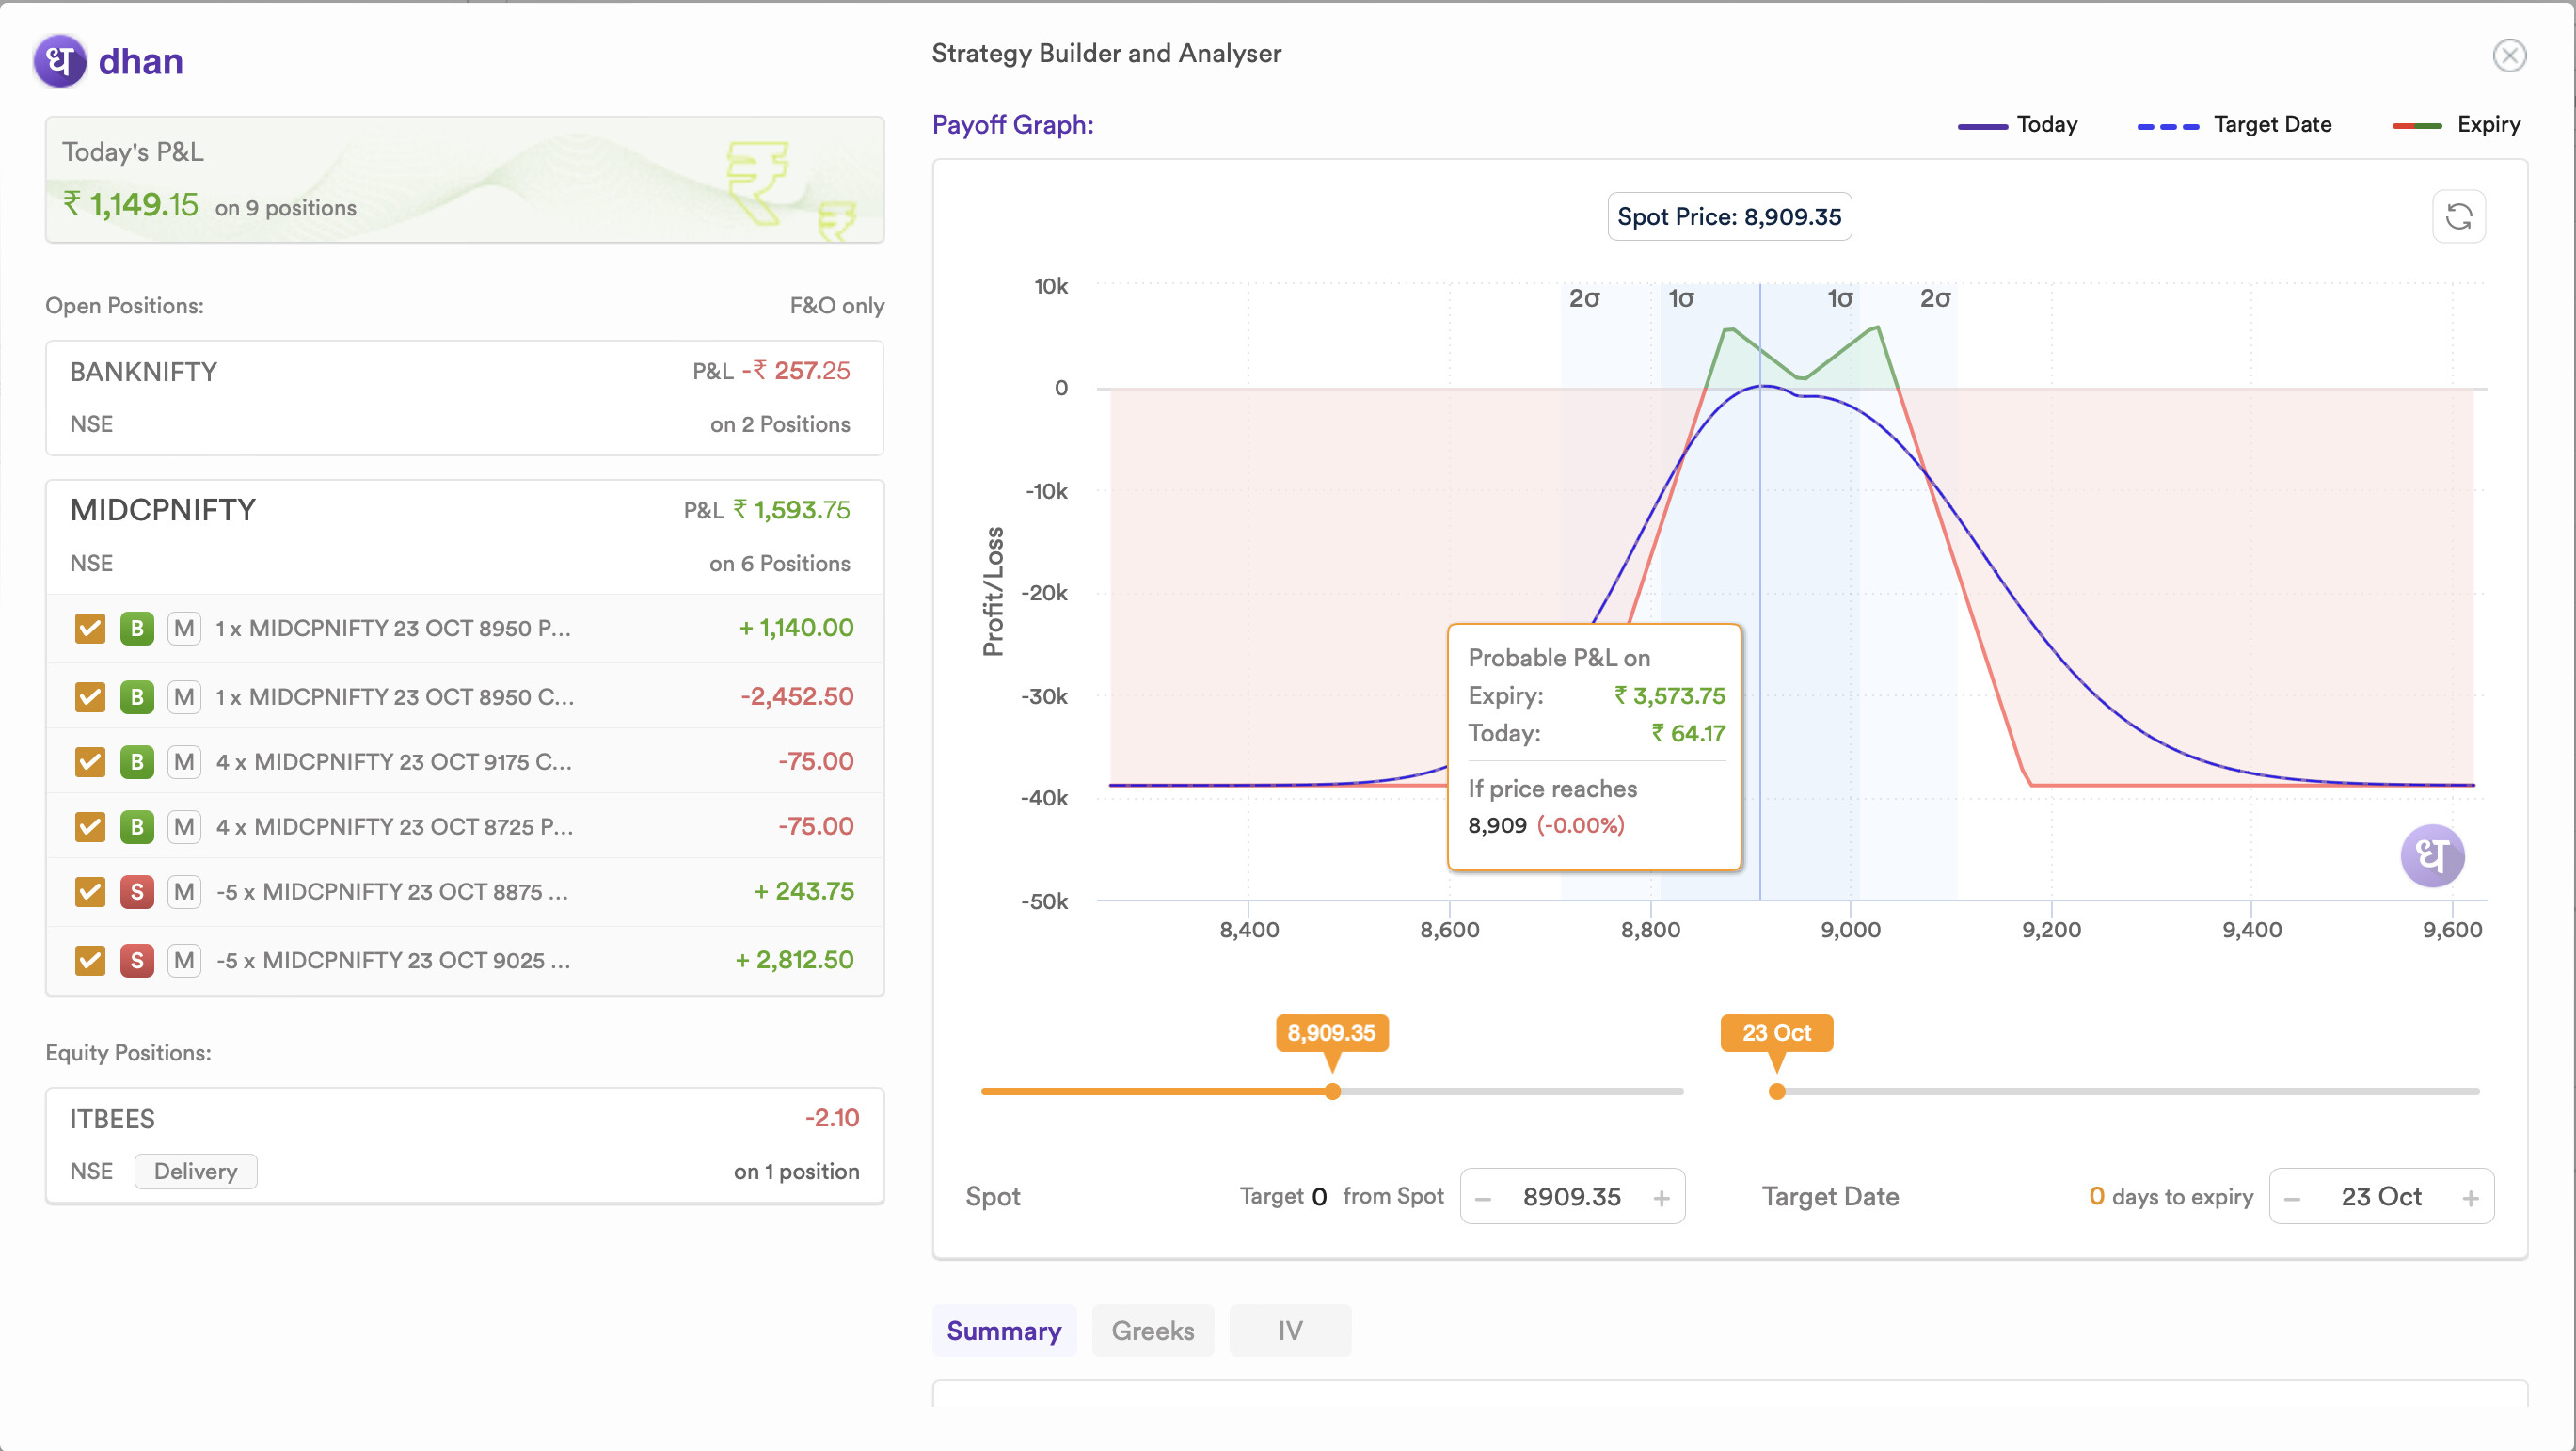
Have a look at the today value in the chart vs the PnL value for MIDCPNIFTY positions. Those two should ideally match. PS: I refreshed the chart before this.
As we have mentioned earlier, the blue line is calculated based on theoretical formula for calculating price. We will work on the model to achieve more precision here.
Recently I noticed, sometimes the blue line also matches the actual P&L and sometime it is completely off. If I am not wrong, you are currently pricing the options given the greeks only for certain interval of spot value, for this reason while scrolling the cursor over the pay-off chart is not smooth. One suggestion is to fill them with some interpolated values so that the scrolling over the chart will be smooth
Feedback noted for the first point. We will try to fill in more interpolated points in between the pay-off graph.
For the sensex options pay-off graph, can you please share us the legs (strategy), you can DM me here or send on feedback@dhan.co. We will try to replicate the exact scenario. Because, strategies we tried here just right now are showing perfect result.
Shared the legs with you over message. Although what I observed, these pay-off graphs keep on changing. So not sure if the replication could be possible.
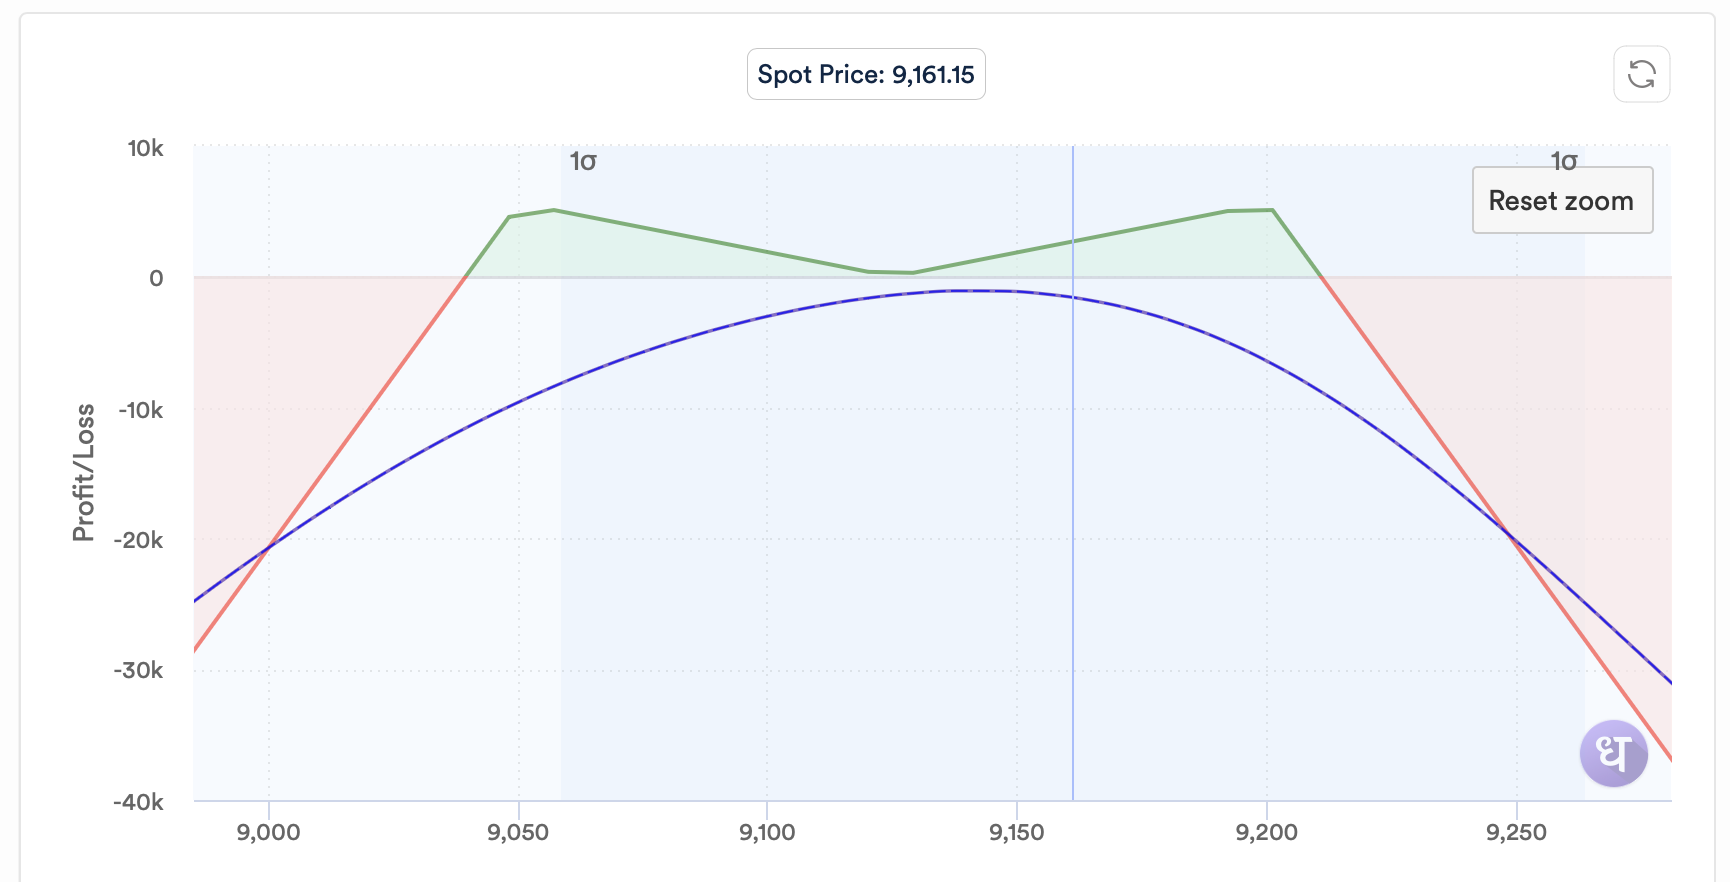
It will be a help for us if you elaborate what seems unusable here. If the concern is regarding skewed payoff graph above the breakeven points, you can anytime zoom in & zoom out to see the desired part. We make sure that both the breakeven points & inflection points are covered and remain in the center of the graph, as both the points are important.
Also, I am sure your previous query is resolved now and you are not facing such issue.
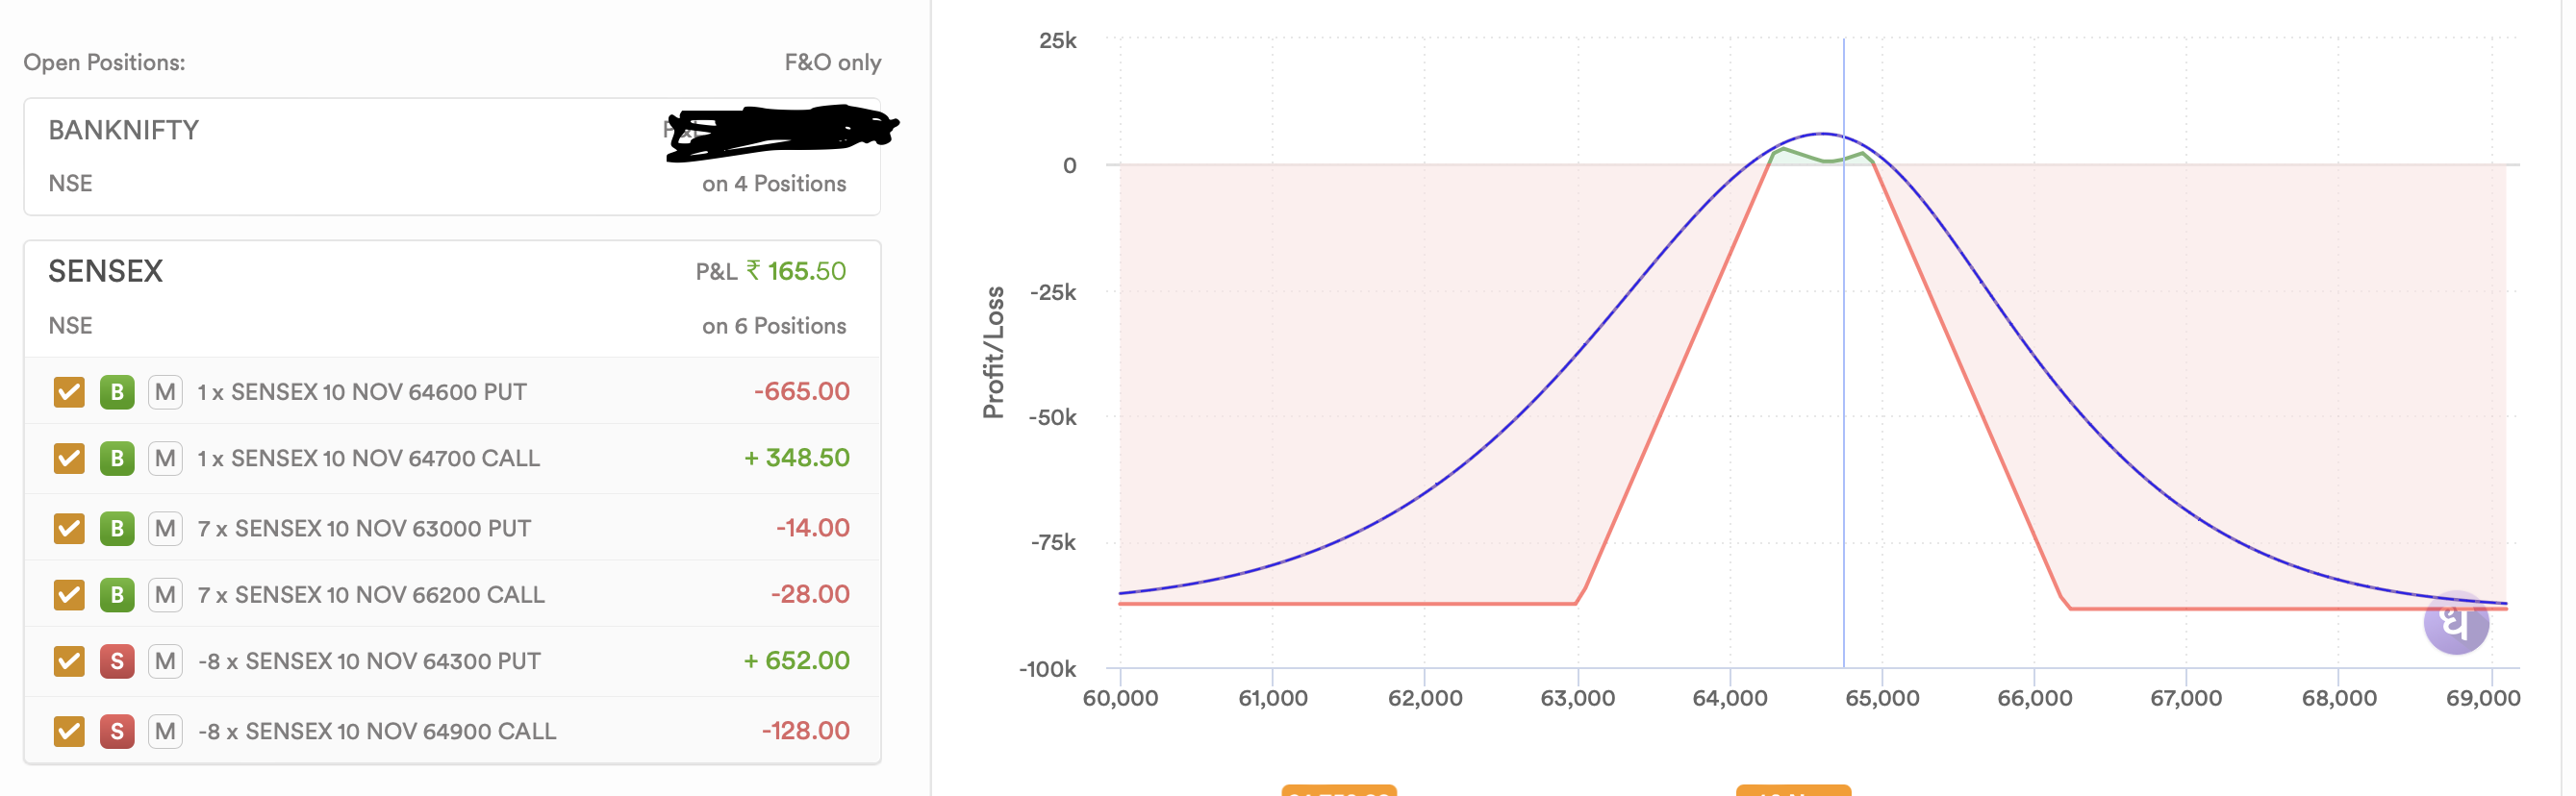
I do not have any concern about the pay-off curves. Rather I am more interested about the blue line i.e. the expected current P&L curve for different values of the underlying. To elaborate, look at the above chart, from the left hand side, we can see current PnL is 165.5. However, if you observe the blue line you can observe it is much higher than 165, which do not seems correct.
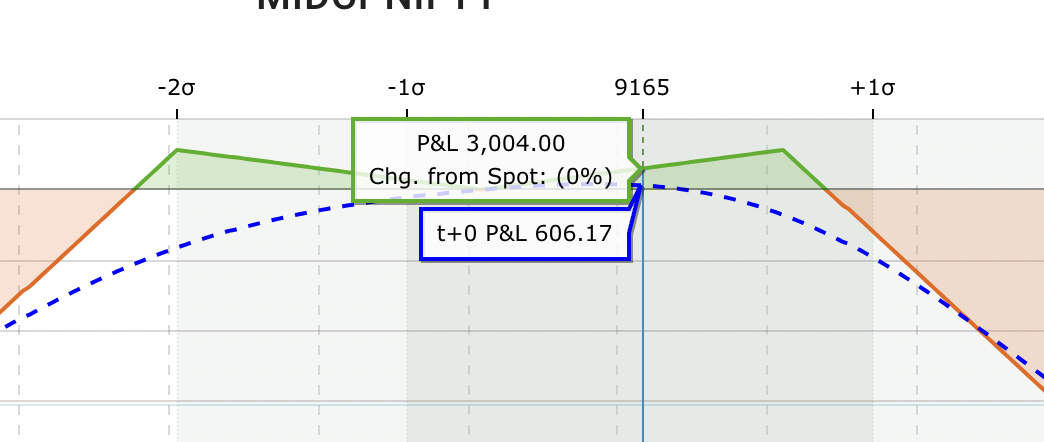
Correct chart should look like the ones we get from Opstra (as demonstrated in one of the above examples)