Hi @Everyone,
Most traders learn to read the market one candle at a time. A candle closes red, a candle closes green, and a story gets built around it. But that candle isn’t really one event — it’s the summary of thousands of individual trades that happened while it was forming. Buyers placing orders, sellers placing orders, some waiting patiently, some attacking the price immediately.
Order flow — also called market microstructure — is the study of what happens inside the candle. Once you can see the orders themselves instead of just the shape they leave behind, you start understanding markets the way large institutions and market makers do.
This guide breaks down the core ideas of order flow trading — limit orders vs. market orders, the Depth of Market (DOM), absorption, liquidity visualisation, and Cumulative Volume Delta (CVD) — and then walks through setting up Order Flow Lab, a free desktop tool built on the Dhan API, so you can start studying this yourself.
What Is Market Microstructure?
Market microstructure is the study of orders, how they interact, and the impact they have on price — particularly the behaviour of large participants such as market makers and institutions. It sits one layer beneath technical analysis: instead of interpreting the shape candles leave behind, you study the order activity that created that shape in the first place.
It’s a deep field, and it rewards patience — but even a basic understanding of order flow tends to sharpen the quality of the trading decisions built on top of it.
To understand it, you first need to know that every order in the market falls into one of two categories.
The Two Types of Orders
Limit Orders — Passive, Resting Liquidity
A limit order is placed at a specific price and simply waits there until the market reaches it. If Nifty is trading at 1252 and you place a buy limit order at 1251, nothing happens immediately — your order just sits, ready to be filled the moment price arrives.
These waiting orders are called resting liquidity. On the order book, they show up as:
- Bids — resting buy orders, stacked below the current price
- Asks / Offers — resting sell orders, stacked above the current price
Because limit orders don’t force a trade to happen, they don’t move price by themselves. If every trader in the market only placed limit orders and nobody was willing to trade immediately, price would simply stay still.
Market Orders — Aggressive, Price-Moving
A market order executes immediately, at whatever price is currently available. This is the order type that actually moves the market. When a market order arrives, it doesn’t wait in the queue — it consumes the resting limit orders sitting on the opposite side of the book until it’s completely filled.
Key idea: Limit orders create liquidity. Market orders consume liquidity. Price only moves when a market order eats through the resting orders at a level.
The order book — where every resting bid and ask can be seen stacked by price — is called the Depth of Market (DOM). Reading it raw, as a wall of numbers, is difficult. The figure below shows a DOM panel: BID and BUY columns on the left represent resting buy interest, SELL and ASK columns on the right represent resting sell interest, and the row highlighted with the dashed line marks the current traded price.
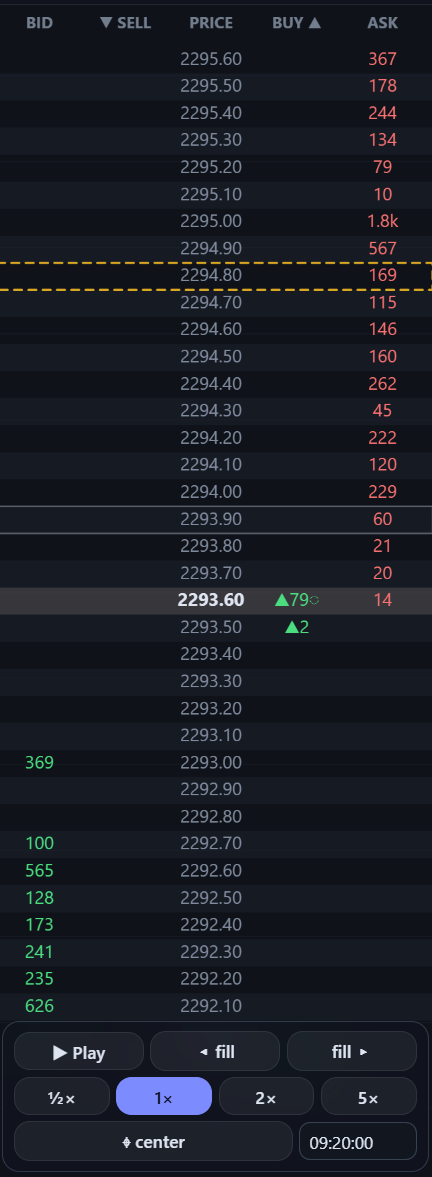
Figure 1 — A DOM (Depth of Market) panel. Each row is a price level; the numbers are the resting order quantity sitting at that price, waiting to be filled.
Watching Price Move, One Market Order at a Time
The cleanest way to understand this relationship is to watch it happen tick by tick. Picture a resting sell level sitting with, say, 5,100 quantity stacked on it. As long as no market order attacks that level, price stays exactly where it is.
Now a sell market order arrives — say 1,000 quantity. It eats into the resting buy orders on the other side, and price ticks down slightly. Another sell market order follows, larger this time, and price ticks down again. This is the entire mechanism of price discovery: a market order arrives, it consumes a resting level, and only then does the last traded price change.
If a big participant wants to sell a large quantity — say 33,000 contracts in total — that order doesn’t hit the market as one block. It gets filled gradually, level by level, chewing through whatever resting buy liquidity is available at each price before price is forced to move to the next level down.
The figure below is a real Order Flow Lab session replaying historical Nifty options data. The white step-line in the middle is price; the blue horizontal bars are resting liquidity sitting at each level; the red and green boxes mark sell and buy market orders as they arrive; and the cyan line at the bottom is Cumulative Volume Delta, which is covered later in this guide.
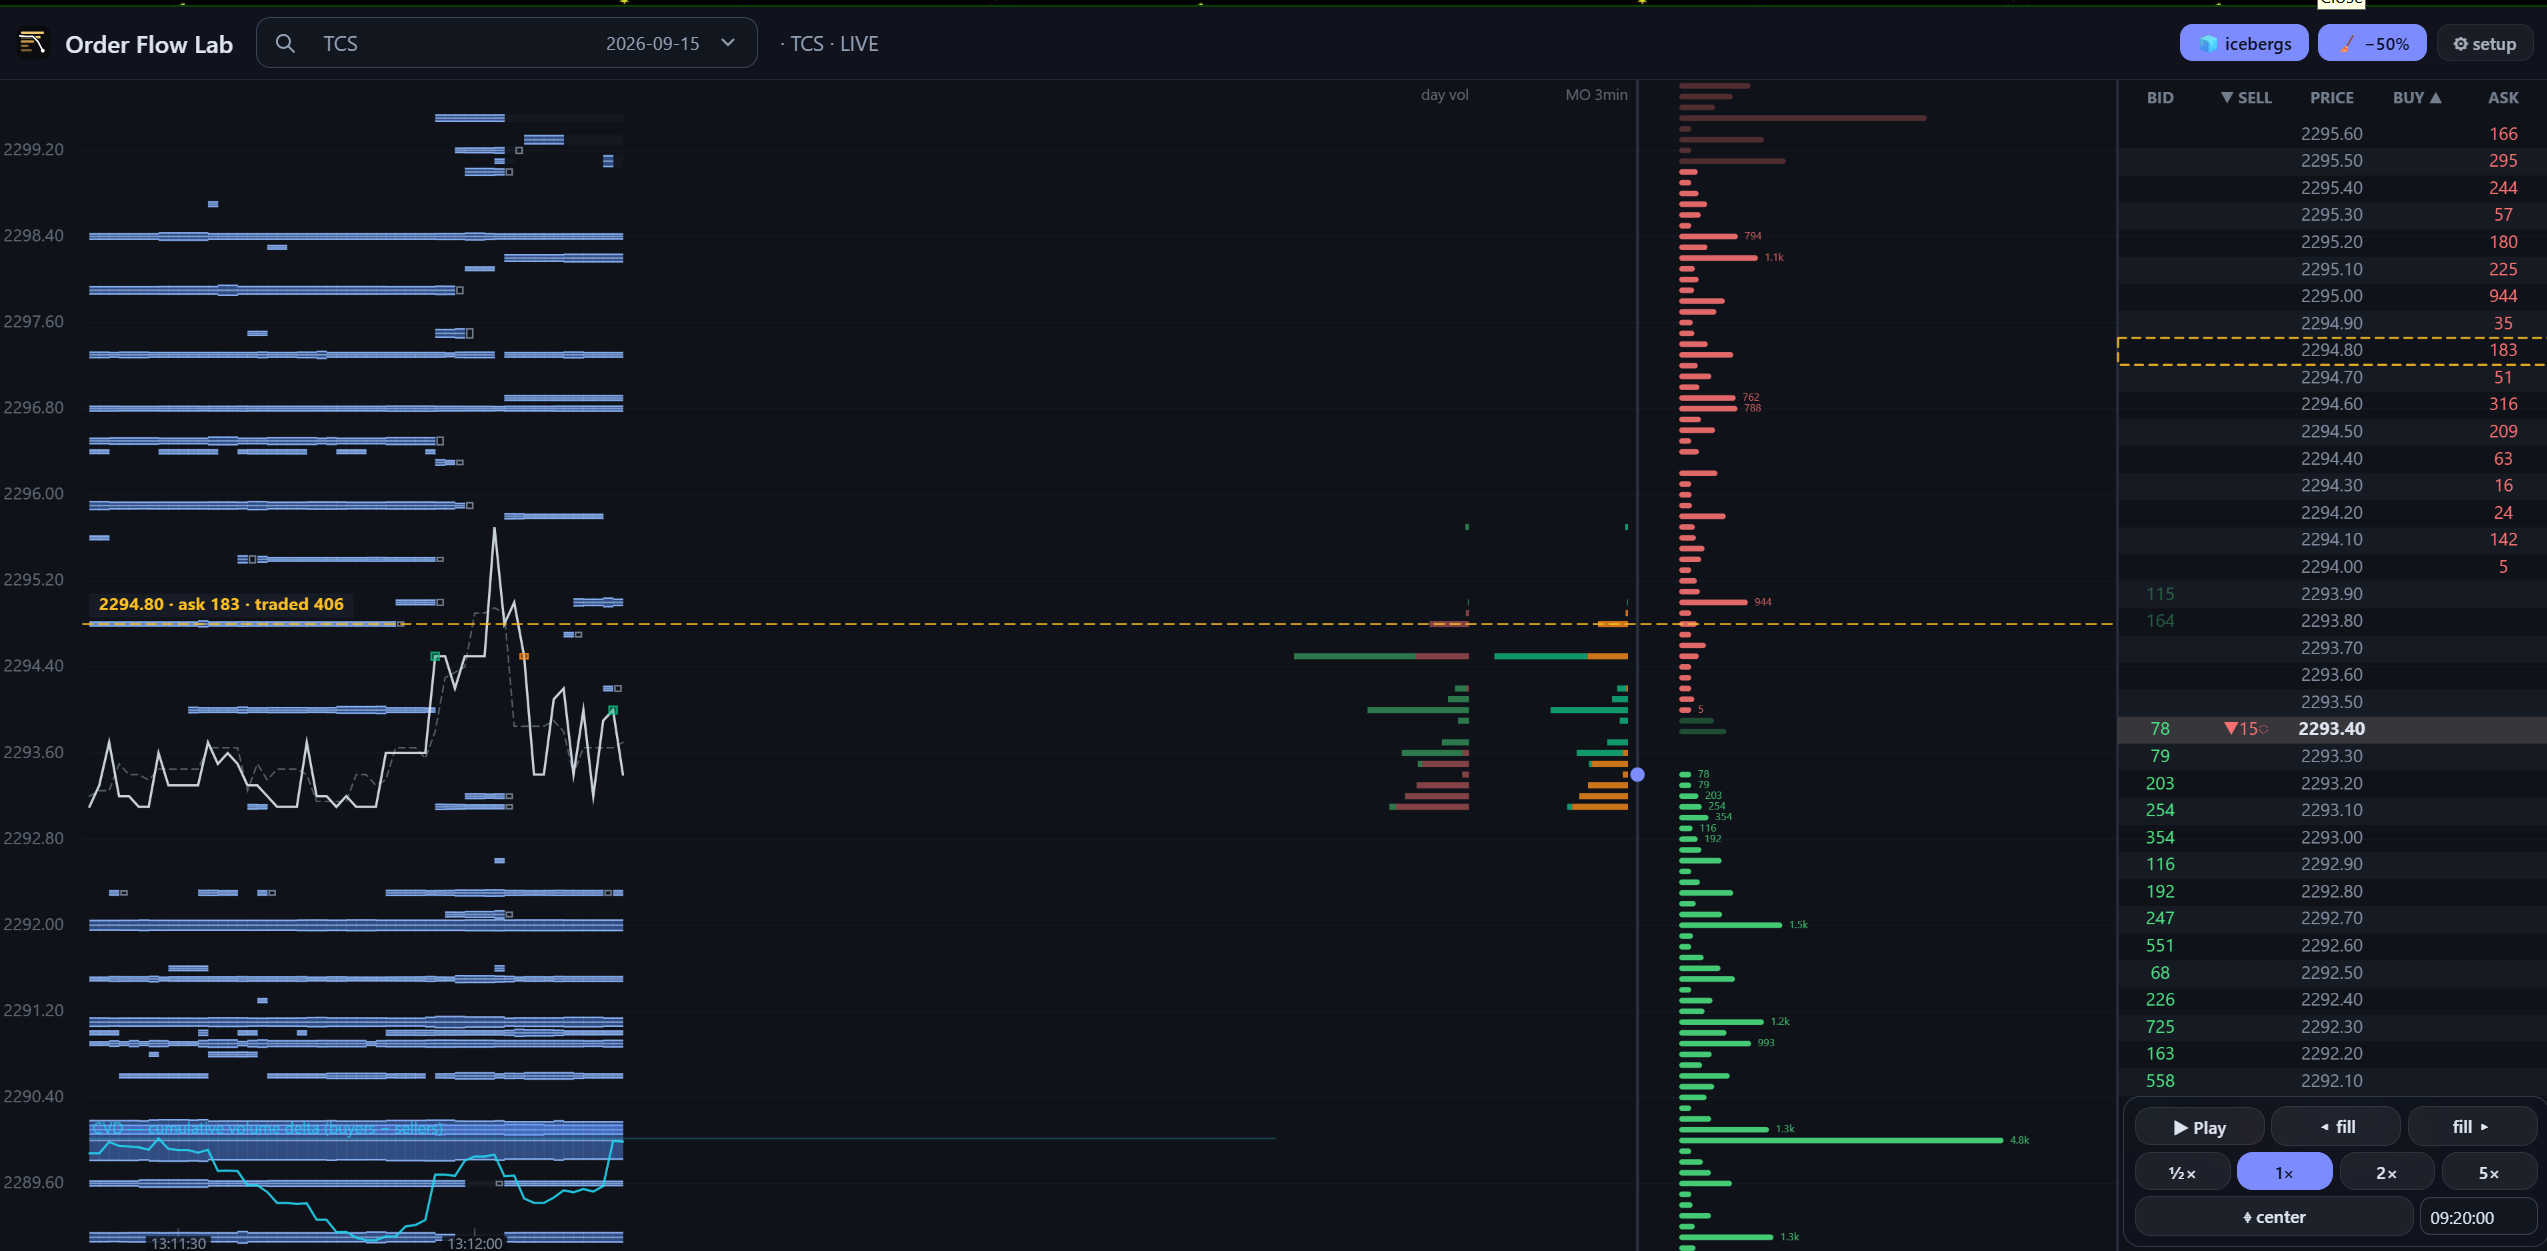
Figure 2 — A full Order Flow Lab session. Price (white line), resting liquidity (blue bars), market orders (red/green boxes) and CVD (bottom panel) plotted together for a Nifty options contract.
Absorption: When a Huge Order Doesn’t Move Price
Here’s where it gets interesting. Sometimes a very large market order hits a level — 19,000 quantity, for example — and price simply does not move. Not even one tick.
That doesn’t mean nothing happened. It means the resting limit order sitting at that level was large enough to absorb the entire market order without being fully consumed. This is called absorption, and it’s one of the most useful signals in order flow trading — it tells you a big, patient participant (often an institution or market maker) is defending that price level.
Note: A resting order large enough to repeatedly absorb incoming market orders without visibly depleting is often referred to as an iceberg order — only a small visible portion shows on the book, while the real size stays hidden and keeps refilling.
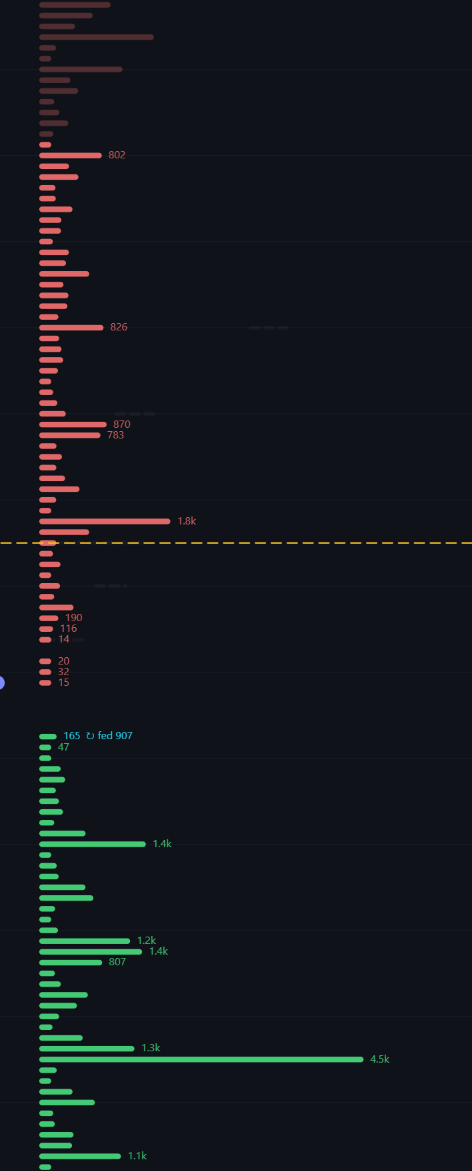
Figure 3 — Absorption at work. The large sell quantity sitting at this level (highlighted) is repeatedly absorbing incoming sell market orders without price breaking through.
Absorption also explains how liquidity levels eventually break. If a level is defending with roughly 41,000 in resting size and a market order of 80,000 arrives, the defence simply isn’t large enough — the level gets consumed entirely, and price moves sharply through it, because there’s nothing left resting to slow it down.
| Scenario | Resting liquidity | Incoming market order | Result |
|---|---|---|---|
| Absorption | 19,000 | 19,000 | Price holds — the level absorbs the order |
| Defence holding | 41,000 | Smaller than 41,000 | Price holds, level still intact |
| Level breaks | 41,000 | 80,000 | Level is wiped out, price moves sharply |
Real Support & Resistance — Visible Before Price Arrives
Traditional support and resistance is usually drawn from pivot points or past price reaction — an educated guess based on where price previously turned. Order flow gives you something more concrete: you can watch resting liquidity build up at a level before price even reaches it.
Replaying historical data makes this obvious. As price rises toward a level where sellers have already stacked resting orders, you can see resistance forming in real time on the DOM, well before the candle actually reacts to it. The same happens on the way down — buyers quietly stack resting bids at a level, price arrives, and it bounces off genuine resting demand rather than a hypothetical pivot line.
This is the real value of studying order flow: instead of reacting to price after the fact, you start anticipating where it’s likely to pause, because you can see the actual orders waiting there.
The Four Players Behind Every Price Move
Every tick in the market is the result of an interaction between four types of participants:
| Participant | Order type | Behaviour |
|---|---|---|
| Aggressive buyers | Market buy orders | Force price up by consuming resting sell liquidity |
| Aggressive sellers | Market sell orders | Force price down by consuming resting buy liquidity |
| Passive buyers | Resting limit buy orders | Provide support; wait to be filled |
| Passive sellers | Resting limit sell orders | Provide resistance; wait to be filled |
As these four groups interact — new market orders arriving, new resting liquidity forming — price moves in response. Understanding this interaction is, in effect, understanding the mechanics of the stock market itself.
Cumulative Volume Delta (CVD): Measuring Pressure
The final and arguably most useful piece of the puzzle is Cumulative Volume Delta (CVD).
CVD is a running total of aggressive buying minus aggressive selling:
CVD = (Total buy market order volume) − (Total sell market order volume), accumulated over time
It’s plotted as a continuous line alongside price, and it tells you how aggressive the current move really is:
- CVD rising → buy market orders are dominating → buying pressure is strong → price is likely to keep moving up
- CVD falling → sell market orders are dominating → selling pressure is strong → price is likely to keep moving down
The real value of CVD is as a confirmation tool. If price is rising and CVD is rising with it, the move is backed by genuine aggressive buying — it’s a real trend. If price rises while CVD is flat or falling, that’s a warning sign: the move may be thin, or driven by something other than real aggressive demand, and worth treating with caution.
In the earlier full-session figure (Figure 2), notice how the CVD line at the bottom tracks the price line above it — rising into the same stretches where large green (buy) market order boxes appear, and dipping where red (sell) boxes dominate. That correlation, tick by tick, is exactly what makes CVD a useful “second opinion” on any move you’re watching.
How to Download and Use Order Flow Lab
Everything above can be studied hands-on using Order Flow Lab, a free desktop application that connects to your own Dhan account and plots live order flow, DOM, resting liquidity, and CVD for any stock, future, or option you choose to watch. It runs entirely on your own computer — there’s no server involved, and no data leaves your machine except the calls Dhan’s own API requires.
Step 1: Download the Order Flow Lab EXE
Download the Order Flow Lab package and extract it. Inside the extracted folder you’ll find the application itself along with the license, installation notes, and a data folder where your recorded order book files will be saved.
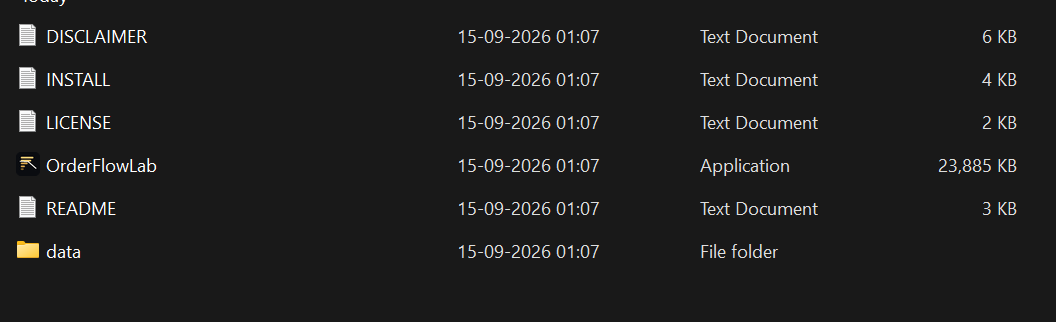
Figure 4 — The extracted Order Flow Lab folder, containing the application, install notes, and the local data folder.
Step 2: Extract and Run It
Run OrderFlowLab.exe. On first launch it opens directly to the Setup screen, which has two parts: your Dhan API credentials, and your watchlist. Everything here is stored locally in a config.json file on your own machine.
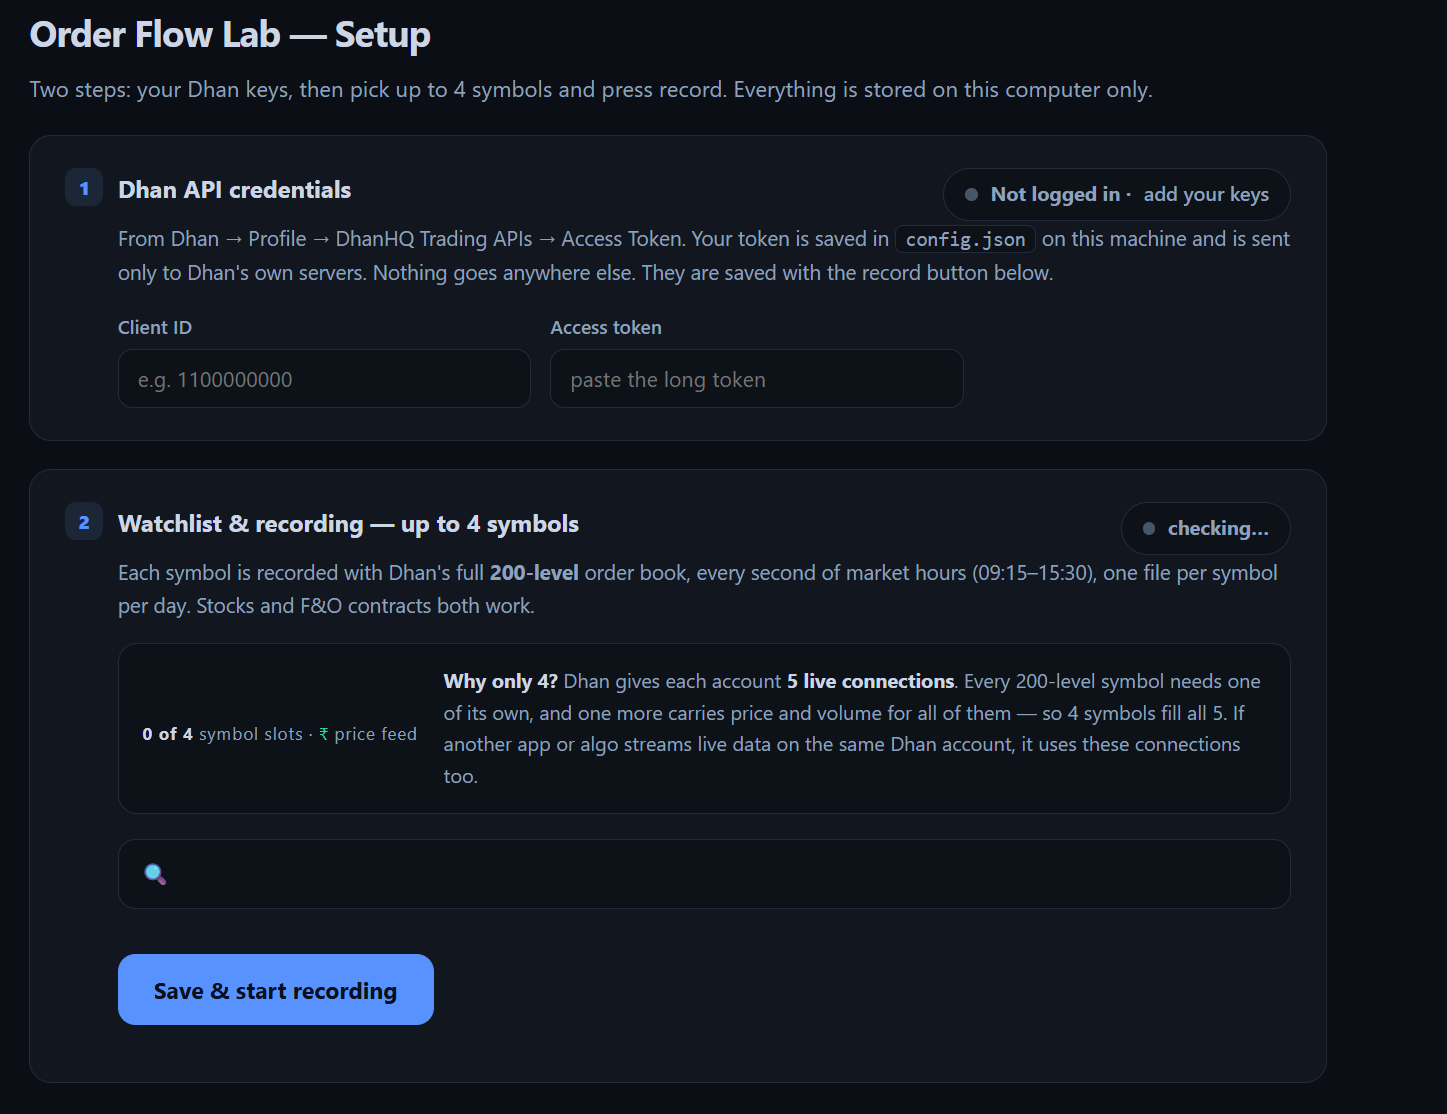
Figure 5 — The Setup screen on first launch, showing the two setup steps: Dhan API credentials and watchlist & recording.
Step 3: Get Your Dhan API Credentials
Order Flow Lab needs your Dhan Client ID and an Access Token to pull live order book data. Both come from your own Dhan account:
- Log in to Dhan, open your profile menu, and select Get Trading & Data APIs.
- On the DhanHQ Trading & Investing APIs page, open the Generate Access Token / API Key tab.
- Click Generate new Access Token, give it an application name, choose a validity period, and click Generate Access Token.
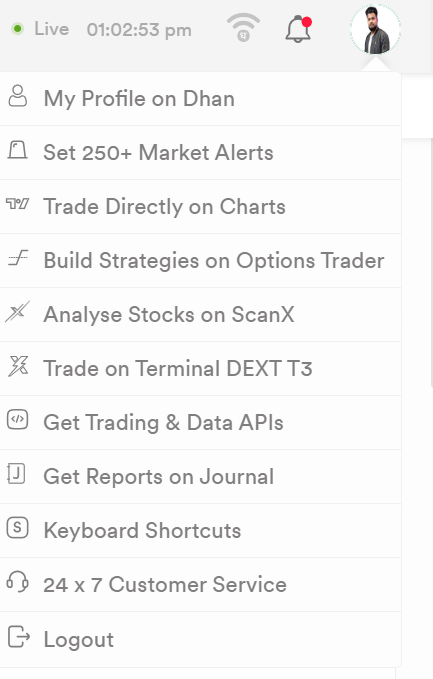
Figure 6 — The Dhan profile menu, with “Get Trading & Data APIs” as the entry point.
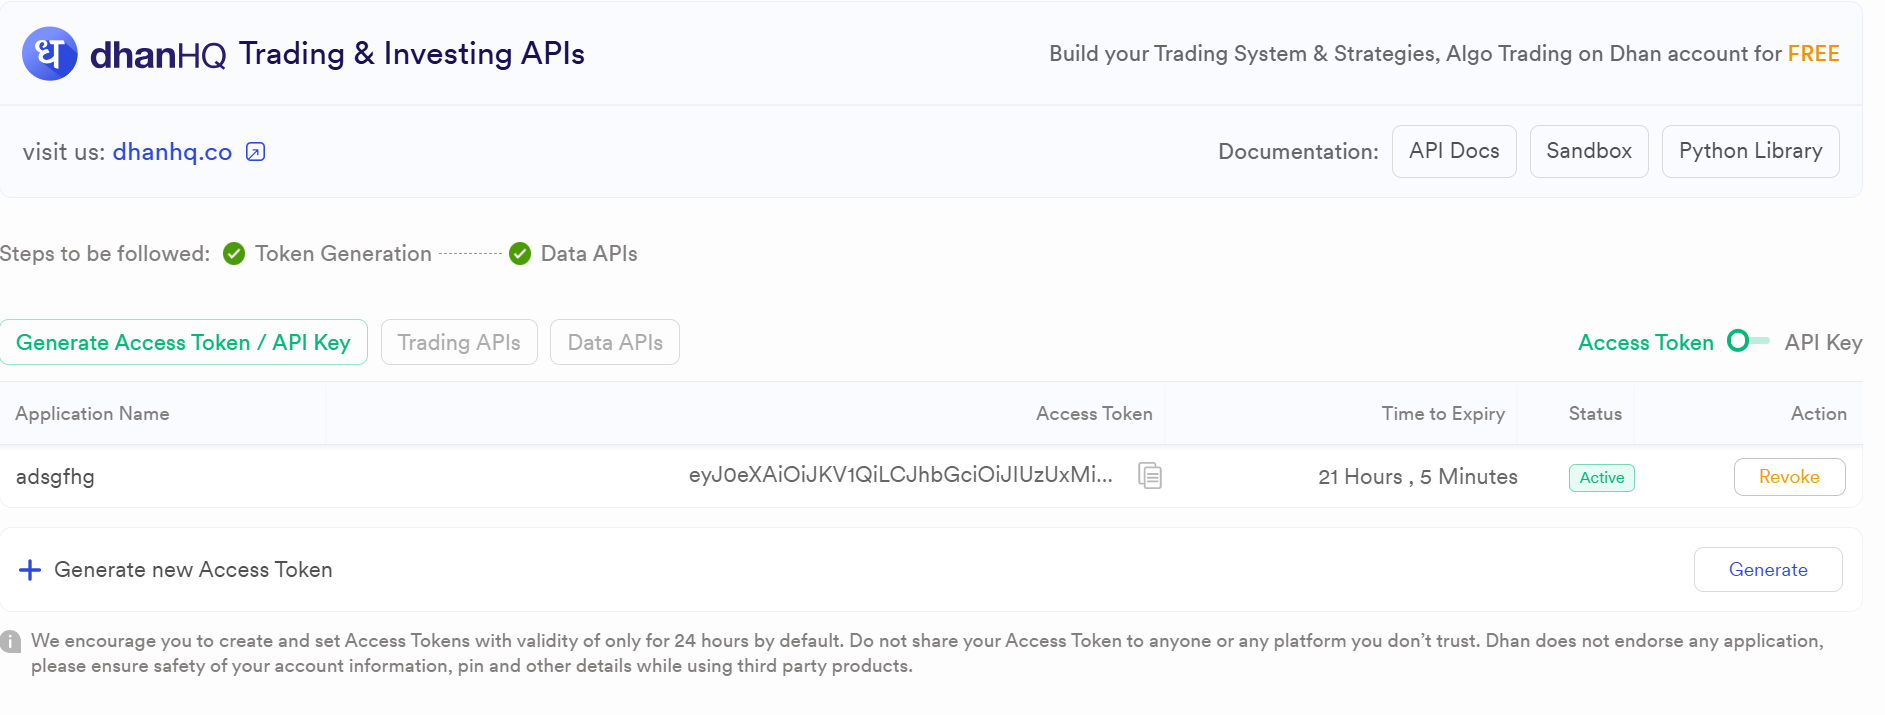
Figure 7 — The DhanHQ Trading & Investing APIs dashboard, where access tokens are generated and managed.

Figure 8 — Generating a new Access Token, by naming the application and setting a validity period.
Tip: Dhan recommends generating tokens with a 24-hour validity by default. Never share your access token with anyone or paste it into a platform you don’t trust — treat it the same way you’d treat a password.
Copy the generated token and your Client ID back into the Order Flow Lab setup screen, under Dhan API credentials.
Step 4: Build Your Watchlist
Order Flow Lab lets you record up to 4 symbols at a time — any mix of stocks, futures, and options. Each symbol you add is recorded with Dhan’s full 200-level order book, captured every second through market hours (09:15–15:30), with one data file saved per symbol per day.
Use the search box to add whatever you want to study. You can search by stock name, or by contract — for example, typing an index and strike brings up every available options expiry:
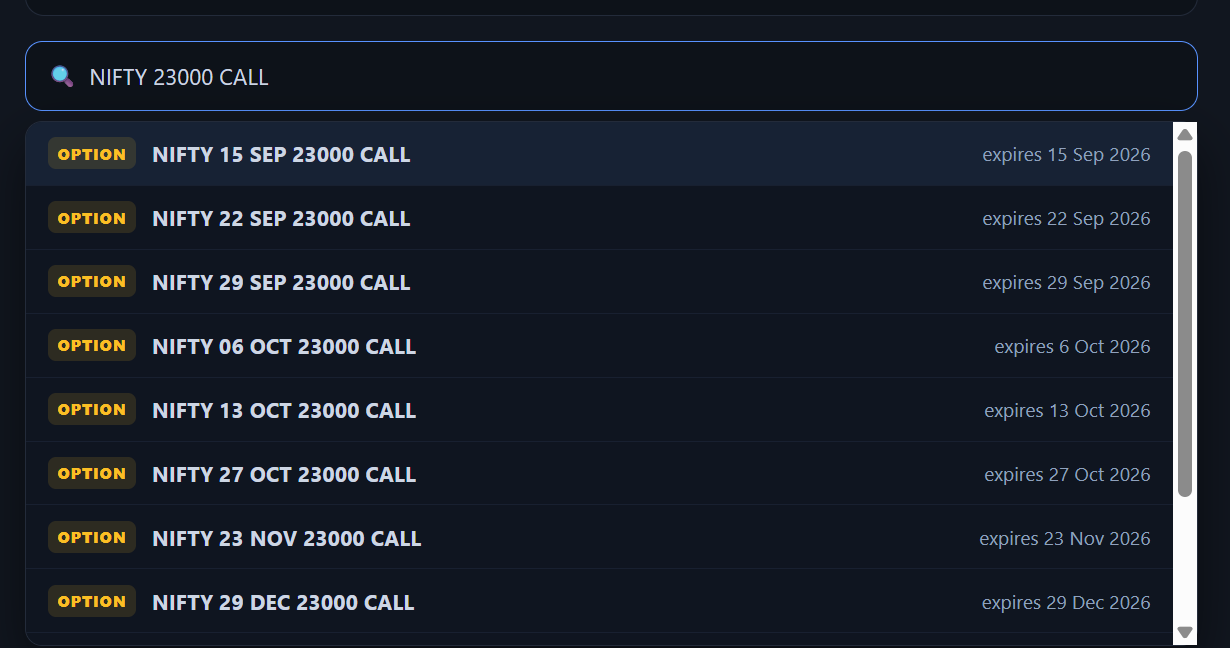
Figure 9 — Searching for an options contract. Typing “NIFTY 23000 CALL” lists every available expiry for that strike, from the current week out to December.
A plain stock search shows all the contract types available on that underlying — the cash stock itself, its current futures contract, and its option chain:
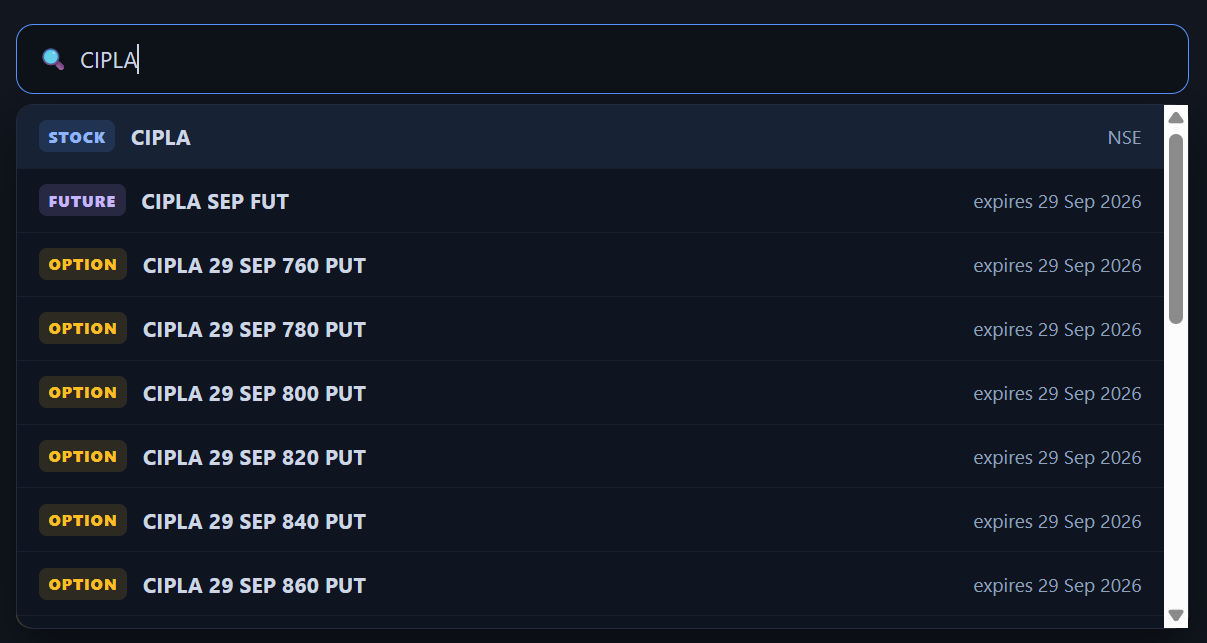
Figure 10 — Searching for a stock (“CIPLA”) returns the stock, its futures contract, and its options — so you can add whichever instrument you actually want to watch.
As you add symbols, they fill the four available slots. A typical mixed watchlist — one option and three stocks — looks like this before it’s saved:
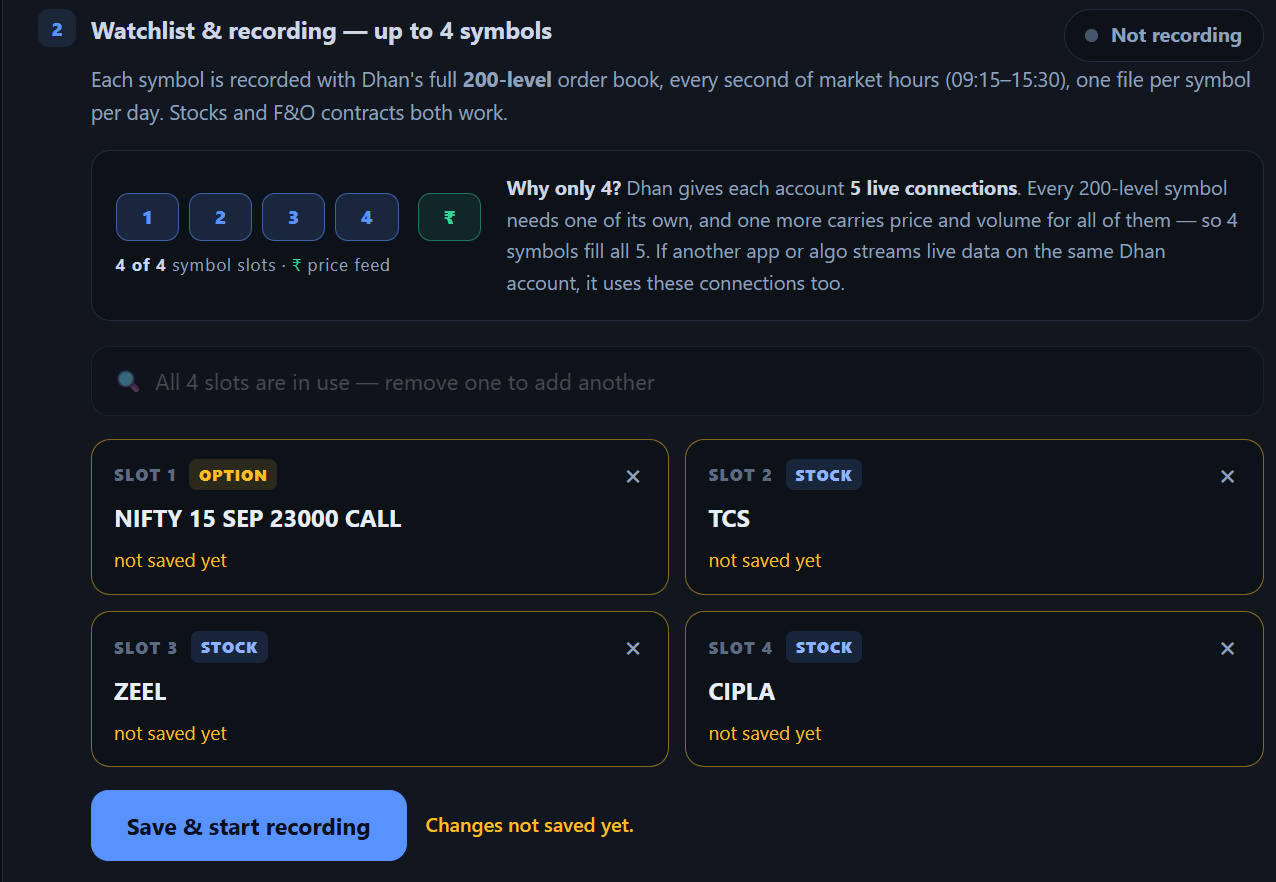
Figure 11 — A watchlist with all 4 slots filled, mixing an options contract (NIFTY 15 SEP 23000 CALL) with three stocks (TCS, ZEEL, CIPLA), not yet saved.
Why only 4 symbols? Dhan gives each account 5 live data connections. A full 200-level order book for one symbol needs a dedicated connection of its own, and one additional shared connection carries price and volume for all of them — so 4 symbols use up all 5 available connections. If any other app or algorithm is also streaming live data on the same Dhan account, it draws from this same pool.
Step 5: Save & Start Recording — Then Read the Live Chart
Click Save & start recording. Order Flow Lab immediately starts pulling live data for all four symbols, and the panel updates to show each one ticking in real time along with a running row count for the session:
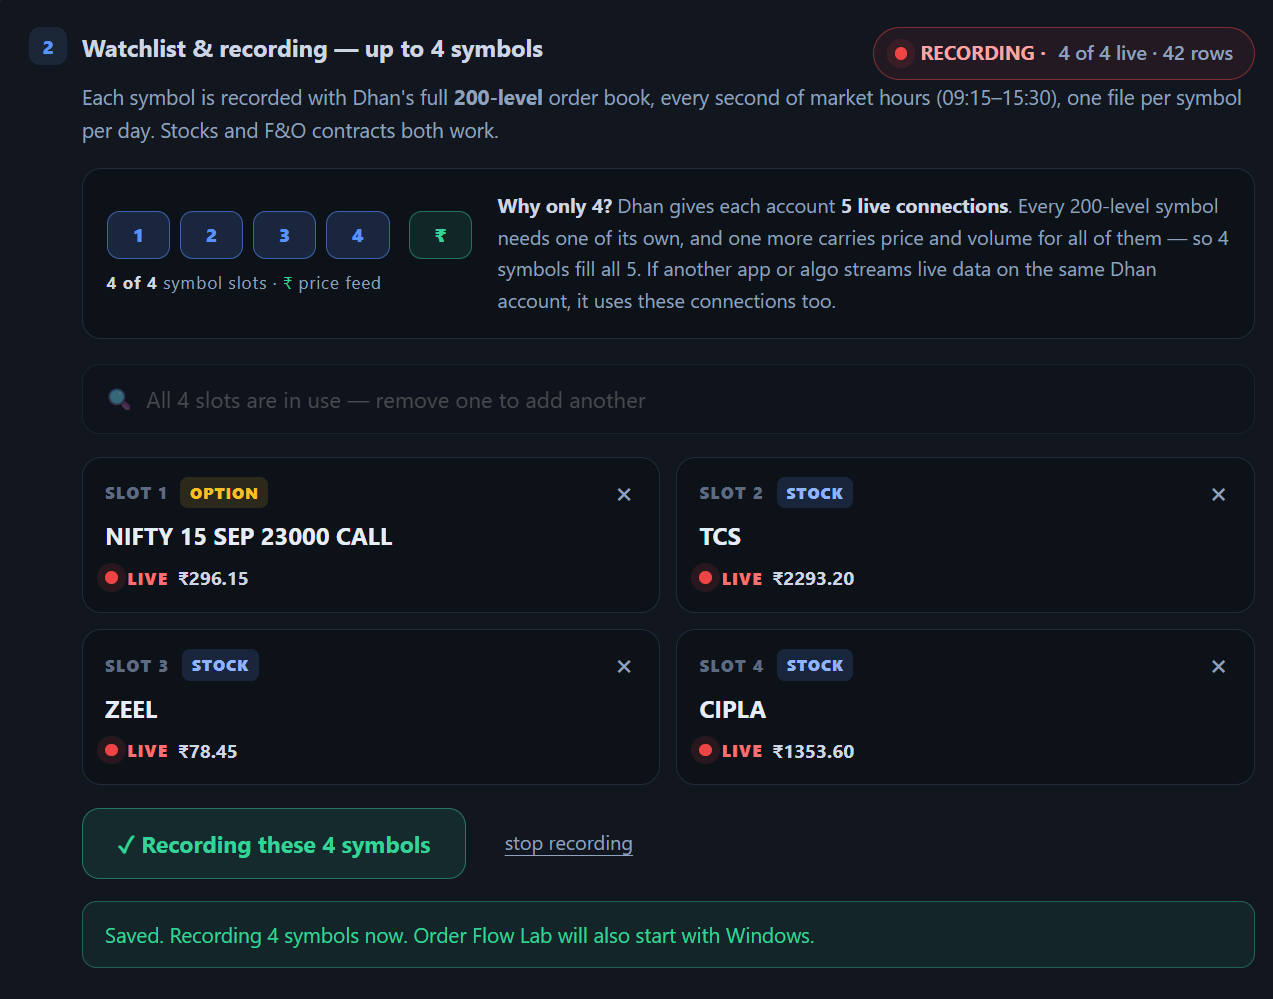
Figure 12 — Recording live. All 4 symbols are connected and streaming, with live prices updating and a confirmation that recording will also resume automatically on Windows startup.
Back on the main chart, the search box now shows a LIVE badge next to every symbol currently being recorded — making it easy to jump between the instruments in your watchlist:
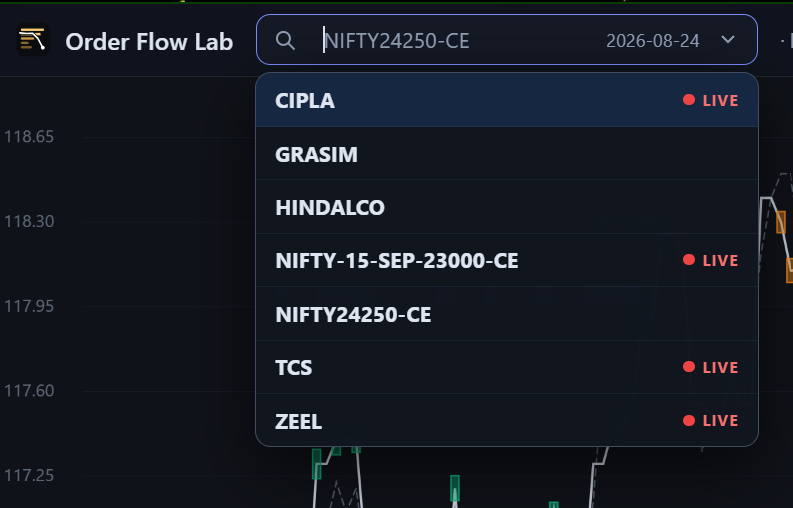
Figure 13 — The symbol search dropdown, with a LIVE badge marking the symbols currently being recorded.
Selecting a live symbol opens the full chart — price on the left, the DOM on the right, and CVD along the bottom — updating tick by tick exactly as described earlier in this guide:
Figure 14 — A live chart for TCS, showing real-time price action, resting liquidity bars, and the live DOM panel on the right.
The compression control in the top right lets you zoom the DOM out to see liquidity spread across a wider price range:
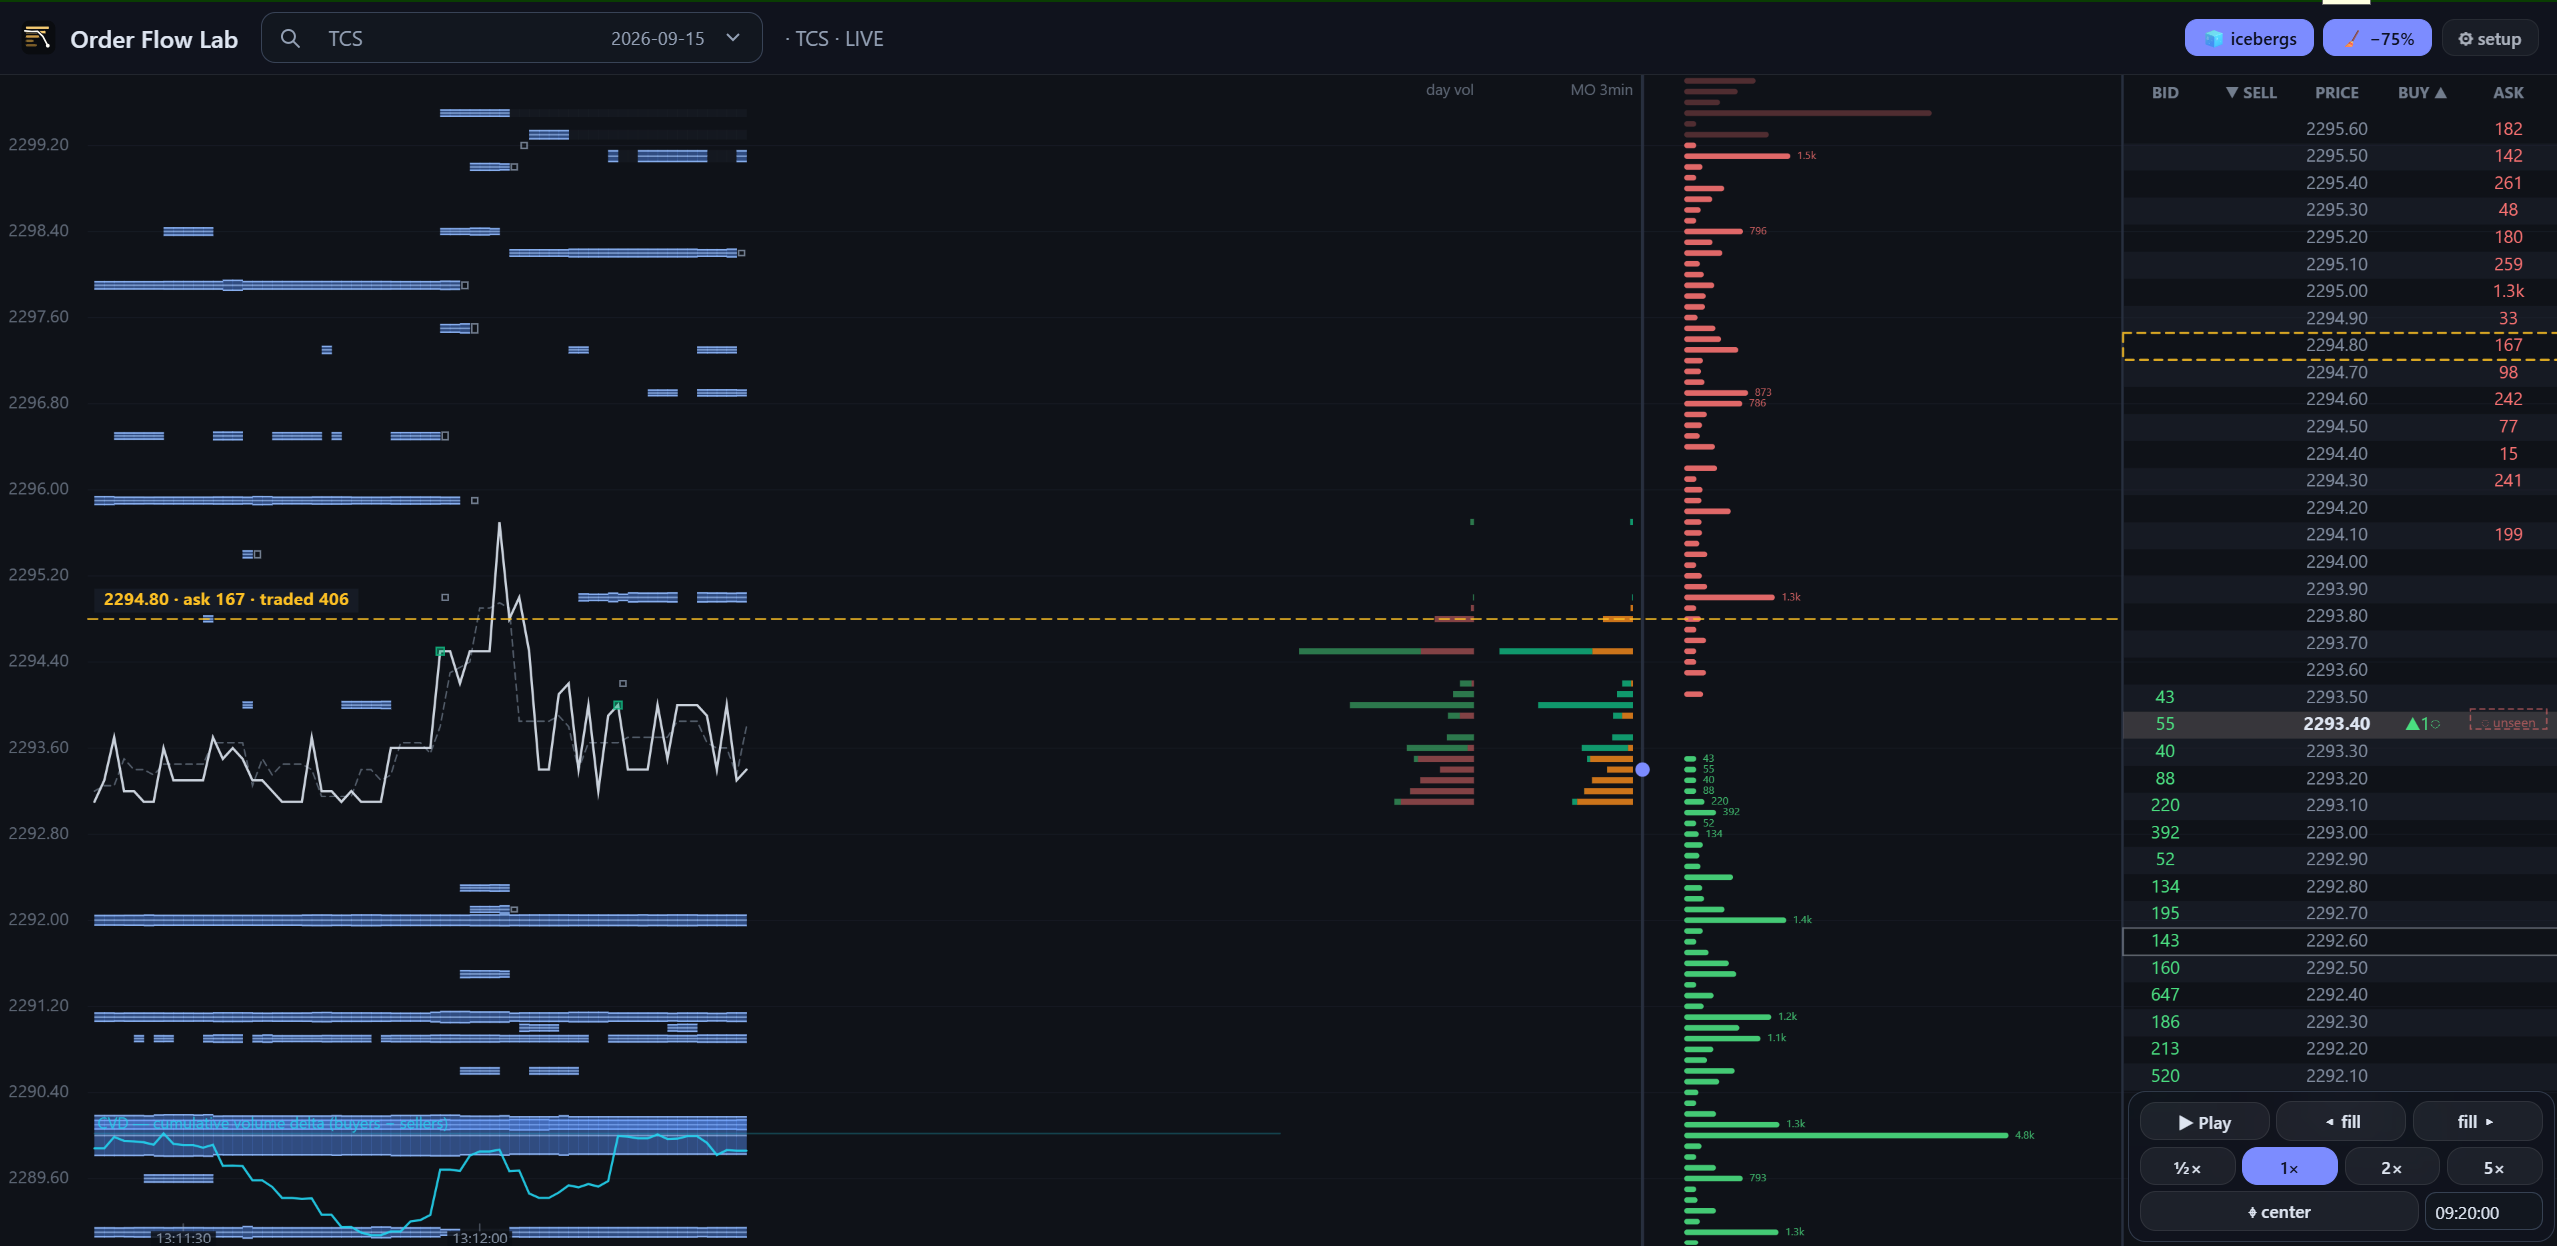
Figure 15 — The same TCS chart compressed to −75%, spreading the visible DOM across a wider price range to spot liquidity clusters further from the current price.
Toggling full book switches the right-hand liquidity bars into a complete depth view for the entire visible range, useful for scanning the whole book at once rather than just the levels near the current price:
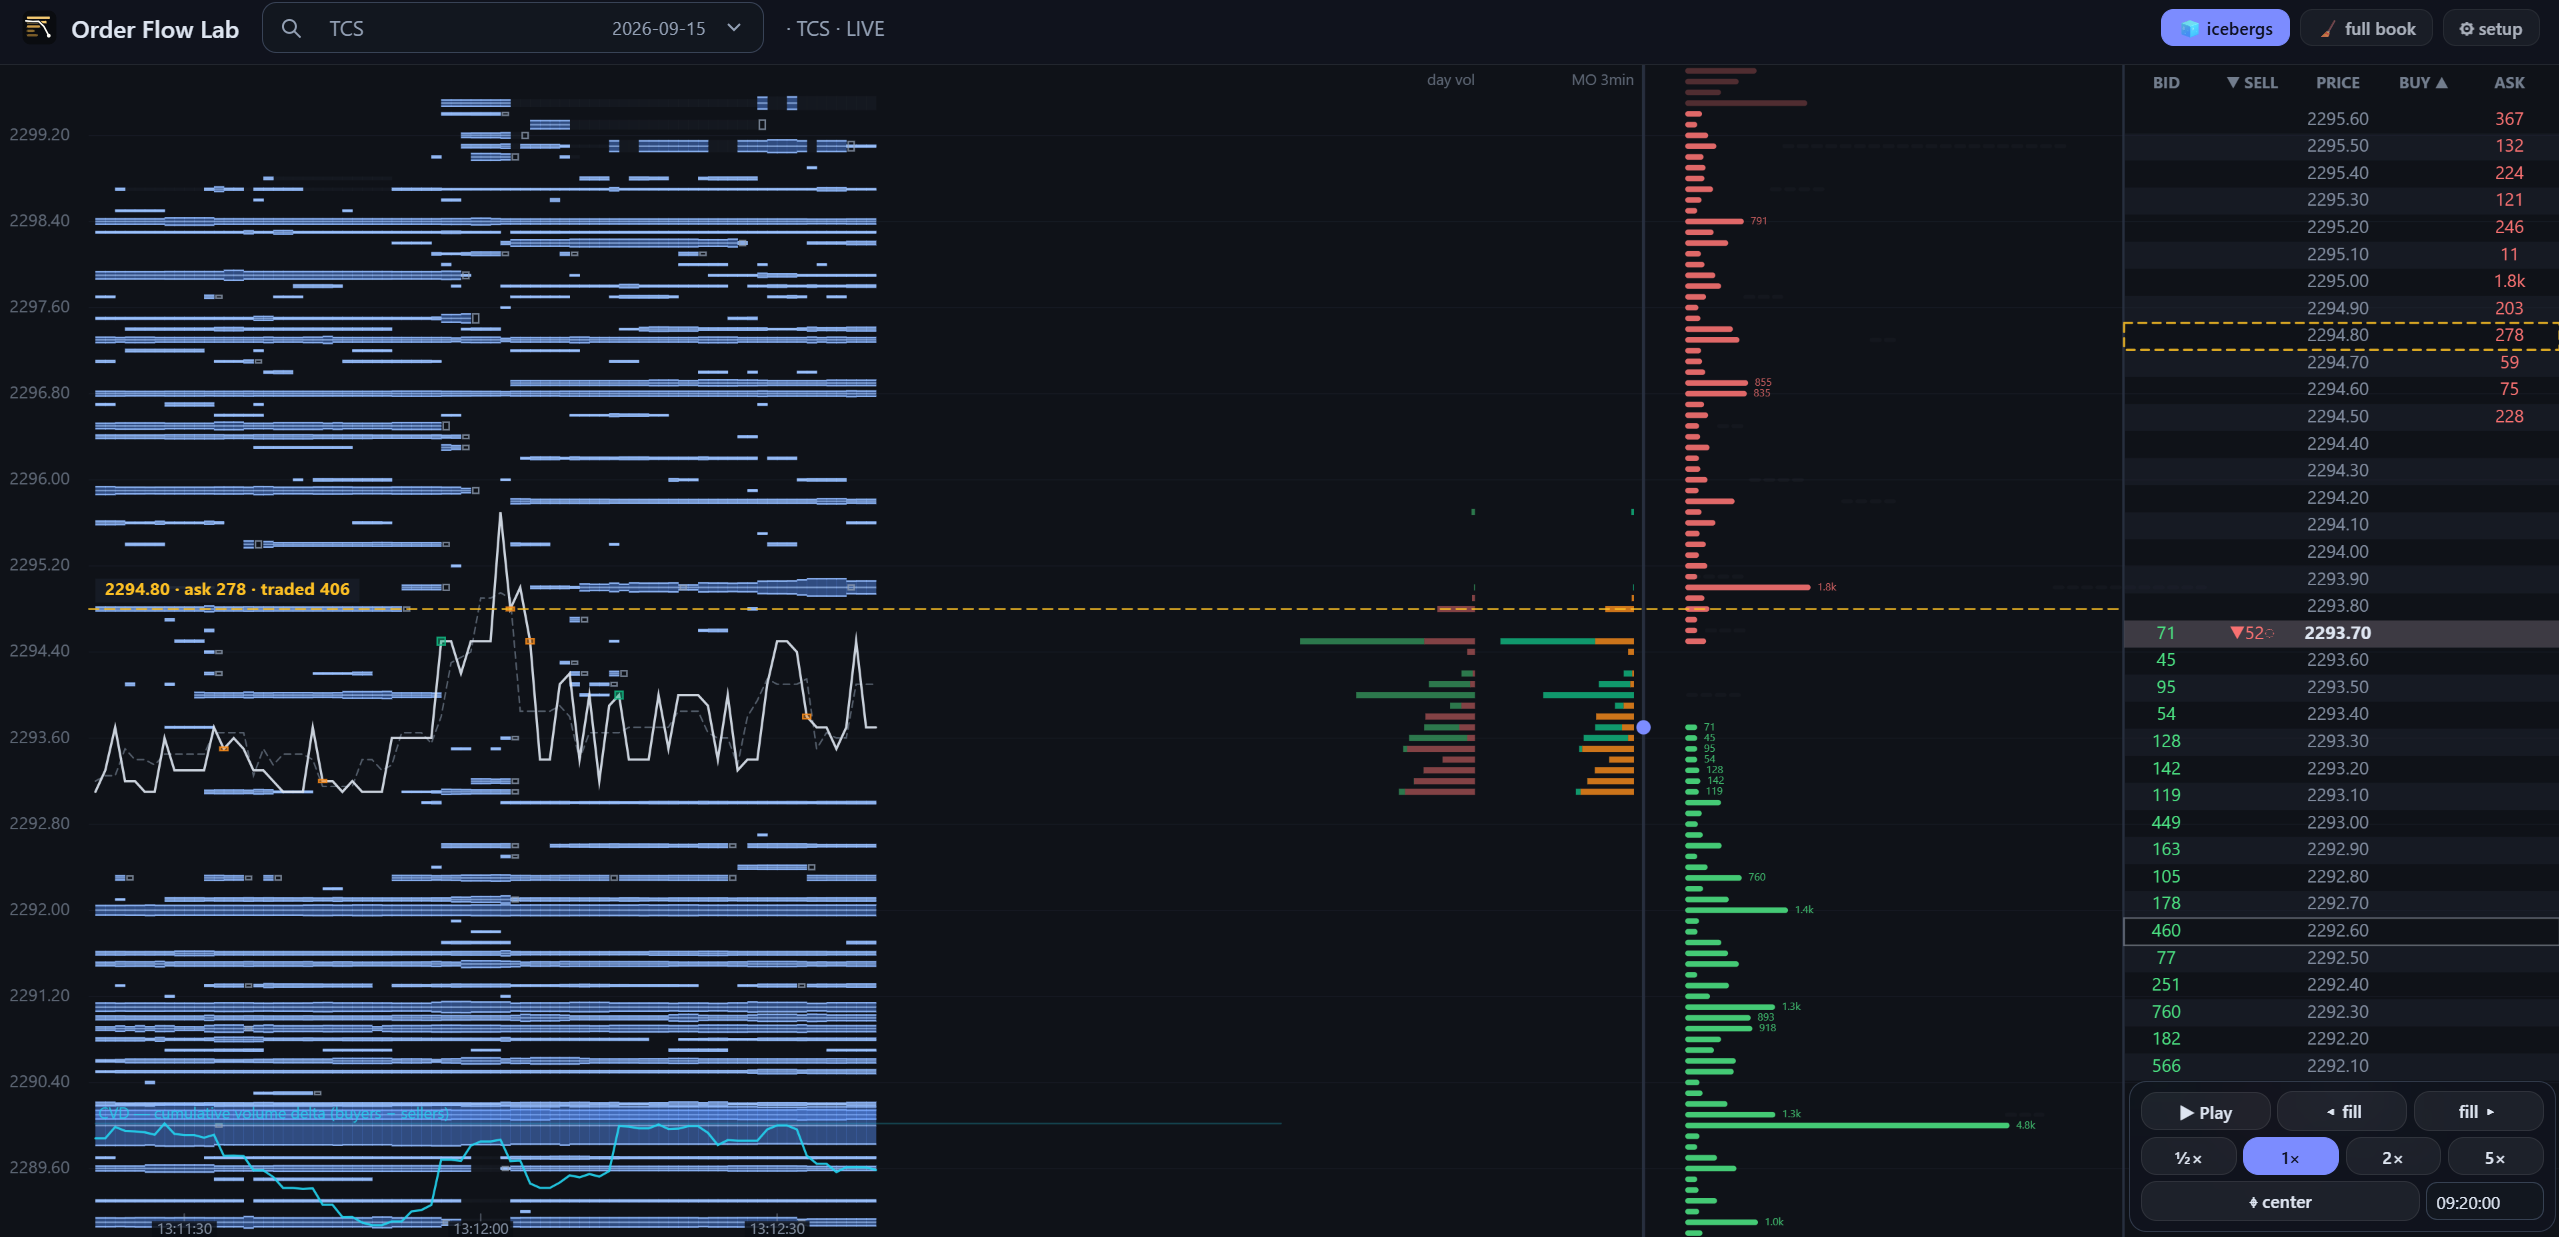
Figure 16 — Full book view, showing the complete depth of resting liquidity across the visible chart range.
That’s the complete loop: get your API credentials once, build a watchlist of up to four instruments, save it, and Order Flow Lab keeps recording and plotting live order flow for as long as the market is open — with every session also saved locally so you can replay it later, exactly like the historical Nifty example used earlier in this guide.
Set realistic expectations: none of this turns into a finished trading strategy in a day or two. Reading order flow well — telling real absorption from noise, recognising which liquidity levels actually matter — typically takes sustained study over months, not a single weekend. Treat this tool as a lens for that study, not a shortcut past it.
Resources
- YouTube Video: https://youtu.be/eBTR8f5UewI?si=OXkhaWtt3pYWN9Vm
- Order Flow Lab download: Google Drive folder