(Partially Implemented) Features Suggestion

  1. After taking a position at market or limit, try to include profit as a parameter to exit the trade in " Target" placed
  2. Could you please provide me with the underlying formula used in calculating implied Volatility, Annualized or historical volatility & forecasted volatility of a stock by dhan
  3. Also try to show % of profit we made for the day by the day’s end.( i.e. % we able to capture along with custom time period will help)
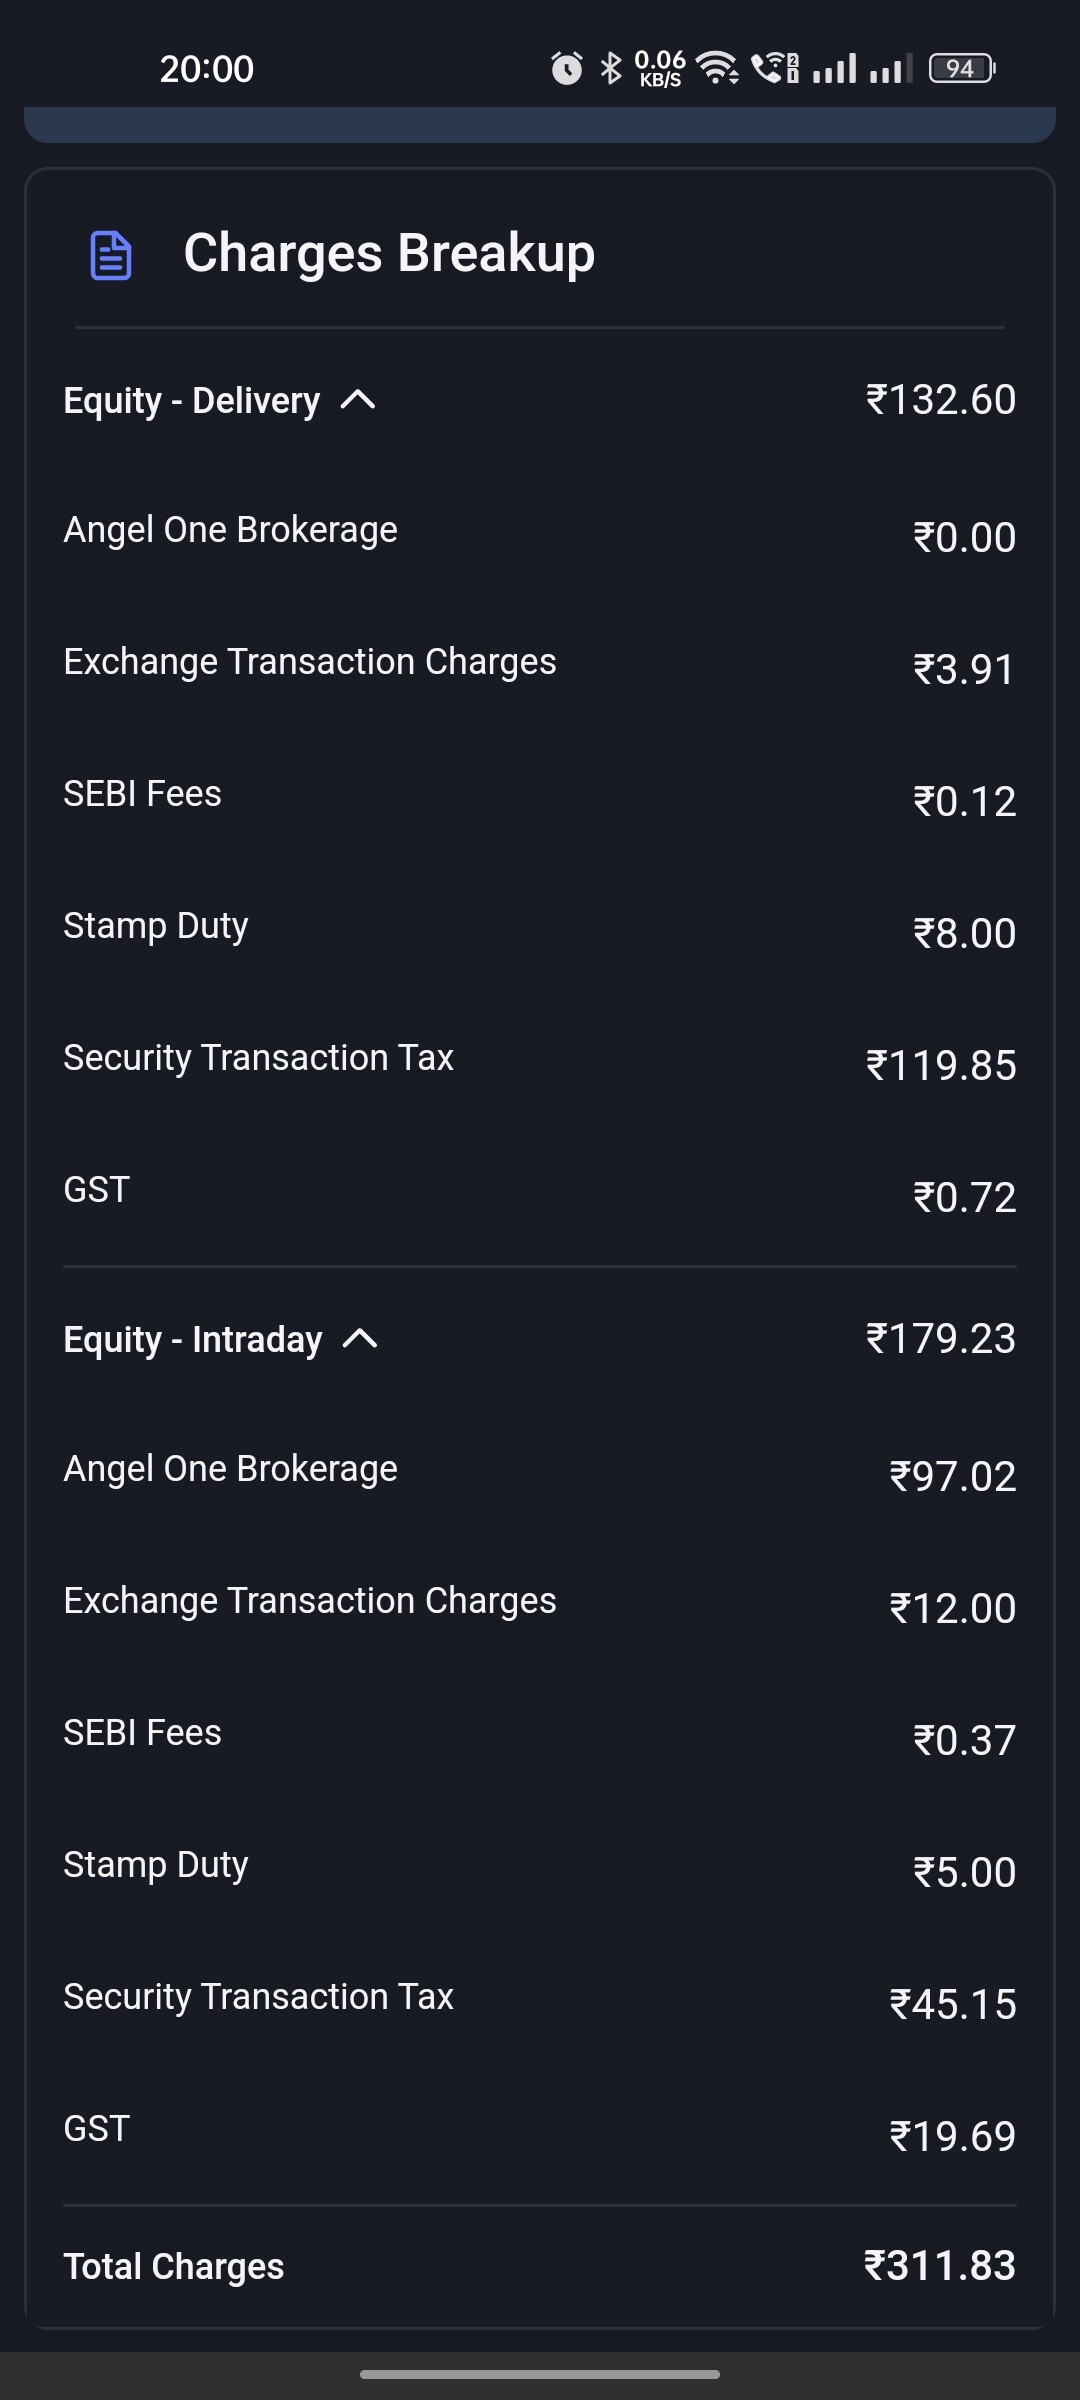
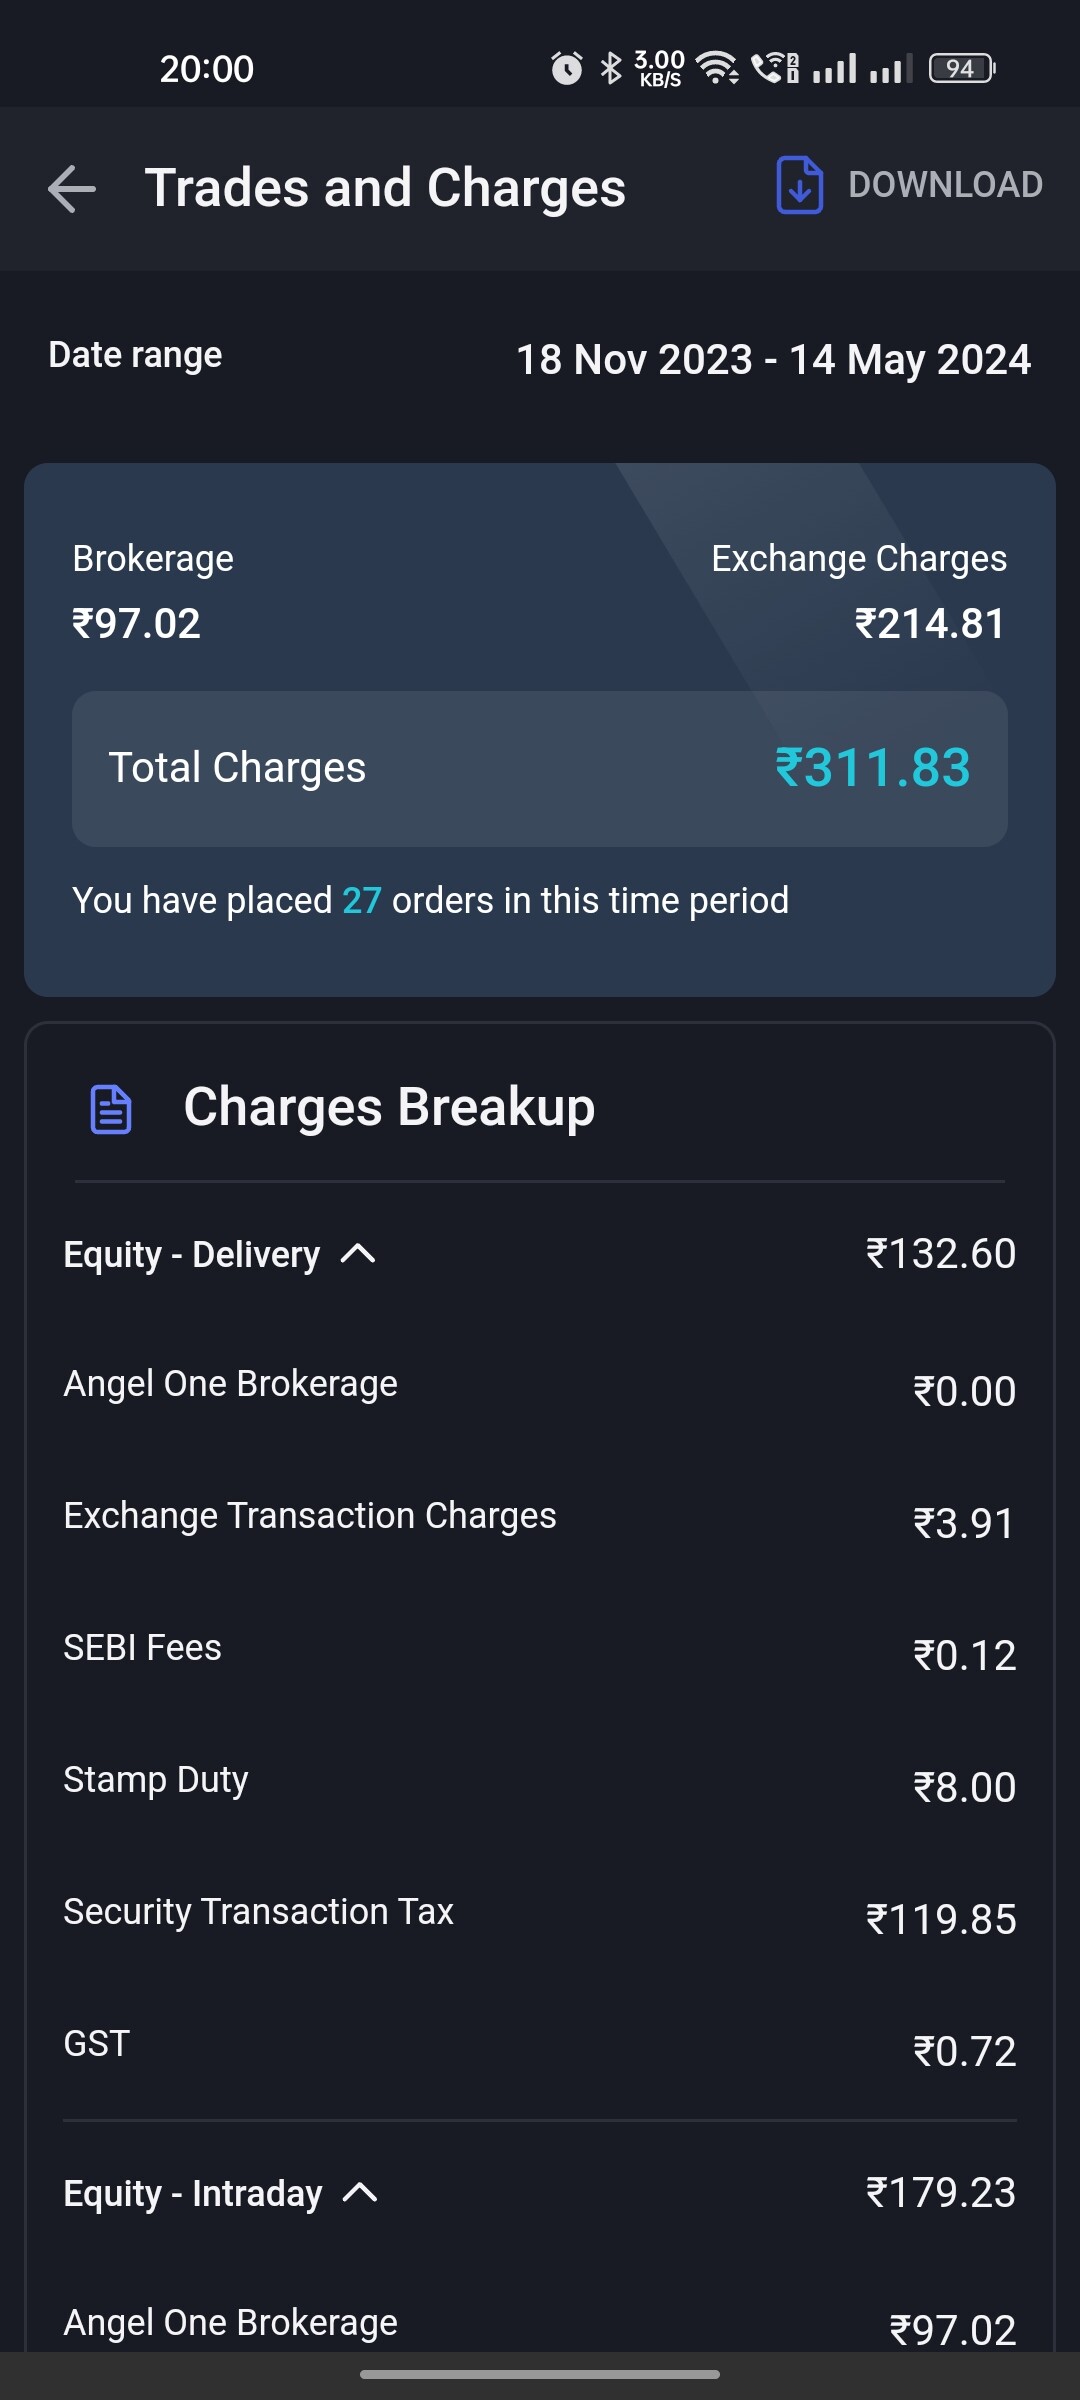
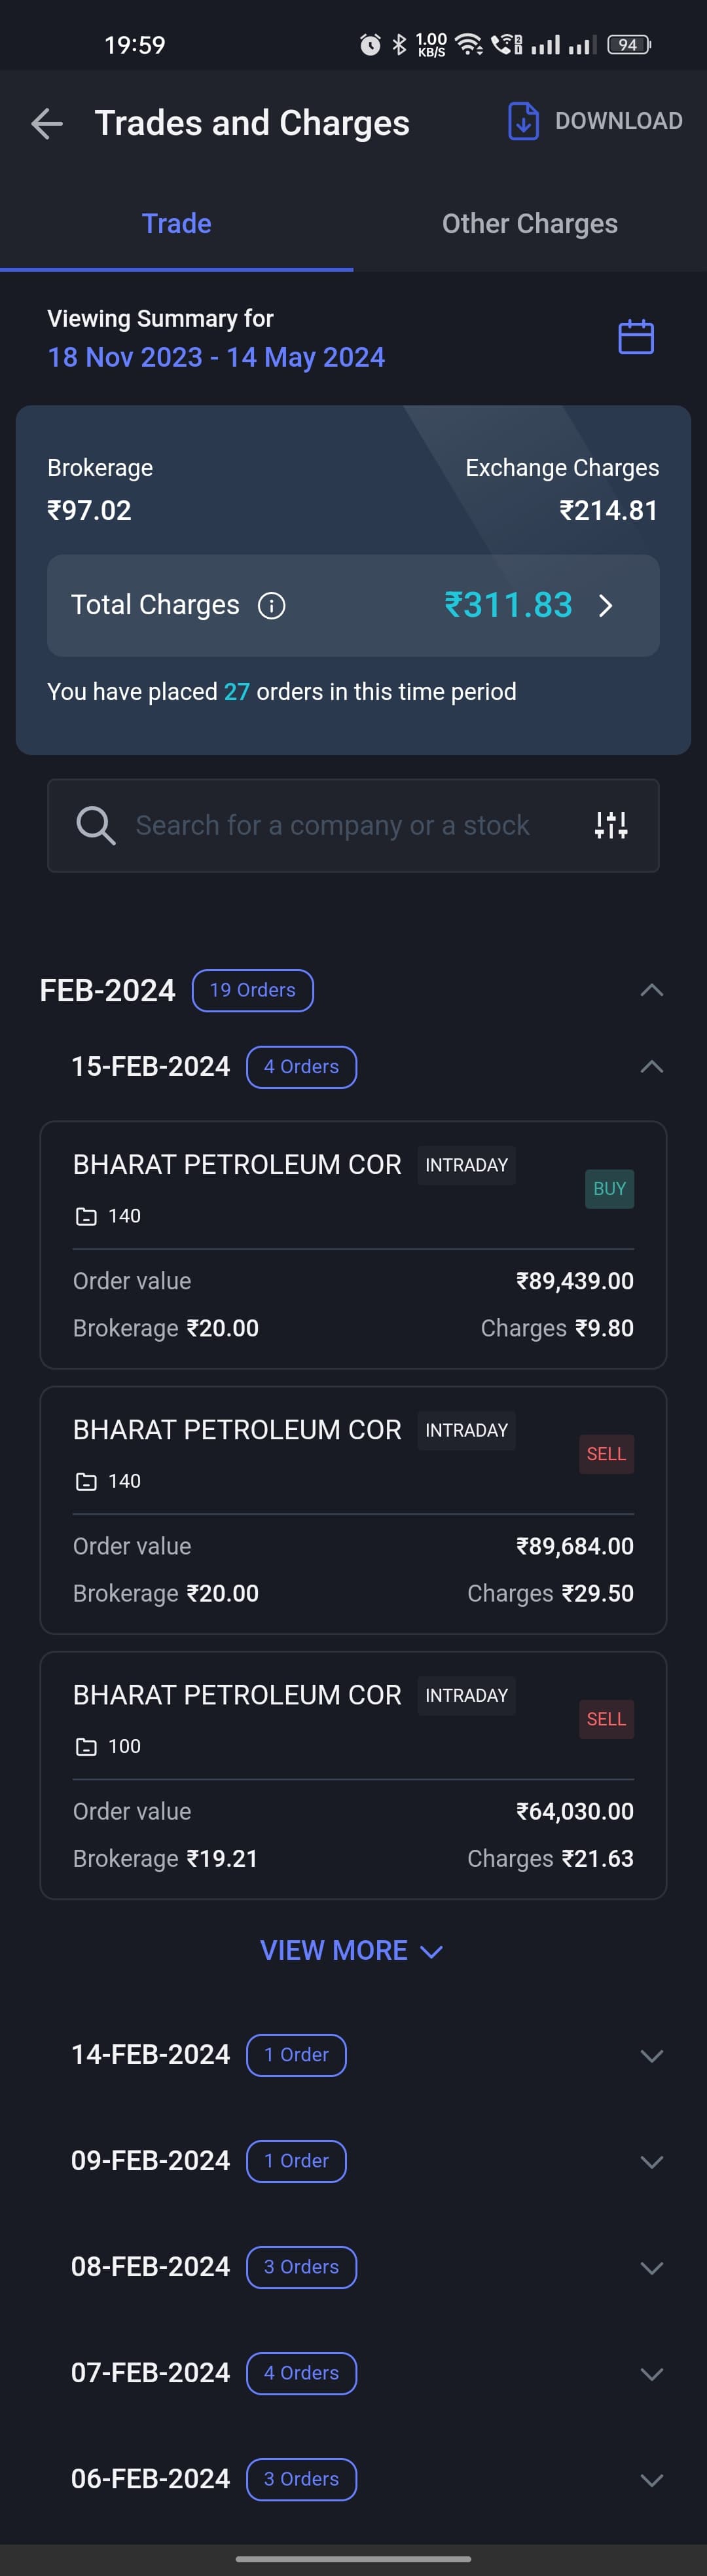
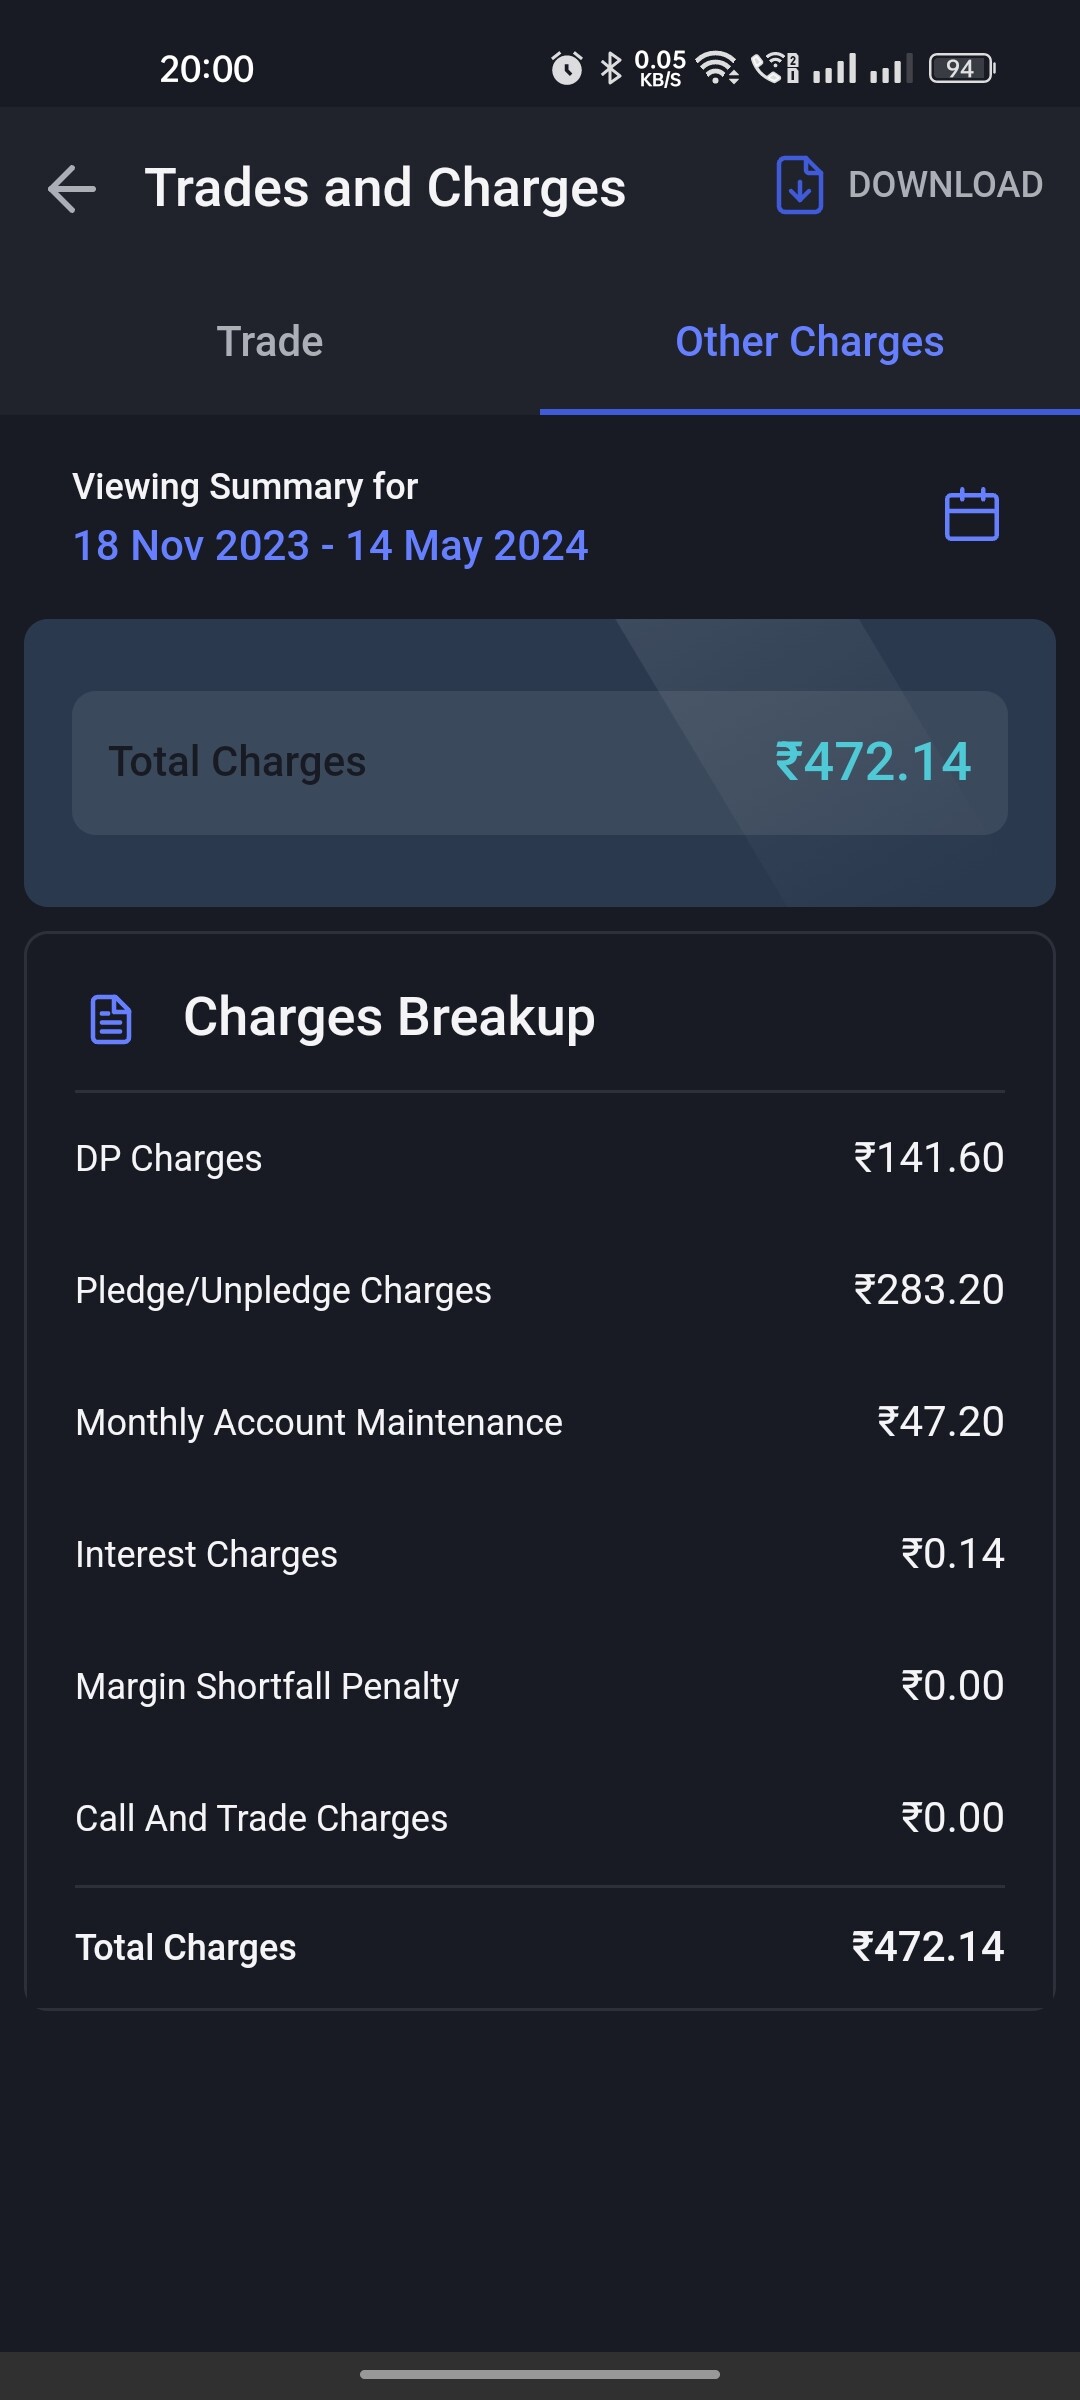
  4. Seeing relativity less charges charged by dhan when compared to industry standards, It will be ideal to follow Angel One when it comes to charges charges for custom periods. I will attach screenshot of same here.

@iamshrimohan @Naman @shraddha @Pranita @PravinJ


2 Likes

Hello @Harish3,

Your second point asked about implied, annualised and historical volatility, specifically wanting to understand where these numbers come from and see them properly.

Advanced Volatility Analysis on Options Trader Web now puts most of this in view: ATM IV plotted continuously against spot, IV Rank and IV Percentile showing where current IV sits against 1 Week to 1 Year lookbacks, IV Skew across strikes, and SD Zones showing 1, 2 and 3 standard deviation ranges calculated from spot.

Insights tab at options-trader.dhan.co.

Does seeing IV against its own history answer the question you were asking, or do you still want the calculation method documented?