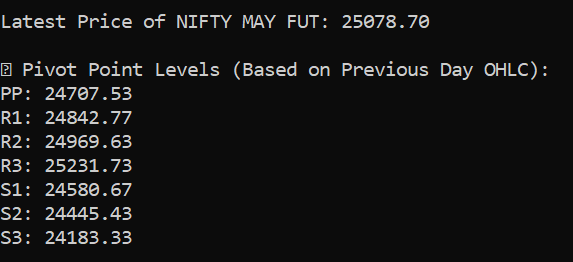
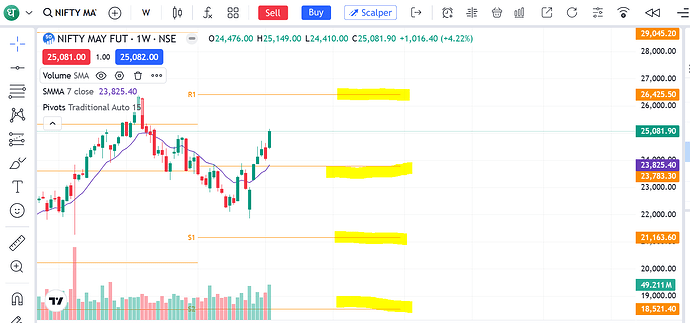
@Tradehull_Imran Sir, can you please provide me with the pivot point code, including P, R1, R2, R3, S1, S2, and S3, so that I can print the data?
I’ve tried many times but haven’t been able to find the correct code and keep failing.
I want the P, R1, R2, R3 support and resistance levels for Nifty and Bank Nifty in a 5-minute time frame. Can you please help me with this? I’ve searched the internet and checked other sources, but I’m not getting any output; it keeps saying ‘no data found’. Please help me with this.
Preformatted text# Retry mechanism to fetch data
def fetch_data():
for attempt in range(3): # Try 3 times
index_chart = tsl.get_historical_data(tradingsymbol=“NIFTY MAR FUT”, exchange=“NFO”, timeframe=“5”)
    print(f"Attempt {attempt + 1}: Checking API response...")

    # Debugging: Print Data Structure
    if isinstance(index_chart, dict):
        print("Response Keys:", index_chart.keys())
    elif isinstance(index_chart, pd.DataFrame):
        print("Received DataFrame with", index_chart.shape[0], "rows")

    # Check if data is valid
    if isinstance(index_chart, dict) and 'candles' in index_chart and len(index_chart['candles']) > 2:
        return pd.DataFrame(index_chart['candles'], columns=["TIMESTAMP", "OPEN", "HIGH", "LOW", "CLOSE", "VOLUME"])

    print("Warning: No candle data found, retrying...")
    time.sleep(2)  # Wait before retrying

return None  # Return None if all attempts fail
Fetch candle data
index_chart = fetch_data()
If data is successfully fetched, process it
if index_chart is not None and not index_chart.empty:
# Convert timestamp
index_chart[“TIMESTAMP”] = pd.to_datetime(index_chart[“TIMESTAMP”], unit=‘s’)
# Extract the last three candles
first_candle = index_chart.iloc[-3]
second_candle = index_chart.iloc[-2]
running_candle = index_chart.iloc[-1]

print("\nExtracted Candles:")
print("First Candle:", first_candle.to_dict())
print("Second Candle:", second_candle.to_dict())
print("Running Candle:", running_candle.to_dict())

# Calculate Pivot Points
index_chart['Pivot'] = (index_chart['HIGH'] + index_chart['LOW'] + index_chart['CLOSE']) / 3
index_chart['R1'] = (2 * index_chart['Pivot']) - index_chart['LOW']
index_chart['S1'] = (2 * index_chart['Pivot']) - index_chart['HIGH']
index_chart['R2'] = index_chart['Pivot'] + (index_chart['HIGH'] - index_chart['LOW'])
index_chart['S2'] = index_chart['Pivot'] - (index_chart['HIGH'] - index_chart['LOW'])
index_chart['R3'] = index_chart['R1'] + (index_chart['HIGH'] - index_chart['LOW'])
index_chart['S3'] = index_chart['S1'] - (index_chart['HIGH'] - index_chart['LOW'])

# Print the latest pivot levels
latest_pivot = index_chart.iloc[-1]
print("\nPivot Points for:", "NIFTY MAR FUT (5-Min Timeframe)")
print("Pivot:", latest_pivot['Pivot'])
print("R1:", latest_pivot['R1'])
print("S1:", latest_pivot['S1'])
print("R2:", latest_pivot['R2'])
print("S2:", latest_pivot['S2'])
print("R3:", latest_pivot['R3'])
print("S3:", latest_pivot['S3'])
else:
print(“\n❌ ERROR: No sufficient candle data found in the response after retries.”)
this is the error which i am getting it
Attempt 1: Checking API response…
Received DataFrame with 225 rows
Warning: No candle data found, retrying…
Attempt 2: Checking API response…
Received DataFrame with 225 rows
Warning: No candle data found, retrying…
Attempt 3: Checking API response…
Received DataFrame with 225 rows
Warning: No candle data found, retrying…
![]() ERROR: No sufficient candle data found in the response after retries.
ERROR: No sufficient candle data found in the response after retries.Preformatted text

