you guys are introducing amazing indicators on trading view,like oi data,i am looking forward the day you introduce the above indicators which is crucial for scalping.
thanks in anticipation
amiteswar sen
you guys are introducing amazing indicators on trading view,like oi data,i am looking forward the day you introduce the above indicators which is crucial for scalping.
thanks in anticipation
amiteswar sen
Hi @9425178487
We just introduced Open Interest (OI) indicator across all platforms on our charts today. More details here: Introducing: Open Interest (OI) Indicators on Dhan Platforms & TradingView Charts
Also your personal mobile number seem to be seem, request you to please change the userid on this forum for your privacy. Thank you.
i am unable to change the user id, please send me the flow how to do it
Buyers initiated quantity and sellers initiated quatity is it an indicator if it is, how can i apply on chart.
Guys, this is an impossible indicator. Even brokers don’t have access to this underlying secret data (buyers/sellers initiated quantity).
Of course brokers have access to buyer/seller initiated transaction data that is done only on their own platform. But always remember more than 80% volume is driven by NSE algorithms and their internal trading bots.
NSE keeps this data hidden and is not accessible to any retail or corporate traders. This is to prevent any kind of biasness in the market.
NSE gives access to an overall Open Interest data and that to every 3min only.
@PravinJ Please correct me if I’m missing anything or comment on the possibility of such indicator.
Yes @pratik01, this is correct.
Correct me if I m wrong, this (buyer/sellerinitiated order) is available on Quantsapp and Gocharting.
I think this is called level 3 (or may be level 2) data and NSE provides it on extra payment (big money involved), so don’t think a broker is going to provide it
Hi Pravin,
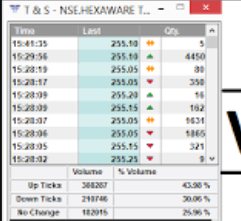
can’t u capture the tick data volume up, down - quantity & price (PFA : fyers one desktop app) & show us in the delta & cumulative delta indicator format like Gocharting does ? delta = buy volume - sell volume , cumulative delta = cumulative (buy - sell volume) intraday.
Similarly delta values & cumulative delta values can come if (volume*price) at tick level is data is fetched accurately.
If not this, can u guys atleast come up with volume*price = turnover value indicator : can be a great help for option traders ?
I think these datas can’t be out in real time. Quantsapp is providing it by using their own algorithm. They only anticipate if largr volume has been bought or sold on market price then it reflacted as Buyer initiated or seller initiated qty. I thing that can’t be in anyone’s hand except NSE …
It’s not an impossible indicator @pratik01 @PravinJ . This is the most basic mechanism of market. Trade only takes place when its either buyer-initiated or seller-initiated otherwise there is no trade and the people sitting on bid and ask will never gets filled. This is how market works. So this should be available with all the brokers and can be easily observed in qunatower, chartink, and other software who uses footprint or do orderbook analysis. Shame its not available with most of the brokers